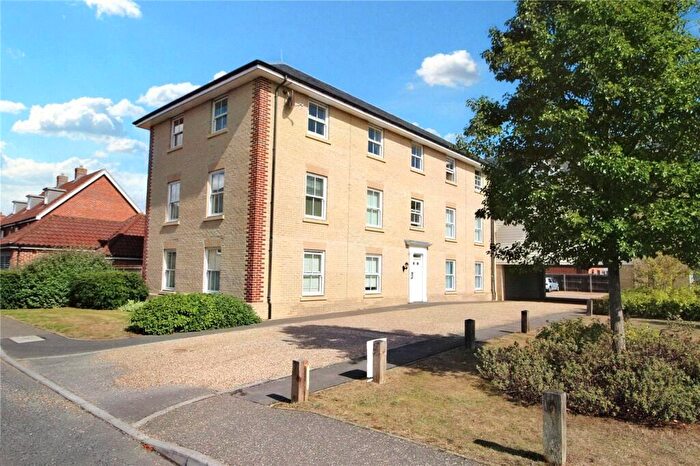
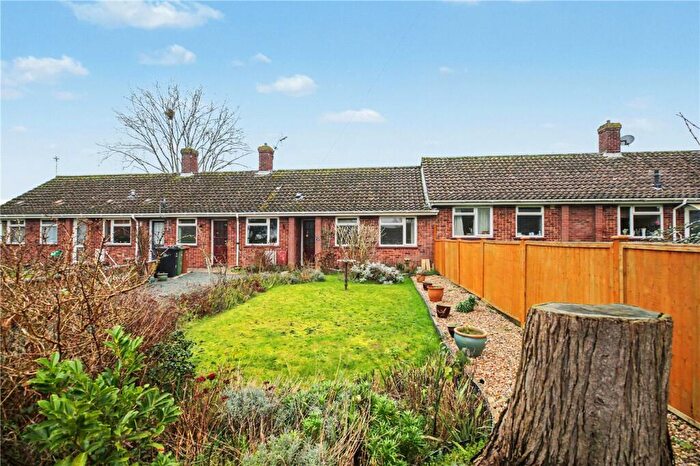
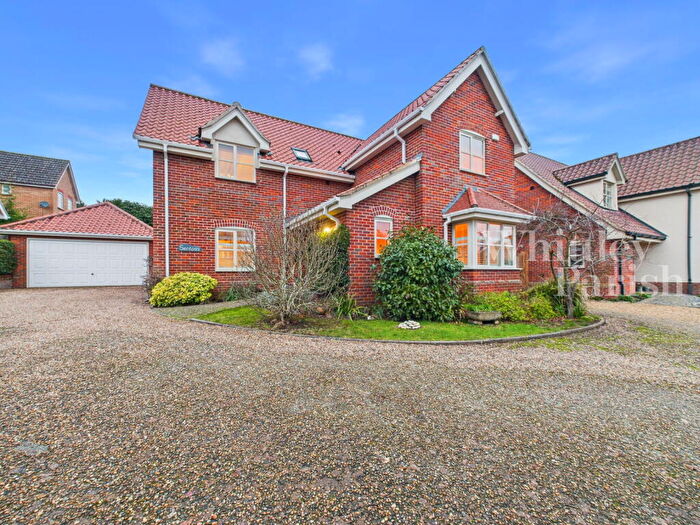
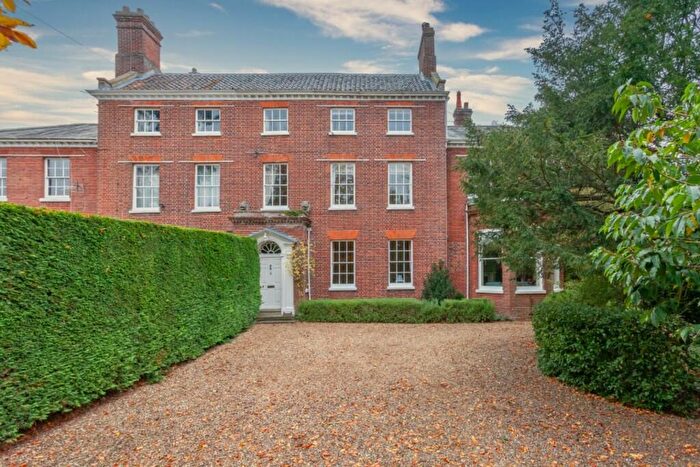
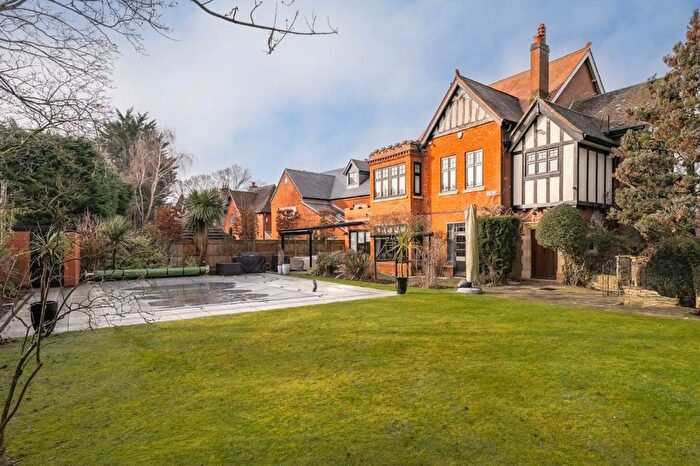
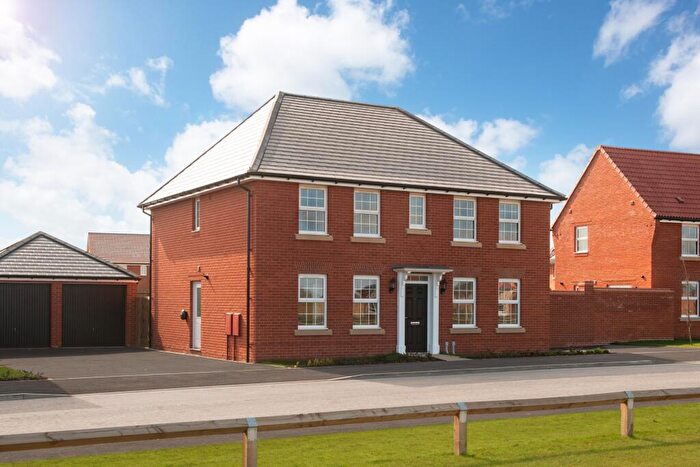
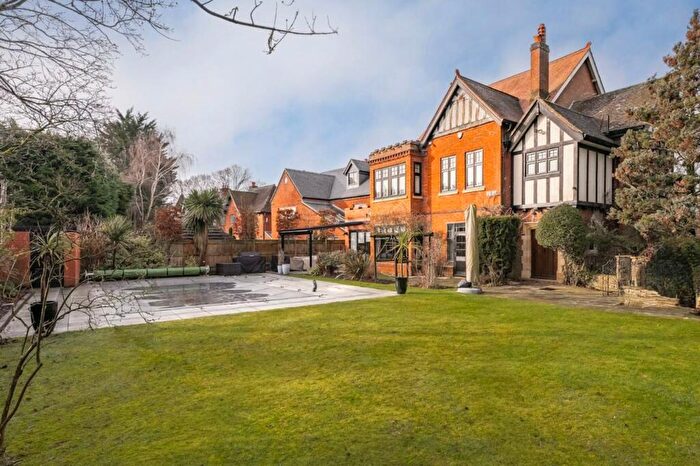
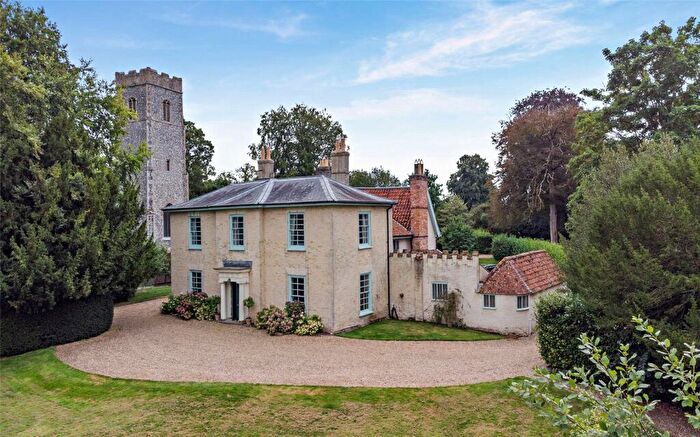
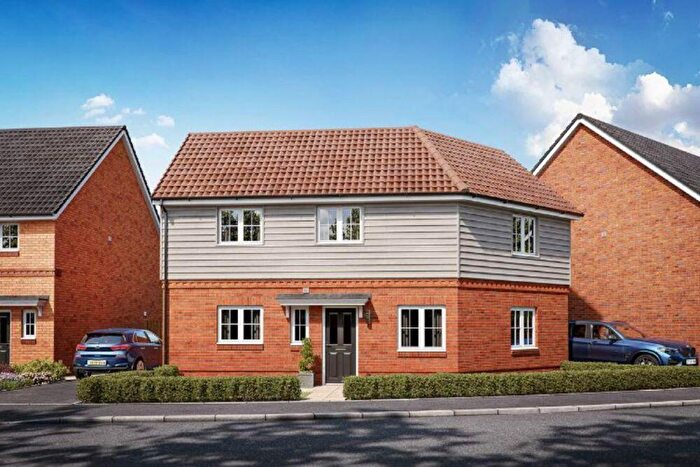
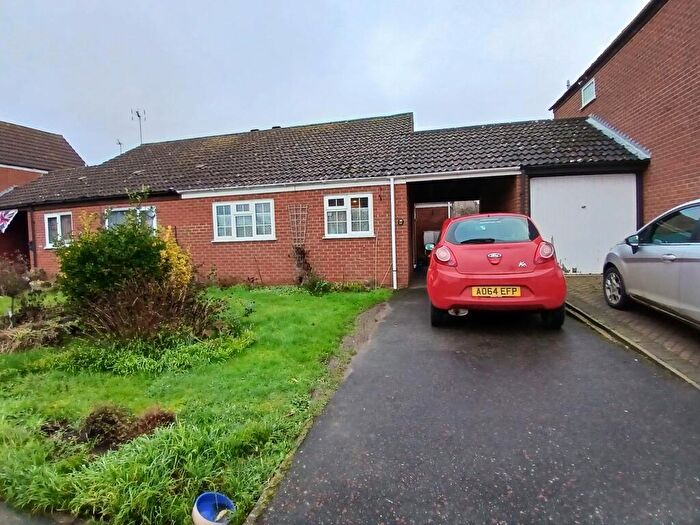
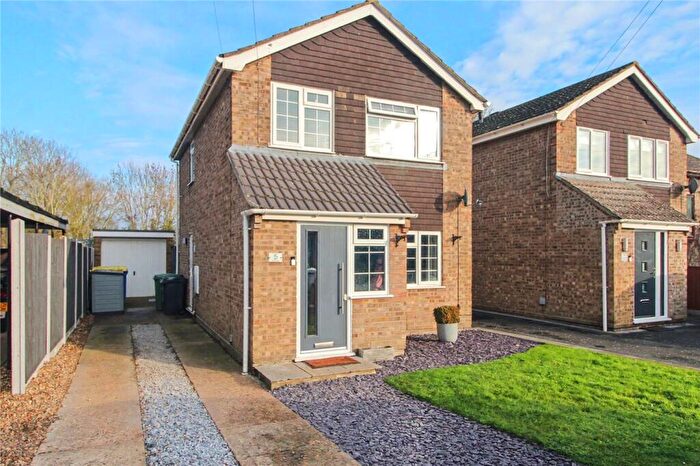
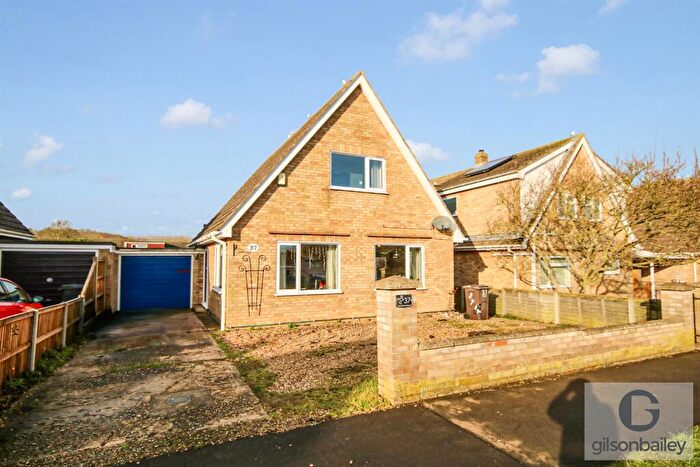
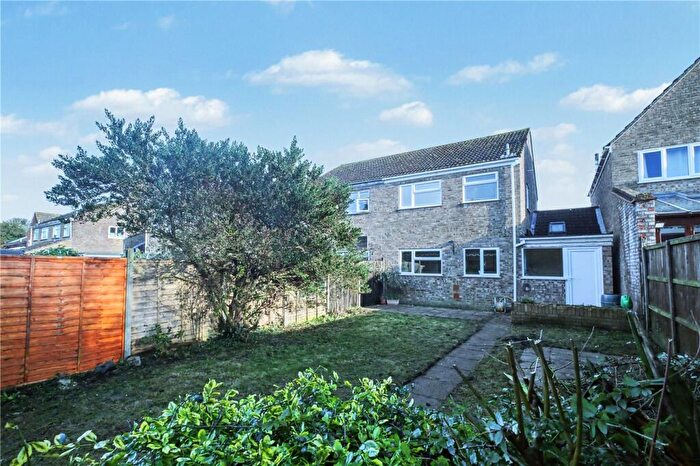
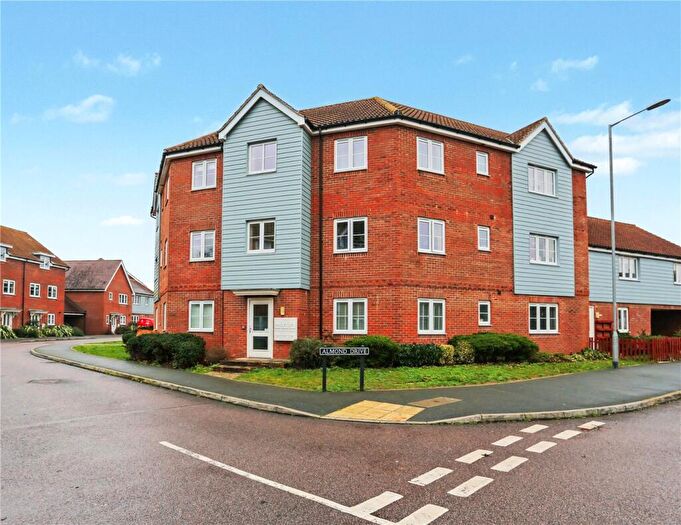
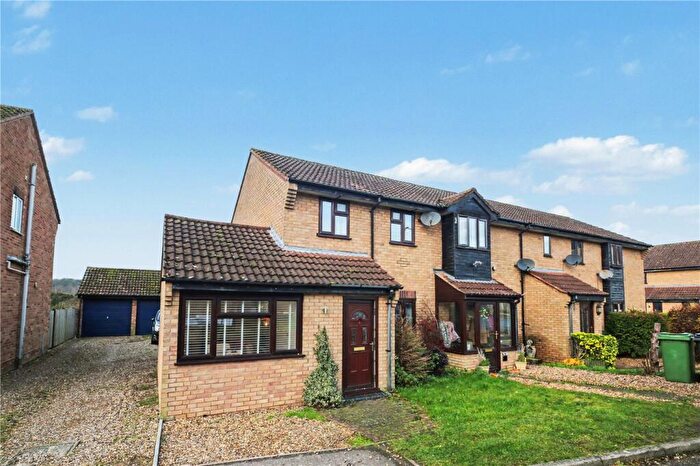
Houses for sale & to rent in Mulbarton, Norwich
House Prices in Mulbarton
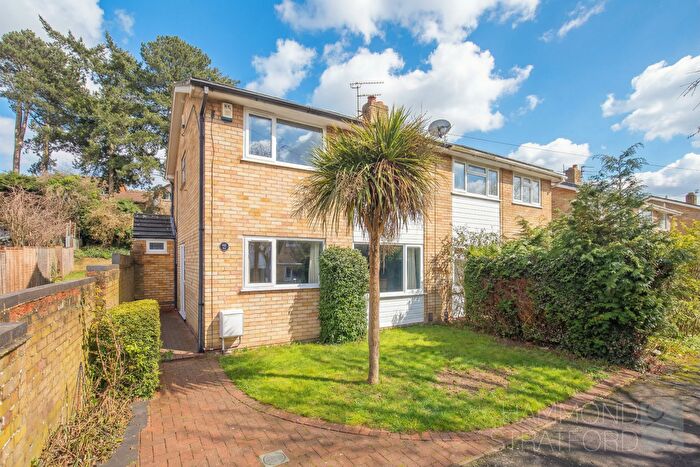
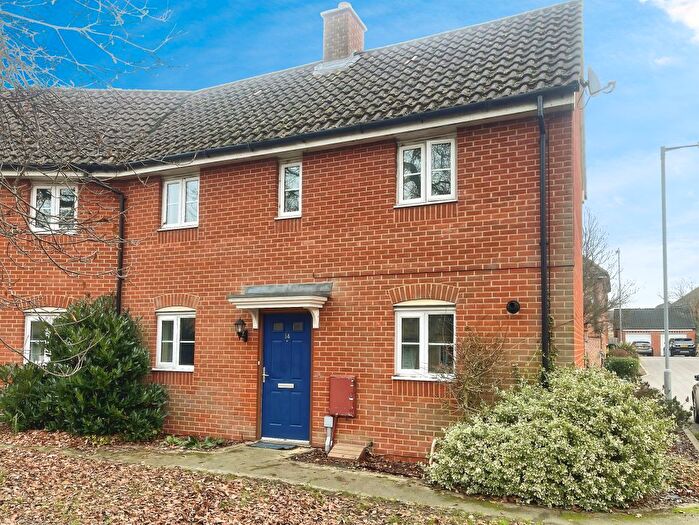
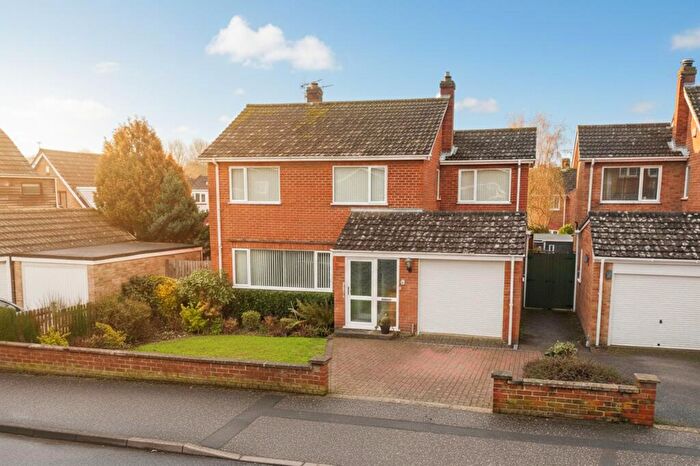
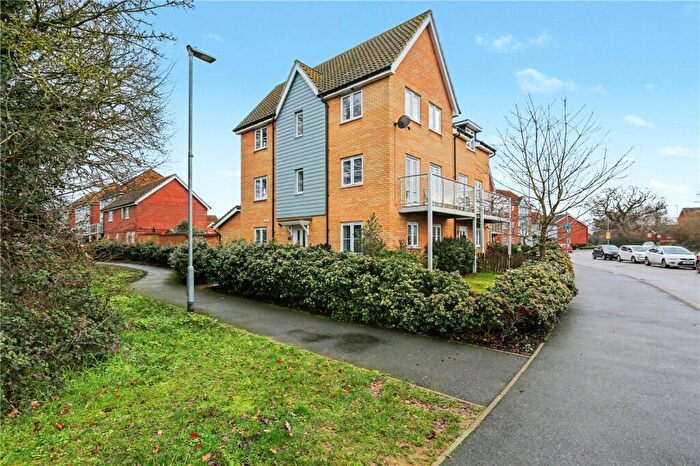
Properties in Mulbarton have an average house price of £359,513.00 and had 173 Property Transactions within the last 3 years¹.
Mulbarton is an area in Norwich, Norfolk with 1,923 households², where the most expensive property was sold for £1,100,000.00.
Properties for sale in Mulbarton
Roads and Postcodes in Mulbarton
Navigate through our locations to find the location of your next house in Mulbarton, Norwich for sale or to rent.
| Streets | Postcodes |
|---|---|
| Alder Close | NR14 8BQ |
| Badger Close | NR14 8NT |
| Birchfield Gardens | NR14 8BT |
| Birchfield Lane | NR14 8AA NR14 8BS NR14 8BZ |
| Bluebell Road | NR14 8AR NR14 8BN NR14 8BW |
| Bobbins Way | NR14 8DT |
| Brewertons Yard | NR14 8HF |
| Brindle Drive | NR14 8BX |
| Bromedale Avenue | NR14 8GG NR14 8GZ |
| Brownes Lane | NR14 8UG |
| Cantley Lane | NR4 6TD NR4 6TF |
| Castelins Way | NR14 8GH |
| Catmere Herne | NR14 8NU |
| Cavell Close | NR14 8DH |
| Chappshill Way | NR14 8GN |
| Chestnut Close | NR14 8FA |
| Church Road | NR14 8PS |
| Cornfield Road | NR14 8GQ |
| Cowslip Close | NR14 8BG |
| Cranes Road | NR14 8HB |
| Cuckoofield Lane | NR14 8AY NR14 8AZ NR14 8BA NR14 8EJ |
| East Carleton Road | NR14 8HL NR14 8HN |
| Elm Close | NR14 8AU |
| Flordon Road | NR14 8DP |
| Forge Orchards | NR14 8JH |
| Gowing Road | NR14 8AP NR14 8AT |
| Hall Road | NR14 8HA |
| Hare Close | NR14 8QQ |
| Hawkes Lane | NR14 8EW |
| Hethersett Road | NR14 8HX |
| High Common | NR14 8DL |
| Hillside Close | NR14 8DY |
| Intwood Lane | NR14 8EA NR14 8JZ |
| Kenningham Close | NR14 8WA |
| Kestrel Close | NR14 8BD |
| Lakes Avenue | NR14 8BY |
| Lark Rise | NR14 8BE NR14 8EE NR14 8EG |
| Laws Lane | NR14 8HH |
| Long Lane | NR14 8AN NR14 8AW |
| Low Common | NR14 8LG |
| Main Road | NR14 8AD NR14 8DF NR14 8DU |
| Malleson Place | NR14 8JA |
| Mangreen Lane | NR14 8DD |
| Marsh Lane | NR14 8EP |
| Meadow Way | NR14 8HZ |
| Meadows Drive | NR14 8GX |
| Mergate Lane | NR14 8ER |
| Nightingale Close | NR14 8BB |
| Norwich Road | NR14 8DE NR14 8JN NR14 8JP NR14 8JR NR14 8JT |
| Oatfield Chase | NR14 8GU |
| Old Rectory Close | NR14 8LX |
| Otter Drive | NR14 8QG |
| Owl Drive | NR14 8JE |
| Partridge Drive | NR14 8RL |
| Pheasant Close | NR14 8BL |
| Pightle Close | NR14 8GJ |
| Poorhouse Lane | NR14 8EN |
| Porterbush Road | NR14 8GL |
| Primrose Close | NR14 8BJ |
| Rectory Lane | NR14 8AG NR14 8HD |
| Rectory Road | NR14 8HT |
| Robin Close | NR14 8EF |
| Rosary Close | NR14 8AX |
| Ryefield Road | NR14 8FD NR14 8GS |
| School Close | NR14 8HQ |
| School Road | NR14 8HG NR14 8HJ |
| Scotts Hill | NR14 8HP |
| Short Lane | NR14 8DX |
| Shotesham Road | NR14 8AQ |
| Southern Reach | NR14 8BU |
| Sowdlefield Walk | NR14 8GP |
| St Nicholass | NR14 8JD |
| St Omer Close | NR14 8JU |
| Station Lane | NR9 3AZ |
| Stile Close | NR14 8BH |
| Swardeston Lane | NR14 8LF |
| Tee Close | NR14 8QF |
| The Common | NR14 8AE NR14 8DZ NR14 8EB NR14 8JQ NR14 8JS |
| The Drift | NR14 8LQ |
| The Rosery | NR14 8AL |
| The Street | NR14 8EL |
| The Wood | NR14 8DJ |
| Thrush Close | NR14 8JF |
| Tudor Way | NR14 8BP |
| Wheatfield Road | NR14 8GT |
| Wild Radish Close | NR14 8DB |
| Wood Gardens | NR14 8UQ |
| Wood Lane | NR14 8DQ |
| Woodyard Close | NR14 8AS |
| Wymondham Road | NR14 8EU NR14 8HY NR14 8JB |
| Yesmere | NR14 8NS |
| NR14 8DG NR14 8DR NR14 8EH NR14 8HS NR14 8HW |
Transport near Mulbarton
-
Wymondham Station
-
Norwich Station
-
Spooner Row Station
-
Brundall Gardens Station
-
Attleborough Station
-
Brundall Station
- FAQ
- Price Paid By Year
- Property Type Price
Frequently asked questions about Mulbarton
What is the average price for a property for sale in Mulbarton?
The average price for a property for sale in Mulbarton is £359,513. This amount is 17% higher than the average price in Norwich. There are 1,273 property listings for sale in Mulbarton.
What streets have the most expensive properties for sale in Mulbarton?
The streets with the most expensive properties for sale in Mulbarton are Rectory Road at an average of £731,500, Pightle Close at an average of £725,000 and Meadows Drive at an average of £695,000.
What streets have the most affordable properties for sale in Mulbarton?
The streets with the most affordable properties for sale in Mulbarton are Nightingale Close at an average of £150,000, Tee Close at an average of £200,000 and Ryefield Road at an average of £208,500.
Which train stations are available in or near Mulbarton?
Some of the train stations available in or near Mulbarton are Wymondham, Norwich and Spooner Row.
Property Price Paid in Mulbarton by Year
The average sold property price by year was:
| Year | Average Sold Price | Price Change |
Sold Properties
|
|---|---|---|---|
| 2025 | £375,657 | 8% |
54 Properties |
| 2024 | £344,969 | -4% |
55 Properties |
| 2023 | £358,391 | -6% |
64 Properties |
| 2022 | £380,313 | 13% |
81 Properties |
| 2021 | £330,071 | 14% |
125 Properties |
| 2020 | £284,716 | 4% |
58 Properties |
| 2019 | £273,895 | -11% |
86 Properties |
| 2018 | £303,406 | 3% |
93 Properties |
| 2017 | £293,933 | 9% |
86 Properties |
| 2016 | £266,506 | 10% |
92 Properties |
| 2015 | £240,710 | -9% |
92 Properties |
| 2014 | £261,792 | 10% |
81 Properties |
| 2013 | £235,751 | 6% |
98 Properties |
| 2012 | £221,955 | -11% |
89 Properties |
| 2011 | £246,961 | 10% |
79 Properties |
| 2010 | £221,989 | 21% |
78 Properties |
| 2009 | £175,481 | -29% |
106 Properties |
| 2008 | £226,780 | 6% |
75 Properties |
| 2007 | £214,255 | -4% |
139 Properties |
| 2006 | £221,808 | 11% |
124 Properties |
| 2005 | £197,198 | 0,2% |
116 Properties |
| 2004 | £196,711 | 23% |
125 Properties |
| 2003 | £151,960 | 15% |
74 Properties |
| 2002 | £128,605 | 8% |
67 Properties |
| 2001 | £118,382 | 28% |
71 Properties |
| 2000 | £85,184 | -7% |
73 Properties |
| 1999 | £91,351 | 23% |
81 Properties |
| 1998 | £70,207 | 7% |
70 Properties |
| 1997 | £65,546 | 1% |
65 Properties |
| 1996 | £65,047 | 3% |
62 Properties |
| 1995 | £63,125 | - |
50 Properties |
Property Price per Property Type in Mulbarton
Here you can find historic sold price data in order to help with your property search.
The average Property Paid Price for specific property types in the last three years are:
| Property Type | Average Sold Price | Sold Properties |
|---|---|---|
| Semi Detached House | £315,806.00 | 48 Semi Detached Houses |
| Detached House | £447,686.00 | 82 Detached Houses |
| Terraced House | £261,700.00 | 34 Terraced Houses |
| Flat | £158,777.00 | 9 Flats |

