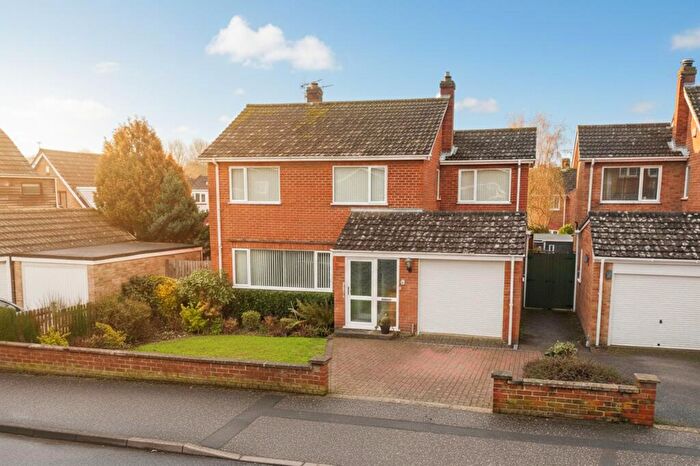
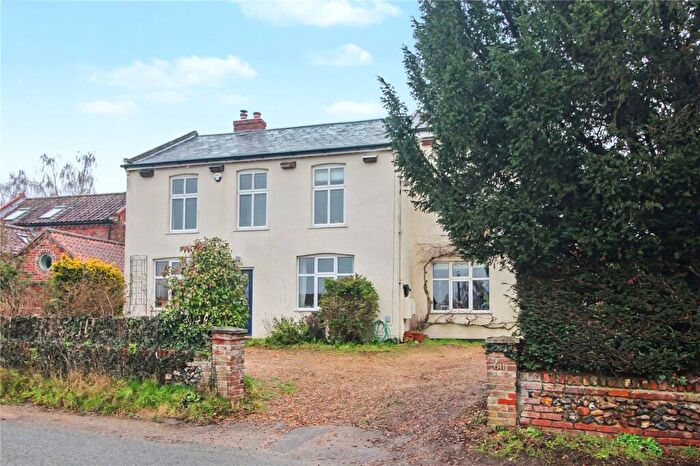
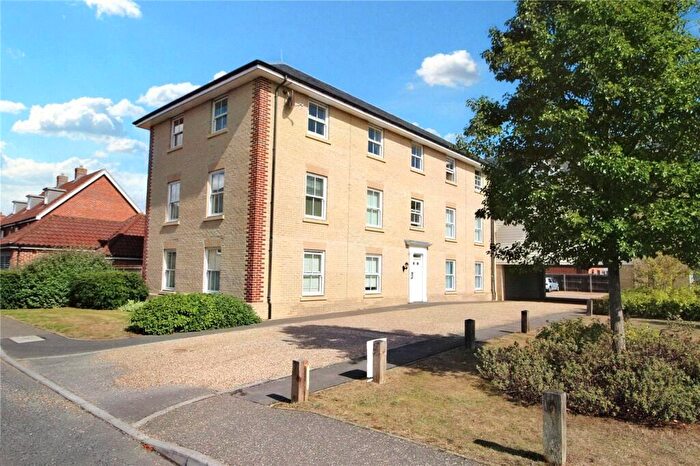
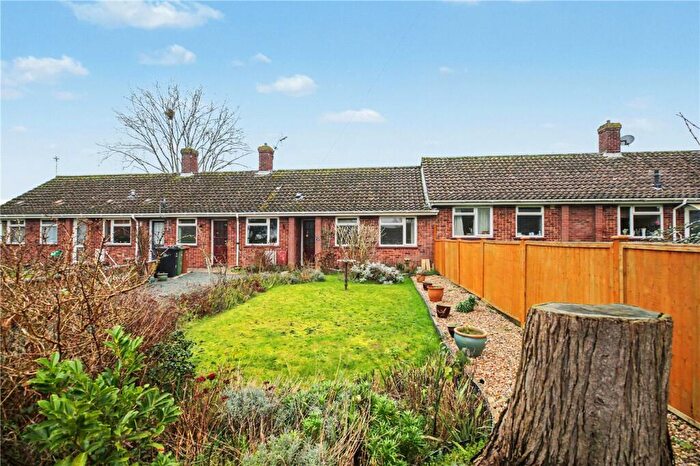
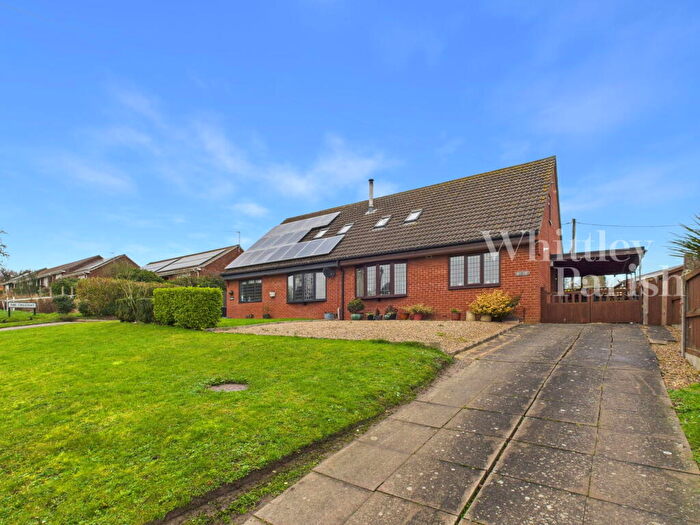
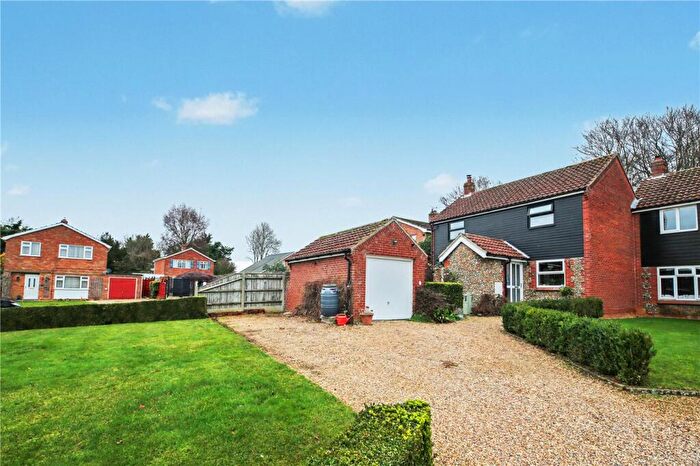
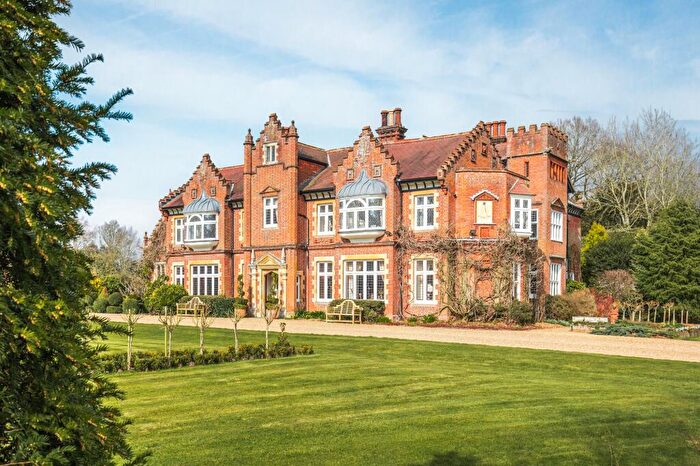
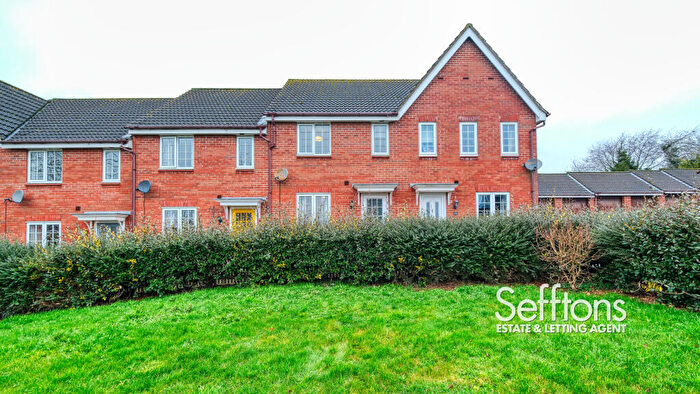
Houses for sale & to rent in Tasburgh, Norwich
House Prices in Tasburgh
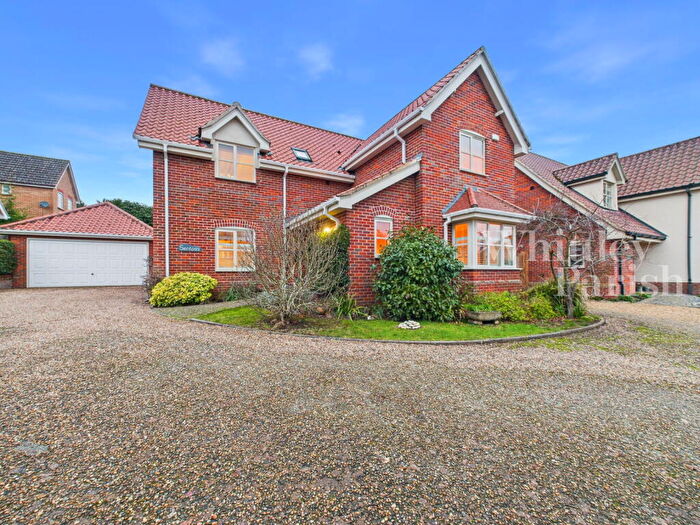
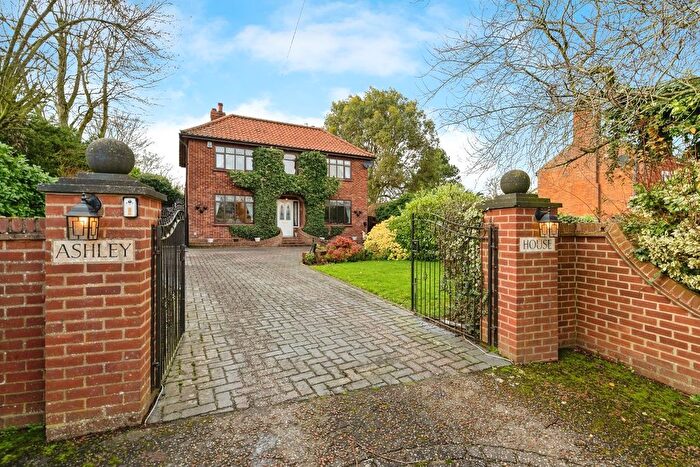
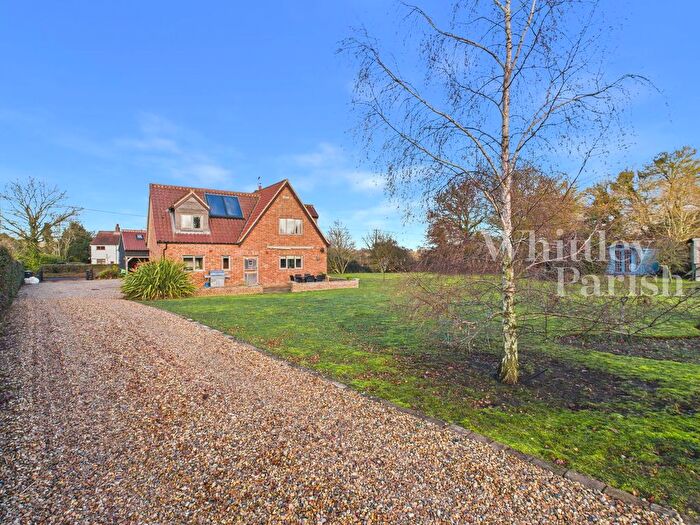
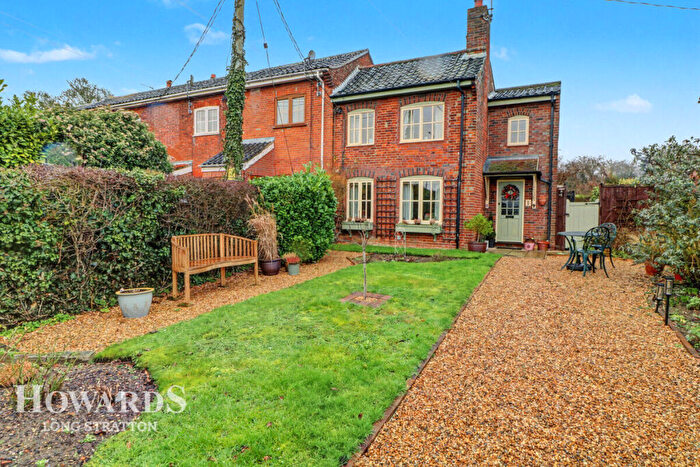
Properties in Tasburgh have an average house price of £439,181.00 and had 84 Property Transactions within the last 3 years¹.
Tasburgh is an area in Norwich, Norfolk with 928 households², where the most expensive property was sold for £1,275,000.00.
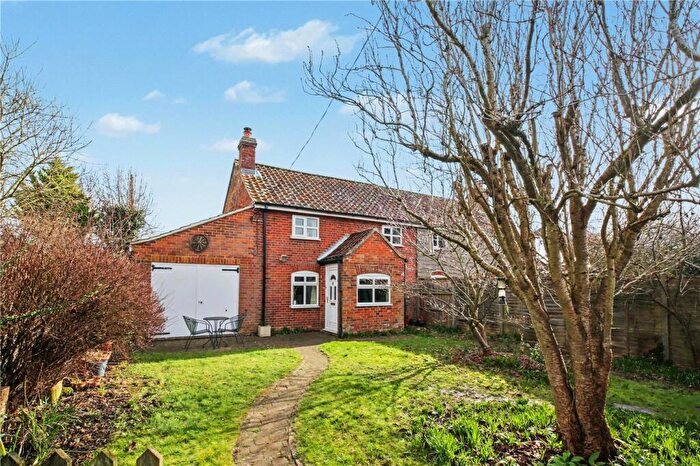
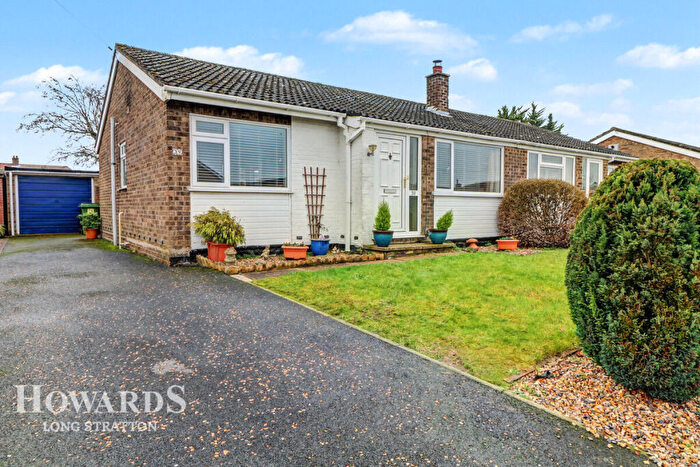
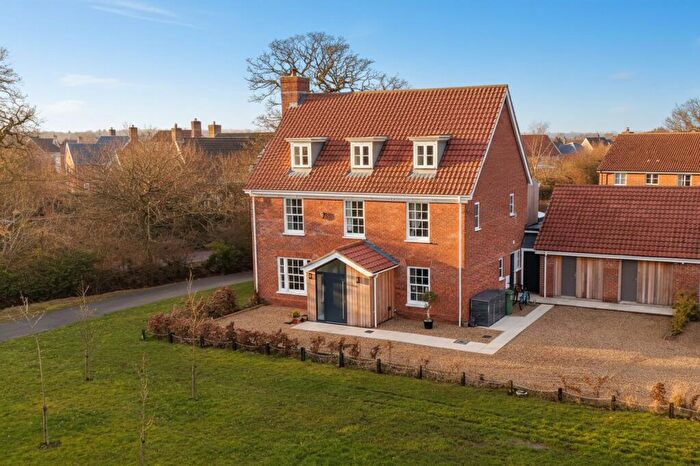
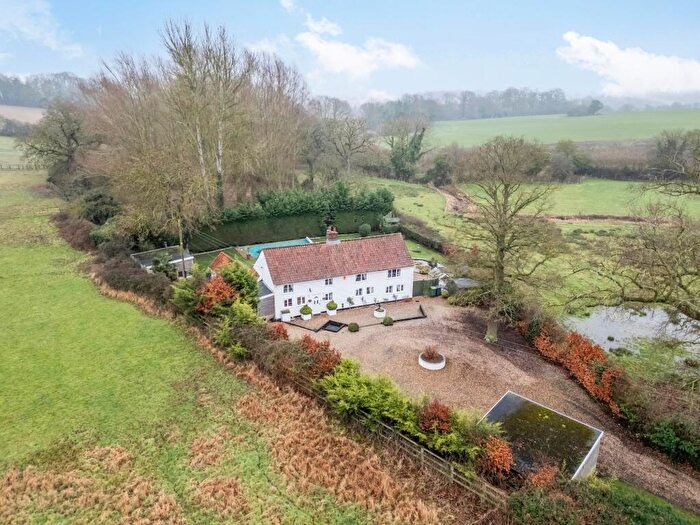
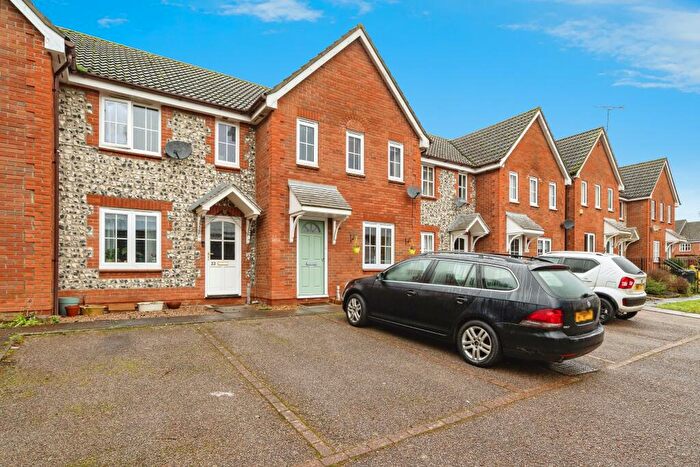
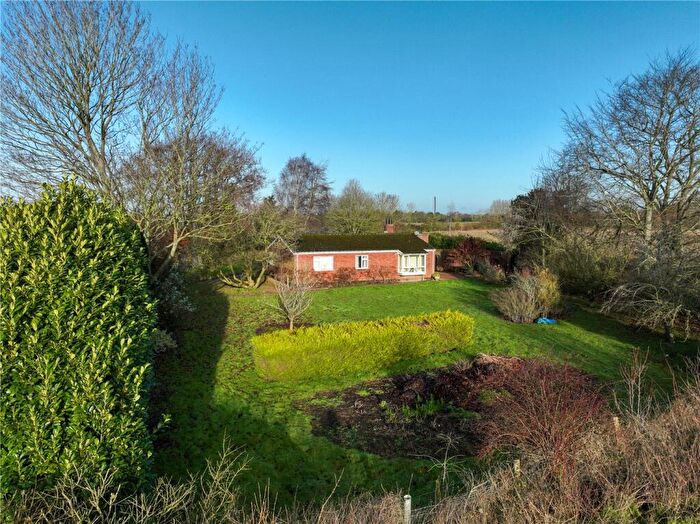
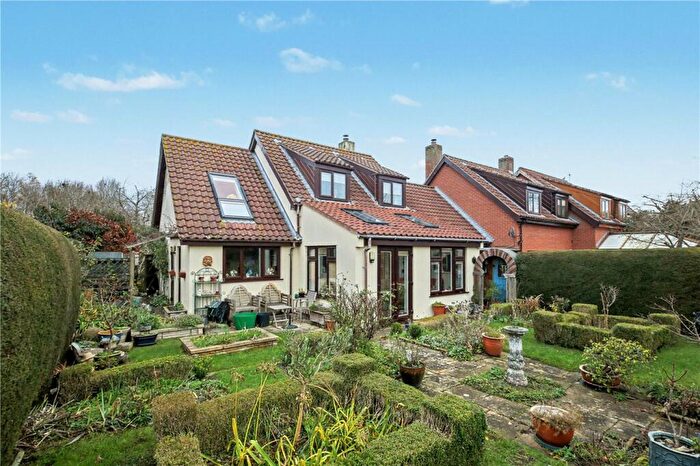
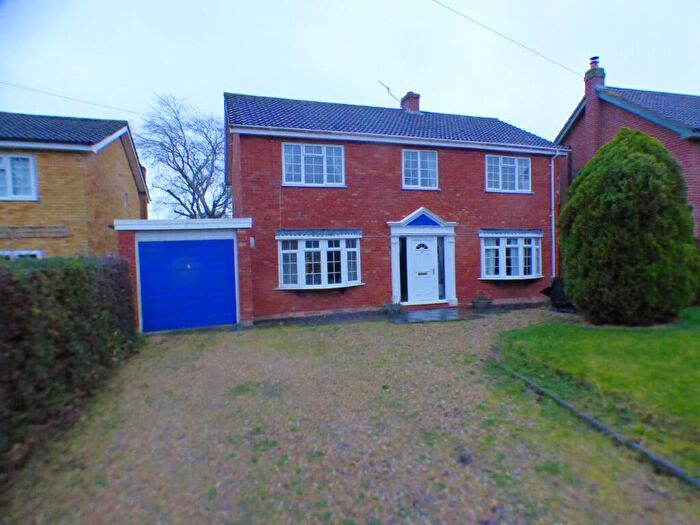
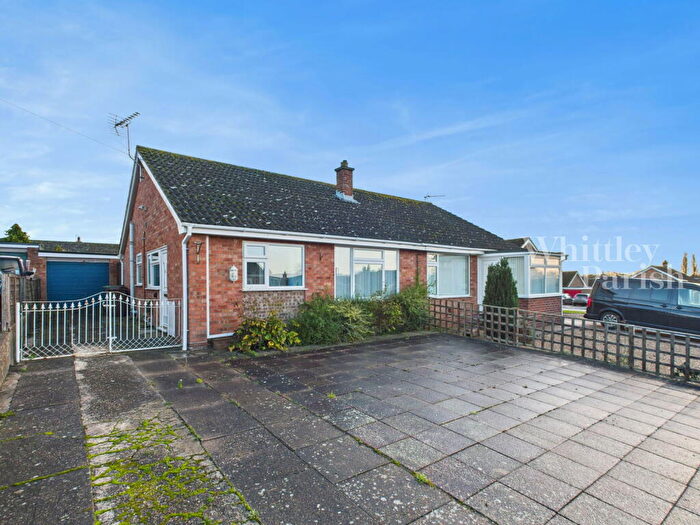
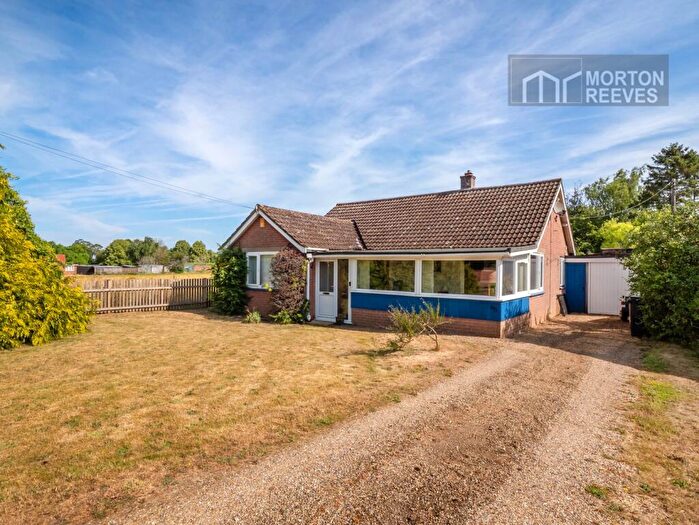
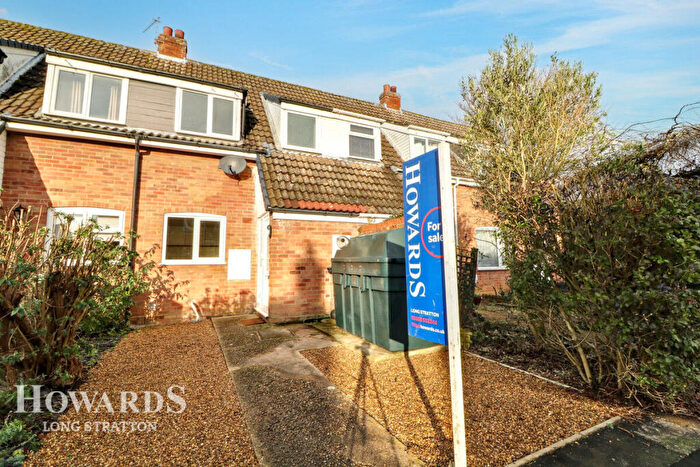
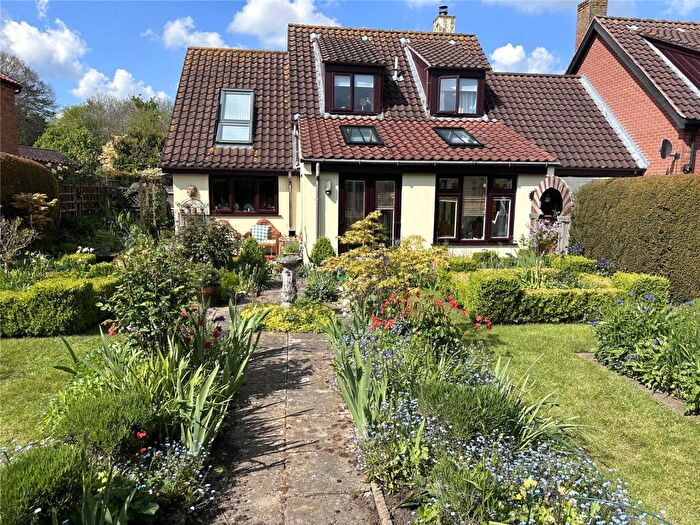
Properties for sale in Tasburgh
Roads and Postcodes in Tasburgh
Navigate through our locations to find the location of your next house in Tasburgh, Norwich for sale or to rent.
| Streets | Postcodes |
|---|---|
| Baxters Lane | NR15 1XP |
| Brooke Road | NR15 1XL NR15 1XN |
| Cargate Lane | NR15 1TS NR15 1TU |
| Chapel Lane | NR15 1YP |
| Chequers Lane | NR15 1TQ |
| Chestnut Road | NR15 1UH |
| Church Hill | NR15 1NB NR15 1TD |
| Church Road | NR15 1ND |
| Curson Road | NR15 1NH |
| Everson Close | NR15 1LL |
| Everson Road | NR15 1NQ |
| Grove Lane | NR15 1LR |
| Grubb Street | NR15 1YT |
| Harvey Close | NR15 1LS |
| Hastings Close | NR15 1NY |
| Hawes Green | NR15 1UL NR15 1UP NR15 1UW |
| Henry Preston Road | NR15 1NU |
| Hollow Lane | NR15 1YE |
| Ipswich Road | NR15 1NS NR15 1NT NR15 1TX NR15 1UB |
| Kensington Close | NR15 1TR |
| Kingsway | NR15 1UA |
| Lammas Road | NR15 1NZ |
| Low Road | NR15 1AR NR15 1LT |
| Marlbottom | NR15 1NP |
| Matthews Close | NR15 1LJ |
| New Cottages | NR15 1SZ |
| Norwich Road | NR15 1TP NR15 1UZ NR15 1XD |
| Oak Close | NR15 1UN |
| Orchard Way | NR15 1NJ |
| Pitts Hill | NR15 1PB |
| Pitts Hill Close | NR15 1AZ |
| Prior Close | NR15 1LH |
| Priory Lane | NR15 1UJ |
| Quaker Lane | NR15 1NN |
| Riches Close | NR15 1NX |
| Rogers Lane | NR15 1XG |
| Saxlingham Lane | NR15 1LP |
| Saxlingham Nethergate | NR15 1TE |
| Shotesham Lane | NR15 1SU |
| Skeets Hill | NR15 1UR |
| Spot Cottages | NR15 1XR |
| Steward Close | NR15 1AN |
| Stubbs Green | NR15 1YA |
| Swan Cottages | NR15 1SY |
| Tasburgh Road | NR15 1LN |
| The Common | NR15 1YD NR15 1YQ |
| The Green | NR15 1TF NR15 1TG NR15 1TH |
| The Grove | NR15 1XJ |
| The Street | NR15 1AJ NR15 1AP NR15 1TA NR15 1XH NR15 1YG NR15 1YL NR15 1YW |
| Valley Road | NR15 1NG |
| Wash Lane | NR15 1XX |
| West End | NR15 1UE NR15 1UF |
| Willow Close | NR15 1NE |
| Windy Lane | NR15 1UG |
| Woodland Rise | NR15 1NF |
| NR15 1LU NR15 1NA NR15 1UX NR15 1XF |
Transport near Tasburgh
-
Norwich Station
-
Wymondham Station
-
Spooner Row Station
-
Brundall Gardens Station
-
Brundall Station
-
Buckenham Station
- FAQ
- Price Paid By Year
- Property Type Price
Frequently asked questions about Tasburgh
What is the average price for a property for sale in Tasburgh?
The average price for a property for sale in Tasburgh is £439,181. This amount is 43% higher than the average price in Norwich. There are 790 property listings for sale in Tasburgh.
What streets have the most expensive properties for sale in Tasburgh?
The streets with the most expensive properties for sale in Tasburgh are Tasburgh Road at an average of £875,000, Brooke Road at an average of £850,000 and Chapel Lane at an average of £830,000.
What streets have the most affordable properties for sale in Tasburgh?
The streets with the most affordable properties for sale in Tasburgh are Oak Close at an average of £213,250, Everson Road at an average of £230,000 and Woodland Rise at an average of £237,000.
Which train stations are available in or near Tasburgh?
Some of the train stations available in or near Tasburgh are Norwich, Wymondham and Spooner Row.
Property Price Paid in Tasburgh by Year
The average sold property price by year was:
| Year | Average Sold Price | Price Change |
Sold Properties
|
|---|---|---|---|
| 2025 | £424,747 | -16% |
24 Properties |
| 2024 | £494,483 | 21% |
31 Properties |
| 2023 | £392,010 | -23% |
29 Properties |
| 2022 | £481,876 | -4% |
27 Properties |
| 2021 | £498,758 | 21% |
29 Properties |
| 2020 | £392,571 | 15% |
23 Properties |
| 2019 | £333,220 | 3% |
34 Properties |
| 2018 | £323,283 | 1% |
15 Properties |
| 2017 | £319,791 | -11% |
24 Properties |
| 2016 | £354,955 | 14% |
29 Properties |
| 2015 | £304,351 | 7% |
26 Properties |
| 2014 | £282,164 | 2% |
48 Properties |
| 2013 | £276,326 | -2% |
36 Properties |
| 2012 | £281,340 | 12% |
22 Properties |
| 2011 | £247,345 | -24% |
21 Properties |
| 2010 | £307,851 | 30% |
38 Properties |
| 2009 | £216,414 | -59% |
24 Properties |
| 2008 | £343,737 | 17% |
23 Properties |
| 2007 | £284,789 | 1% |
35 Properties |
| 2006 | £282,476 | 17% |
46 Properties |
| 2005 | £235,515 | 8% |
29 Properties |
| 2004 | £215,783 | 7% |
43 Properties |
| 2003 | £200,494 | 17% |
44 Properties |
| 2002 | £167,057 | 21% |
59 Properties |
| 2001 | £131,796 | -9% |
75 Properties |
| 2000 | £144,216 | 32% |
34 Properties |
| 1999 | £98,343 | 2% |
51 Properties |
| 1998 | £96,718 | -9% |
37 Properties |
| 1997 | £105,197 | 23% |
35 Properties |
| 1996 | £81,276 | -5% |
43 Properties |
| 1995 | £85,336 | - |
26 Properties |
Property Price per Property Type in Tasburgh
Here you can find historic sold price data in order to help with your property search.
The average Property Paid Price for specific property types in the last three years are:
| Property Type | Average Sold Price | Sold Properties |
|---|---|---|
| Semi Detached House | £349,654.00 | 24 Semi Detached Houses |
| Detached House | £511,549.00 | 52 Detached Houses |
| Terraced House | £237,375.00 | 8 Terraced Houses |

