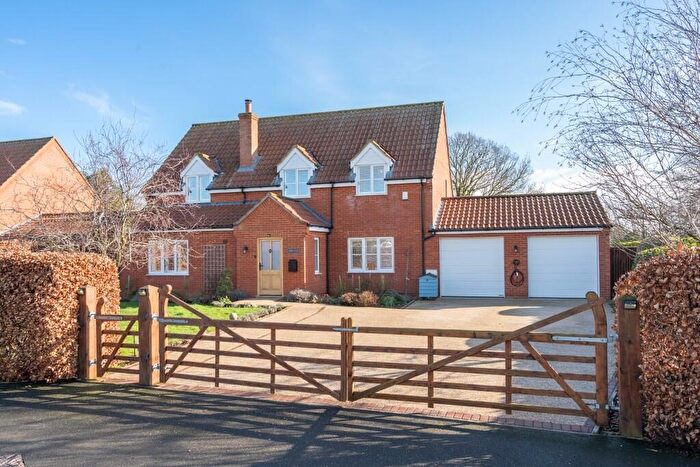
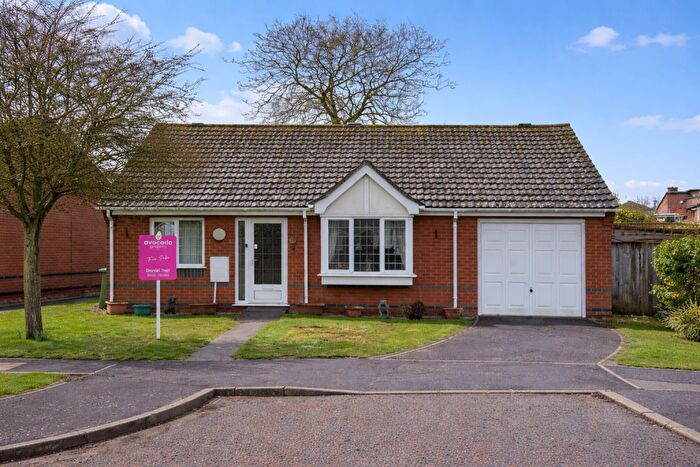
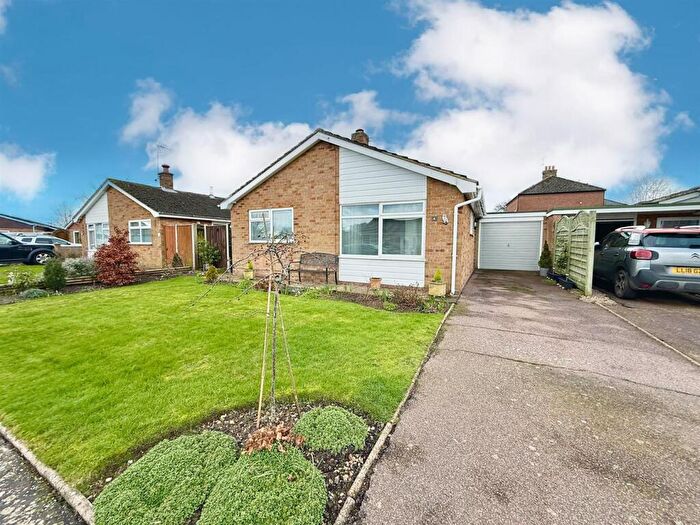
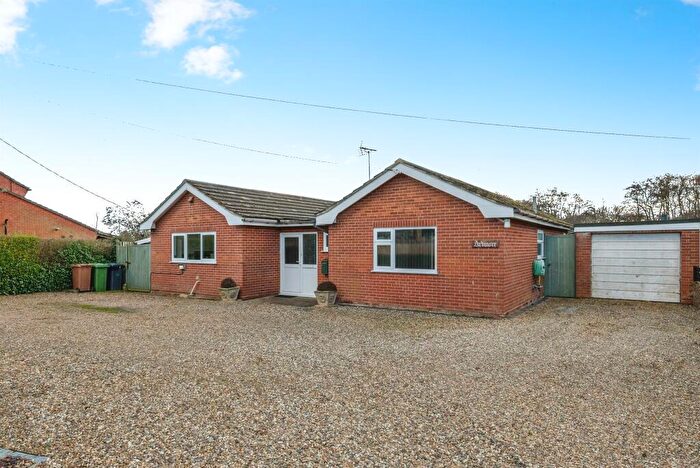
Houses for sale & to rent in Waxham, Norwich
House Prices in Waxham
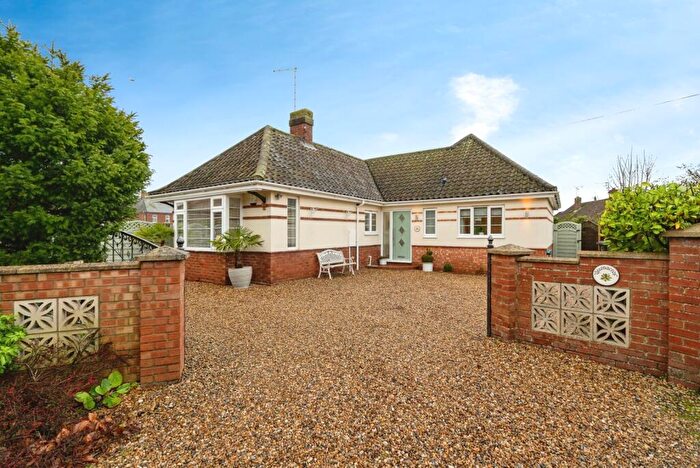
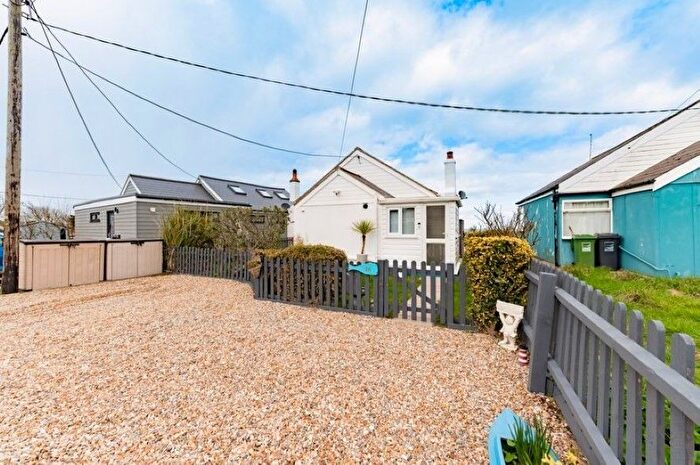
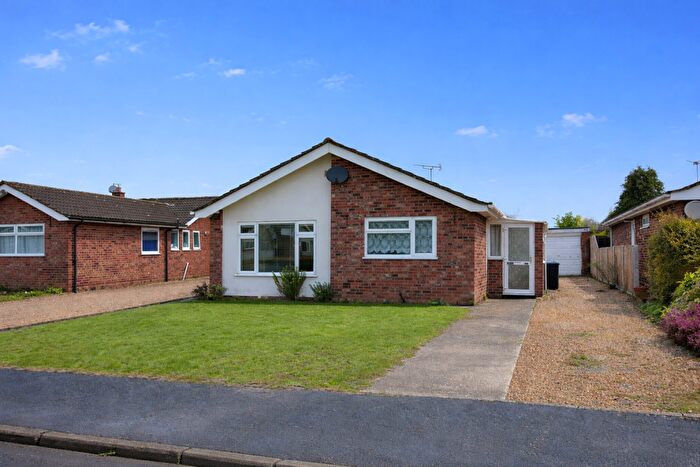
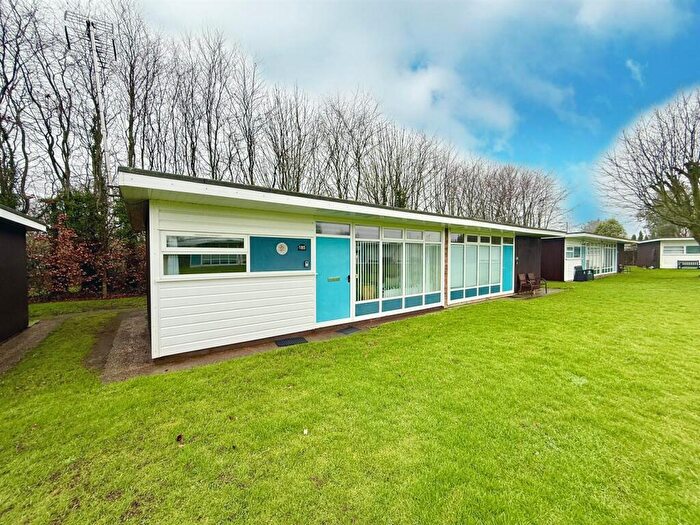
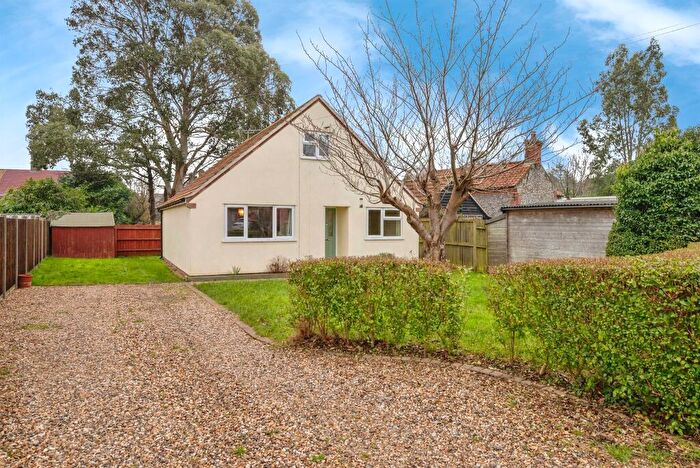
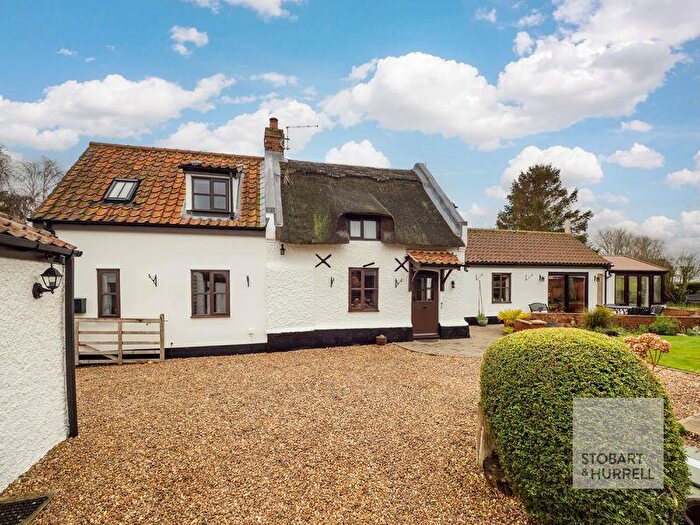
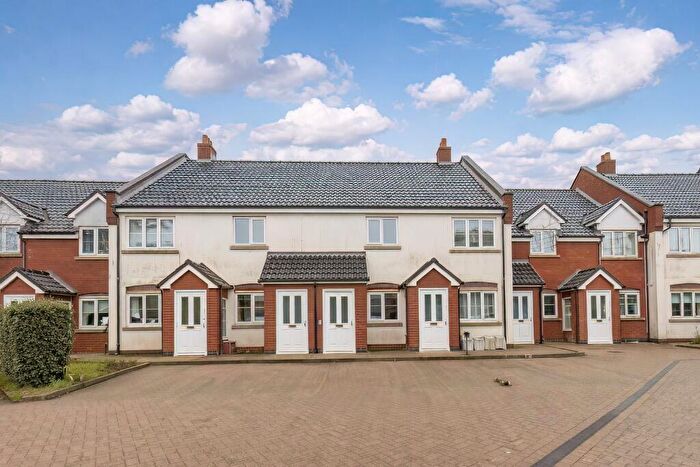
Properties in Waxham have an average house price of £308,122.00 and had 103 Property Transactions within the last 3 years¹.
Waxham is an area in Norwich, Norfolk with 821 households², where the most expensive property was sold for £850,000.00.
Properties for sale in Waxham
Roads and Postcodes in Waxham
Navigate through our locations to find the location of your next house in Waxham, Norwich for sale or to rent.
| Streets | Postcodes |
|---|---|
| Abbotts Way | NR12 0TA |
| Back Road | NR12 9JZ |
| Beach Road | NR12 0AL NR12 0SL NR12 0UE |
| Brick Kiln Lane | NR12 9SX |
| Brumstead Road | NR12 9SN |
| Bush Drive | NR12 0SF |
| Calthorpe Street | NR12 9TF NR12 9TG |
| Chapel Lane | NR12 0TD |
| Chapel Road | NR12 0UQ NR12 9AA NR12 9JR |
| Chequers Street | NR12 9JT |
| Church Close | NR12 0UR |
| Church Farm Road | NR12 9HJ |
| Church Lane | NR12 0DR NR12 0SY |
| Church Road | NR12 0TZ NR12 0UB NR12 9HL |
| Coastguard Cottages | NR12 0UH |
| Common Road | NR12 0DQ |
| Cross Lane | NR12 0TB |
| Crowden Road | NR12 0SJ |
| Dyballs Common | NR12 9JA |
| East Ruston Road | NR12 0DW |
| Farmside Cottages | NR12 0UL |
| Flower Cottages | NR12 0UJ |
| Fox Hill | NR12 9HY NR12 9HZ |
| Grange Bungalows | NR12 9HB |
| Grove Road | NR12 9SS NR12 9ST NR12 9SU |
| Grub Street | NR12 0RX |
| Happisburgh Road | NR12 0RU |
| Heath Road | NR12 0SH NR12 0ST |
| Hedgehog Walk | NR12 0SZ |
| Hickling Lane | NR12 0DT |
| High Hill | NR12 9JS |
| Honing Road | NR12 9JW |
| Ingham Corner | NR12 0TG |
| Ingham Road | NR12 0TE |
| Long Common | NR12 9HH NR12 9HQ |
| Long Lane | NR12 0TH |
| Long Lane Corner | NR12 0TJ |
| Low Road | NR12 0DH |
| Martin Road | NR12 0SE |
| Mill Road | NR12 9HR NR12 9HS NR12 9HU NR12 9TB NR12 9TD |
| North Gap | NR12 0SN |
| North View | NR12 0TN |
| Oak Lane | NR12 9JG |
| Old Rectory Road | NR12 9EU NR12 9EX |
| School Road | NR12 0DJ NR12 9JD NR12 9JQ |
| Sea Palling Road | NR12 0TR NR12 0TS NR12 0TW |
| St Margarets Place | NR12 0UU |
| Stalham Road | NR12 0TT NR12 0TX NR12 0TY |
| Star Hill | NR12 0DL |
| Sunset Walk | NR12 0SX |
| Sydney Street | NR12 9TQ |
| The Furze | NR12 9JH |
| The Holmes | NR12 9JU |
| The Loke | NR12 0TF |
| The Marrams | NR12 0UN |
| The Street | NR12 0DE NR12 0DF NR12 0DG NR12 0UD |
| Thomas Bishop Close | NR12 0UT |
| Town Road | NR12 9TA |
| Walcott Green | NR12 0NT |
| Water Lane | NR12 0XA NR12 0XB |
| Waxham Road | NR12 0DX NR12 0ED NR12 0UP NR12 0UX |
| West End Terrace | NR12 0TU |
| Willow Court | NR12 0US |
| Youngmans Lane | NR12 9JN |
| NR12 0BE NR12 0EA NR12 0RB NR12 0SW NR12 9JP |
Transport near Waxham
- FAQ
- Price Paid By Year
- Property Type Price
Frequently asked questions about Waxham
What is the average price for a property for sale in Waxham?
The average price for a property for sale in Waxham is £308,122. This amount is 0.08% higher than the average price in Norwich. There are 1,461 property listings for sale in Waxham.
What streets have the most expensive properties for sale in Waxham?
The streets with the most expensive properties for sale in Waxham are Stalham Road at an average of £850,000, Mill Road at an average of £635,000 and Calthorpe Street at an average of £560,000.
What streets have the most affordable properties for sale in Waxham?
The streets with the most affordable properties for sale in Waxham are Church Lane at an average of £146,000, Abbotts Way at an average of £146,087 and Martin Road at an average of £160,000.
Which train stations are available in or near Waxham?
Some of the train stations available in or near Waxham are Worstead, North Walsham and Hoveton and Wroxham.
Property Price Paid in Waxham by Year
The average sold property price by year was:
| Year | Average Sold Price | Price Change |
Sold Properties
|
|---|---|---|---|
| 2025 | £353,432 | 16% |
38 Properties |
| 2024 | £297,401 | 12% |
36 Properties |
| 2023 | £262,058 | -13% |
29 Properties |
| 2022 | £295,520 | 7% |
34 Properties |
| 2021 | £273,508 | -4% |
60 Properties |
| 2020 | £284,377 | 10% |
37 Properties |
| 2019 | £255,018 | 11% |
24 Properties |
| 2018 | £226,015 | -4% |
33 Properties |
| 2017 | £234,515 | 1% |
36 Properties |
| 2016 | £231,555 | 2% |
39 Properties |
| 2015 | £227,870 | 23% |
50 Properties |
| 2014 | £174,580 | 9% |
47 Properties |
| 2013 | £158,275 | 2% |
37 Properties |
| 2012 | £154,393 | -2% |
24 Properties |
| 2011 | £157,766 | -6% |
45 Properties |
| 2010 | £167,604 | -12% |
31 Properties |
| 2009 | £188,235 | -8% |
28 Properties |
| 2008 | £203,704 | 11% |
23 Properties |
| 2007 | £181,706 | 3% |
50 Properties |
| 2006 | £176,485 | 17% |
58 Properties |
| 2005 | £146,189 | 9% |
43 Properties |
| 2004 | £133,431 | -4% |
43 Properties |
| 2003 | £138,331 | 24% |
59 Properties |
| 2002 | £105,599 | 12% |
74 Properties |
| 2001 | £92,423 | 24% |
56 Properties |
| 2000 | £70,673 | 5% |
56 Properties |
| 1999 | £66,949 | 22% |
55 Properties |
| 1998 | £52,055 | -2% |
39 Properties |
| 1997 | £53,124 | 2% |
58 Properties |
| 1996 | £52,282 | 12% |
45 Properties |
| 1995 | £46,110 | - |
29 Properties |
Property Price per Property Type in Waxham
Here you can find historic sold price data in order to help with your property search.
The average Property Paid Price for specific property types in the last three years are:
| Property Type | Average Sold Price | Sold Properties |
|---|---|---|
| Semi Detached House | £258,417.00 | 23 Semi Detached Houses |
| Detached House | £344,816.00 | 67 Detached Houses |
| Terraced House | £206,946.00 | 13 Terraced Houses |

