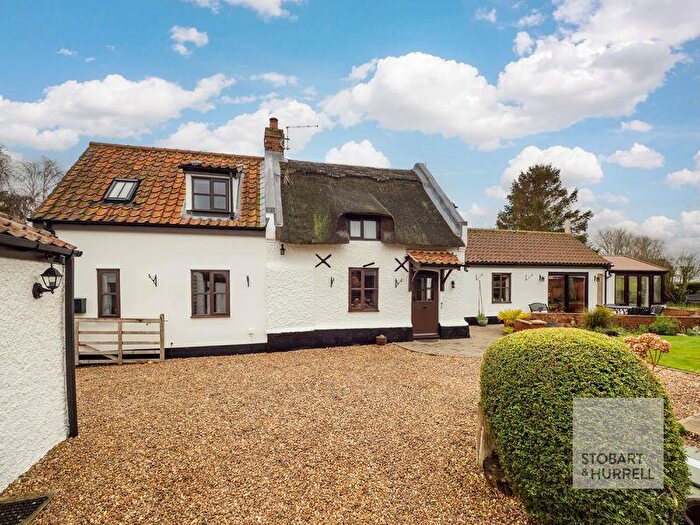
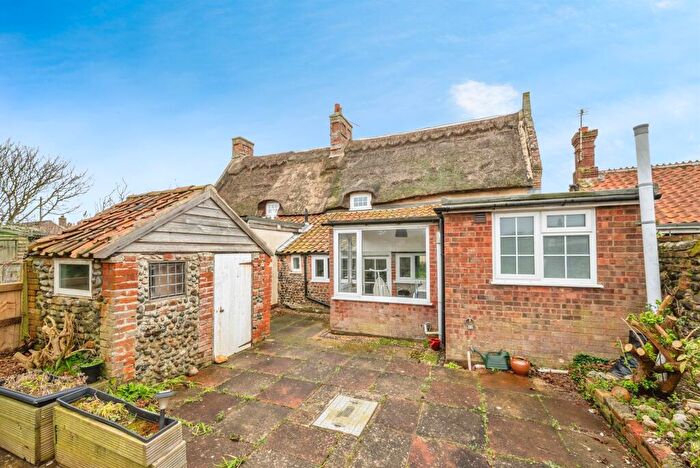
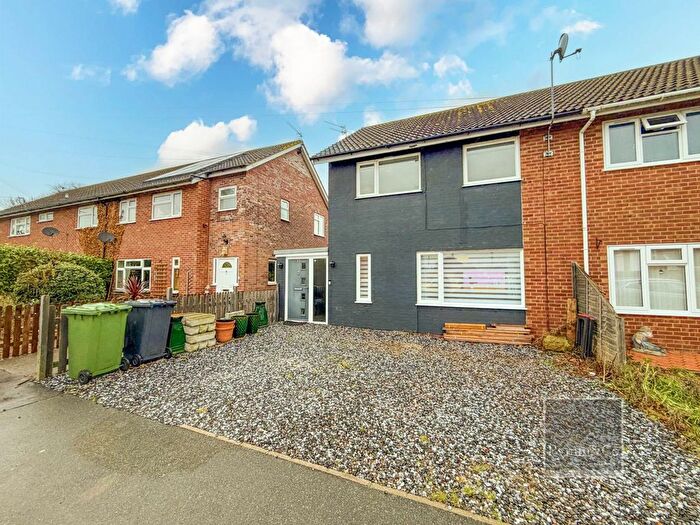
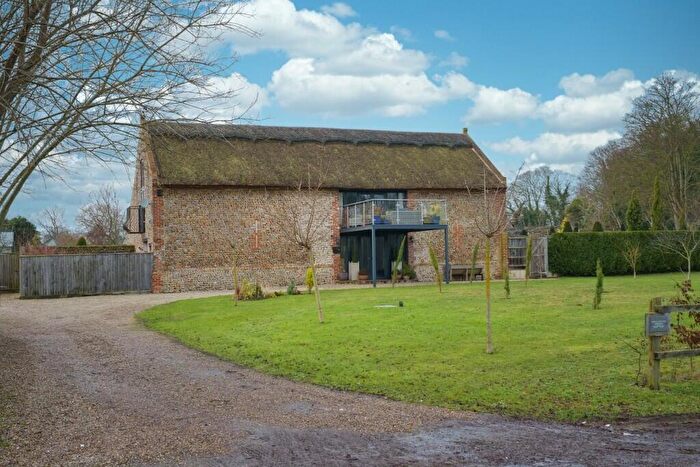
Houses for sale & to rent in Happisburgh, Norwich
House Prices in Happisburgh
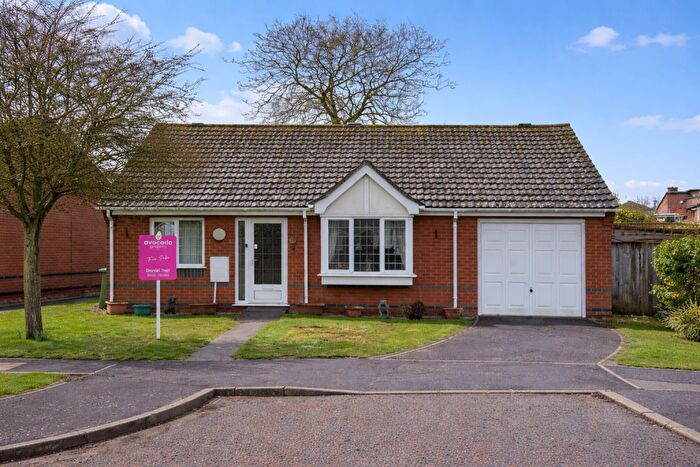
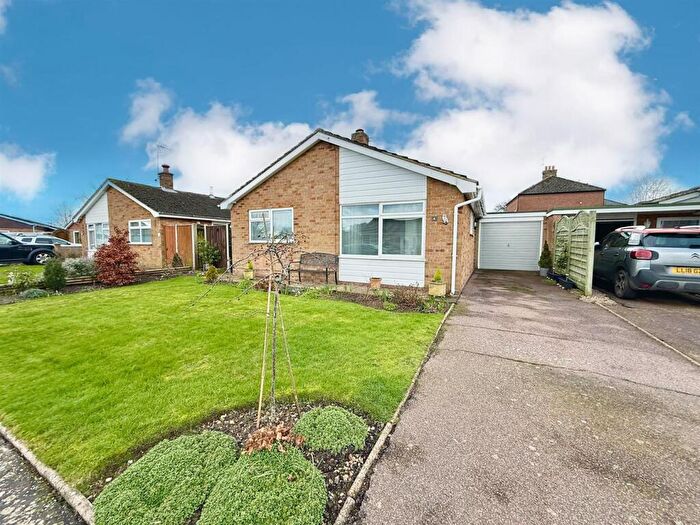
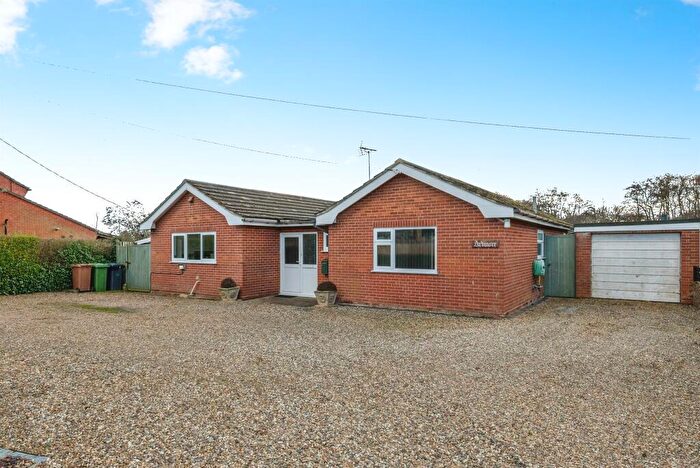
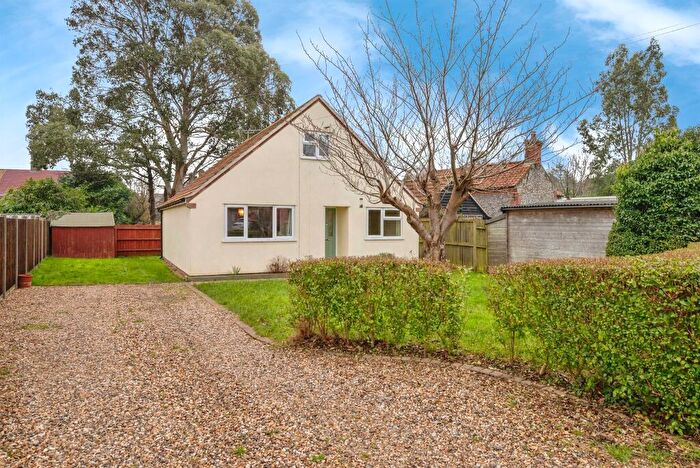
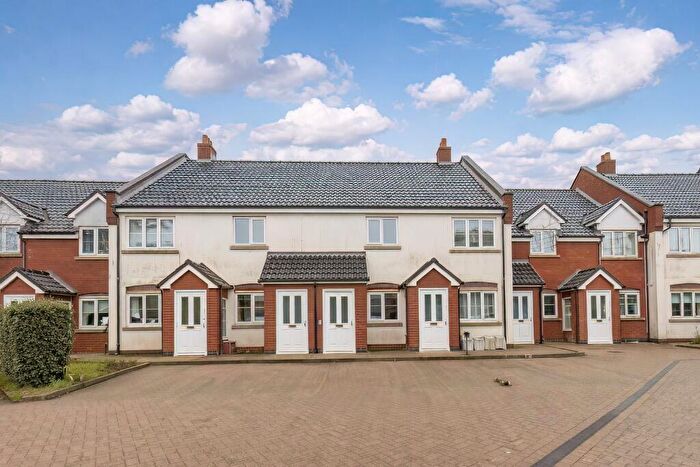
Properties in Happisburgh have an average house price of £286,321.00 and had 75 Property Transactions within the last 3 years¹.
Happisburgh is an area in Norwich, Norfolk with 714 households², where the most expensive property was sold for £965,000.00.
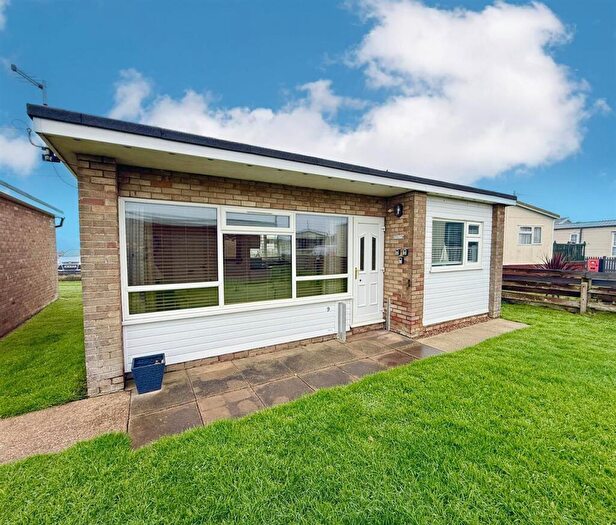
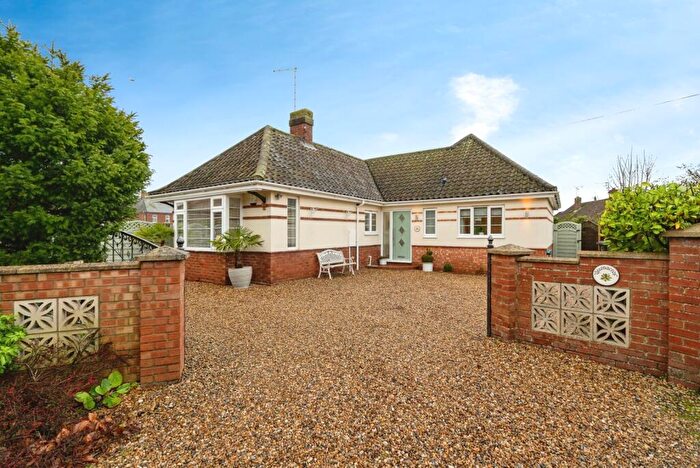
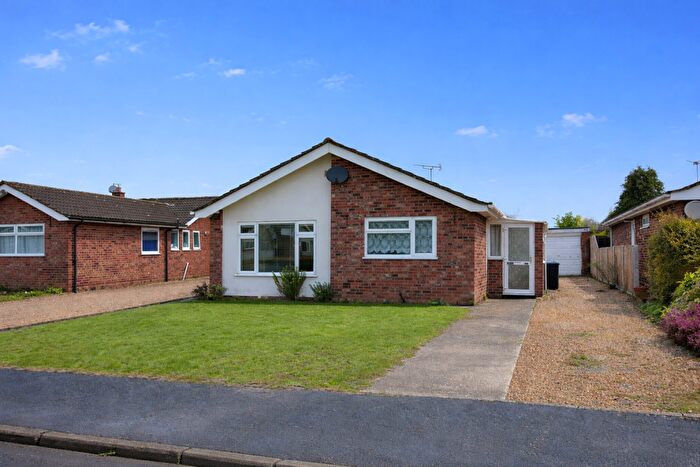
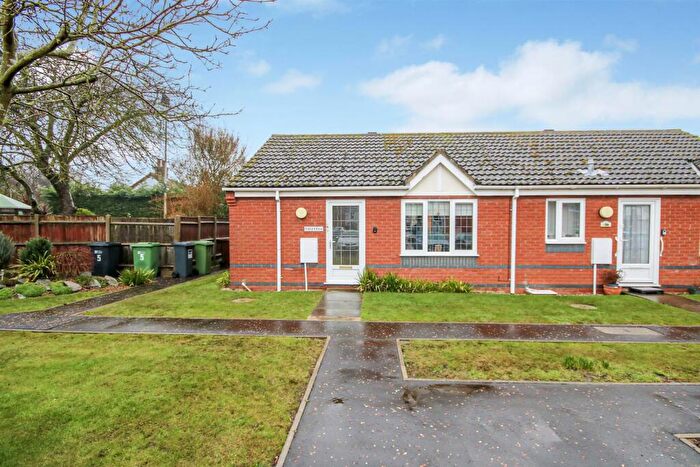
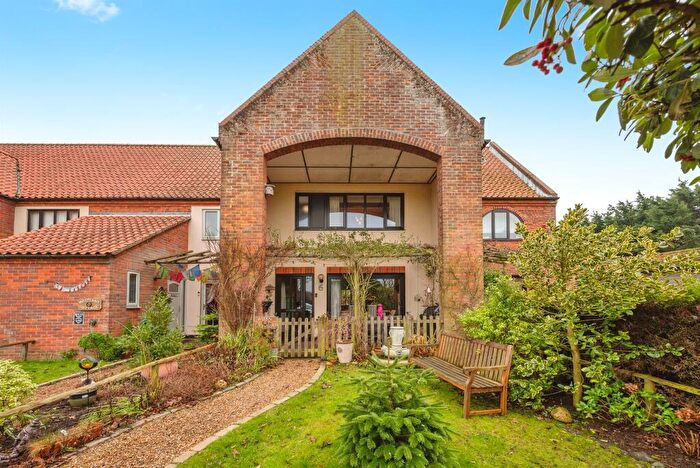
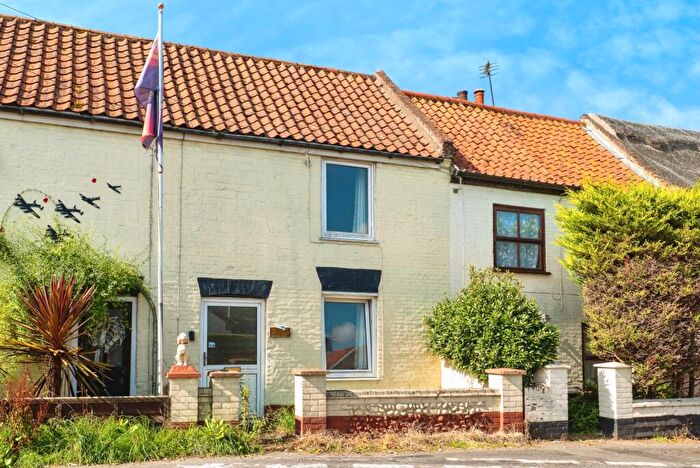
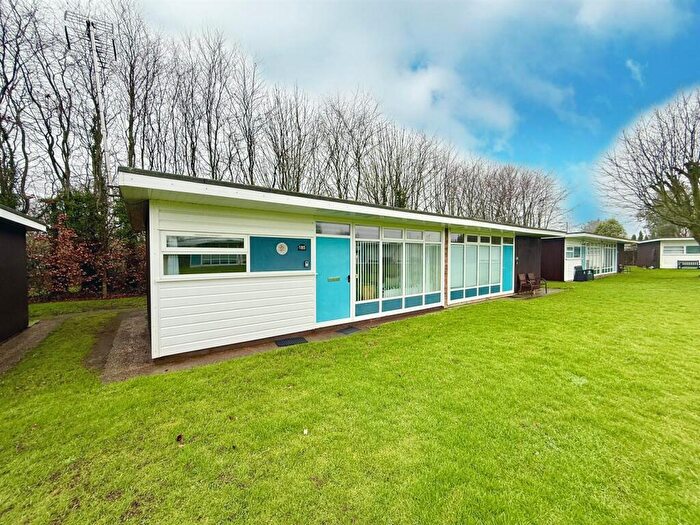
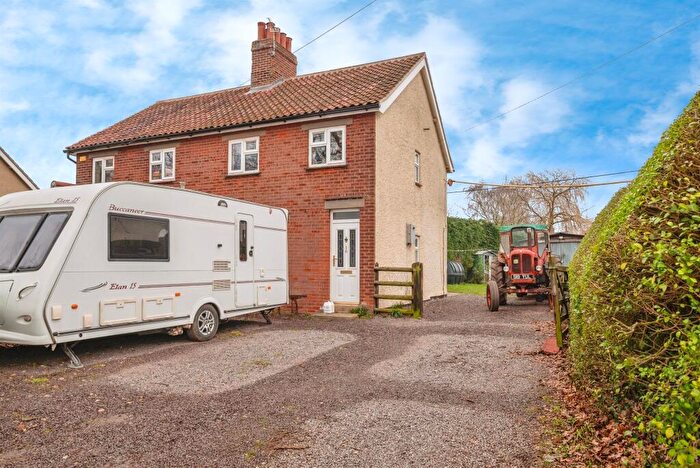
Properties for sale in Happisburgh
Roads and Postcodes in Happisburgh
Navigate through our locations to find the location of your next house in Happisburgh, Norwich for sale or to rent.
| Streets | Postcodes |
|---|---|
| A149 | NR12 9FD |
| Archibald Road | NR12 0NF |
| Back Lane | NR12 9FH |
| Barton Lane | NR12 0QR |
| Beach Road | NR12 0PP NR12 0PR |
| Beaucourt Place | NR12 0PH |
| Blacksmiths Lane | NR12 0QT |
| Bush Estate | NR12 0QN |
| Calthorpe Street | NR12 9TE |
| Cart Gap Road | NR12 0QL |
| Chequers Street | NR12 9JX |
| Church Road | NR12 9FX |
| Coast Road | NR12 0AP NR12 0ND NR12 0NG NR12 0SG |
| Coastline Village | NR12 0NE |
| Coronation Close | NR12 0RL |
| Coronation Road | NR12 0SA |
| Drabbs Lane | NR12 9FB |
| East Ruston Road | NR12 0RZ |
| Fox Hill | NR12 9HX |
| Foxhill Road | NR12 9JB |
| Grove Road | NR12 9SR |
| Grub Street | NR12 0QZ NR12 0RQ |
| Happisburgh Road | NR12 0PD |
| Heath Road | NR12 0SU |
| Helena Road | NR12 0LX |
| Horizon Views | NR12 0NY |
| Ingham Road | NR12 0AH NR12 0DA NR12 0DB NR12 9HD NR12 9HE NR12 9SP |
| Larkeys Lane | NR12 9HT |
| Lessingham Road | NR12 0QQ |
| Lighthouse Close | NR12 0QE |
| Lighthouse Lane | NR12 0PY NR12 0QA |
| Littlewood Bungalows | NR12 0RA |
| Long Common | NR12 9LA |
| Long Lane | NR12 0TQ |
| Long Lane Corner | NR12 0TL |
| Lower Street | NR12 0RS NR12 0RY |
| Lynton Road | NR12 0NA |
| Milligen Meadows | NR12 9JF |
| North Walsham Road | NR12 0QS NR12 0QU NR12 0AN NR12 0QX |
| Old Barn Road | NR12 9HA |
| Ostend Gap | NR12 0NN |
| Ostend Place | NR12 0NJ |
| Ostend Road | NR12 0NP NR12 0NW NR12 0PG |
| Poplar Drive | NR12 0LZ |
| Rollesby Way | NR12 0QJ |
| Sand Hills | NR12 0SP NR12 0SR |
| Sandhills | NR12 0SS |
| School Common Road | NR12 0QF |
| Sea Palling Road | NR12 0TP |
| Seaview Crescent | NR12 0NL |
| Short Lane | NR12 0RH NR12 0RJ NR12 0RR |
| Spindrift | NR12 0NZ |
| St Helens Road | NR12 0LU |
| St Marys View | NR12 0QW |
| Stalham Road | NR12 0RG NR12 9ER NR12 9EY NR12 9EZ NR12 9HP NR12 9HW |
| Sydney Street | NR12 9TH |
| The Common | NR12 0RP NR12 0RT NR12 0RW NR12 9ET |
| The Crescent | NR12 0NH |
| The Hill | NR12 0PW |
| The Paddock | NR12 0PU NR12 0QB |
| The Street | NR12 0AB NR12 0PL |
| Walcott Green | NR12 0NX NR12 0NS |
| Whimpwell Green | NR12 0AJ |
| Whimpwell Street | NR12 0QD |
| Youngmans Lane | NR12 9JL |
| NR12 0PN NR12 0QG NR12 0QY NR12 0DN NR12 0DP NR12 9AB NR12 9ES NR12 9HG NR12 9HN NR12 9JE |
Transport near Happisburgh
- FAQ
- Price Paid By Year
- Property Type Price
Frequently asked questions about Happisburgh
What is the average price for a property for sale in Happisburgh?
The average price for a property for sale in Happisburgh is £286,321. This amount is 7% lower than the average price in Norwich. There are 1,506 property listings for sale in Happisburgh.
What streets have the most expensive properties for sale in Happisburgh?
The streets with the most expensive properties for sale in Happisburgh are Back Lane at an average of £575,000, Chequers Street at an average of £552,000 and Whimpwell Green at an average of £437,500.
What streets have the most affordable properties for sale in Happisburgh?
The streets with the most affordable properties for sale in Happisburgh are Beach Road at an average of £110,500, The Street at an average of £130,000 and St Helens Road at an average of £144,000.
Which train stations are available in or near Happisburgh?
Some of the train stations available in or near Happisburgh are Worstead, North Walsham and Hoveton and Wroxham.
Property Price Paid in Happisburgh by Year
The average sold property price by year was:
| Year | Average Sold Price | Price Change |
Sold Properties
|
|---|---|---|---|
| 2025 | £288,950 | 12% |
20 Properties |
| 2024 | £255,111 | -23% |
27 Properties |
| 2023 | £314,539 | -1% |
28 Properties |
| 2022 | £317,788 | 15% |
31 Properties |
| 2021 | £269,563 | 11% |
43 Properties |
| 2020 | £240,512 | 23% |
39 Properties |
| 2019 | £185,043 | -6% |
32 Properties |
| 2018 | £195,451 | -0,5% |
30 Properties |
| 2017 | £196,373 | -9% |
40 Properties |
| 2016 | £213,417 | 22% |
42 Properties |
| 2015 | £167,116 | 1% |
42 Properties |
| 2014 | £165,140 | 23% |
31 Properties |
| 2013 | £127,342 | -10% |
33 Properties |
| 2012 | £139,950 | 11% |
22 Properties |
| 2011 | £124,865 | -32% |
41 Properties |
| 2010 | £164,632 | 6% |
28 Properties |
| 2009 | £154,441 | 0,5% |
19 Properties |
| 2008 | £153,687 | -6% |
16 Properties |
| 2007 | £162,730 | 15% |
38 Properties |
| 2006 | £139,100 | 3% |
51 Properties |
| 2005 | £134,667 | -2% |
26 Properties |
| 2004 | £136,955 | 8% |
37 Properties |
| 2003 | £125,742 | 20% |
46 Properties |
| 2002 | £100,557 | 20% |
52 Properties |
| 2001 | £80,582 | 14% |
57 Properties |
| 2000 | £69,485 | 22% |
43 Properties |
| 1999 | £54,284 | -10% |
38 Properties |
| 1998 | £59,857 | 21% |
56 Properties |
| 1997 | £47,128 | 11% |
45 Properties |
| 1996 | £42,095 | -23% |
36 Properties |
| 1995 | £51,826 | - |
28 Properties |
Property Price per Property Type in Happisburgh
Here you can find historic sold price data in order to help with your property search.
The average Property Paid Price for specific property types in the last three years are:
| Property Type | Average Sold Price | Sold Properties |
|---|---|---|
| Semi Detached House | £204,302.00 | 21 Semi Detached Houses |
| Detached House | £341,208.00 | 48 Detached Houses |
| Terraced House | £134,291.00 | 6 Terraced Houses |

