Houses for sale & to rent in Wissey, Thetford
House Prices in Wissey
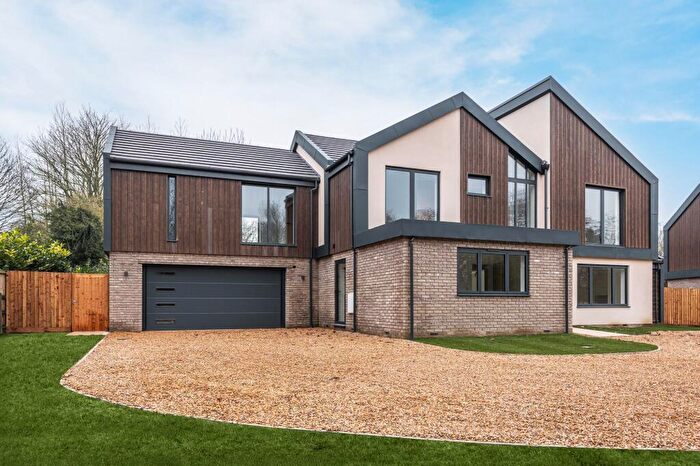
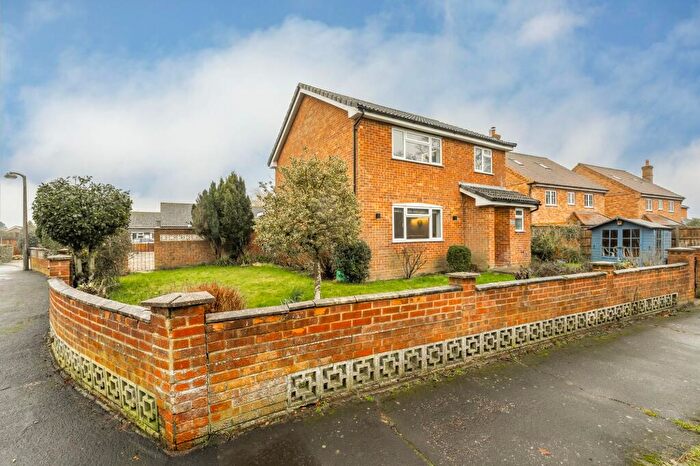
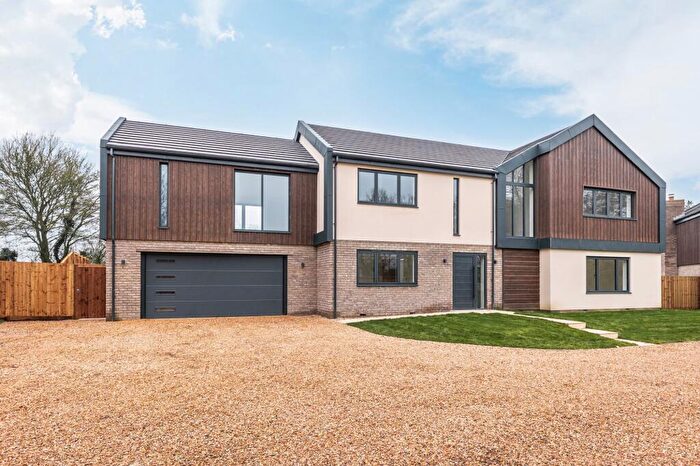
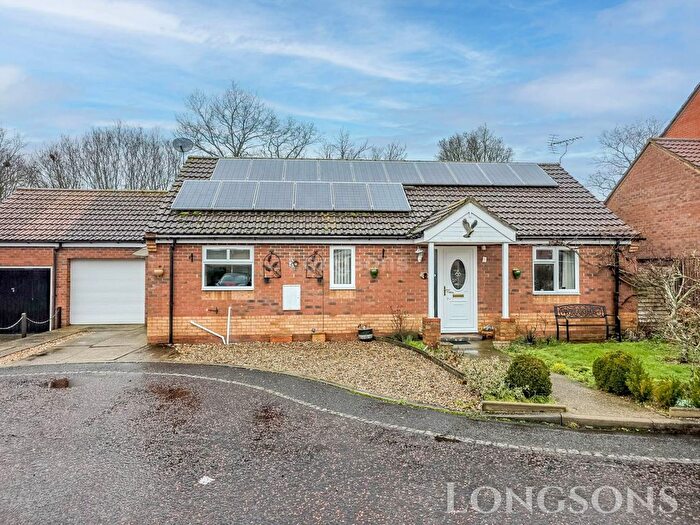
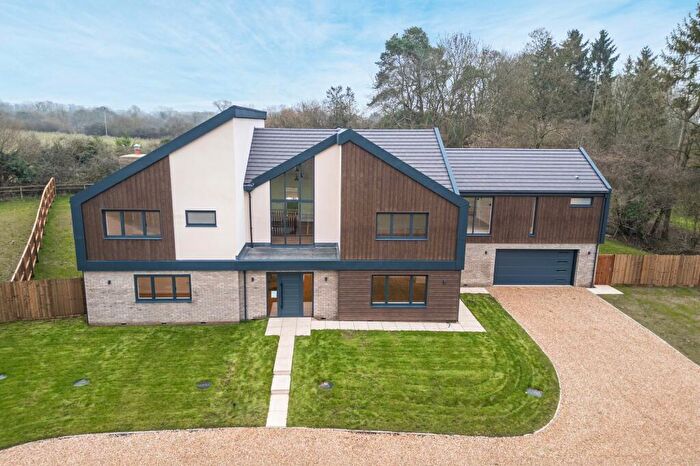
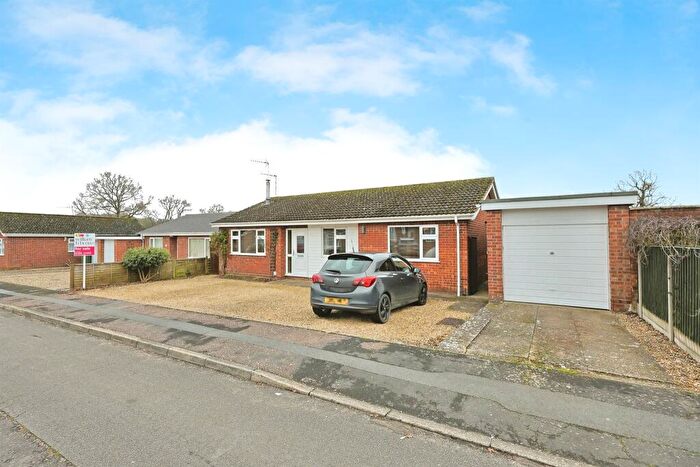
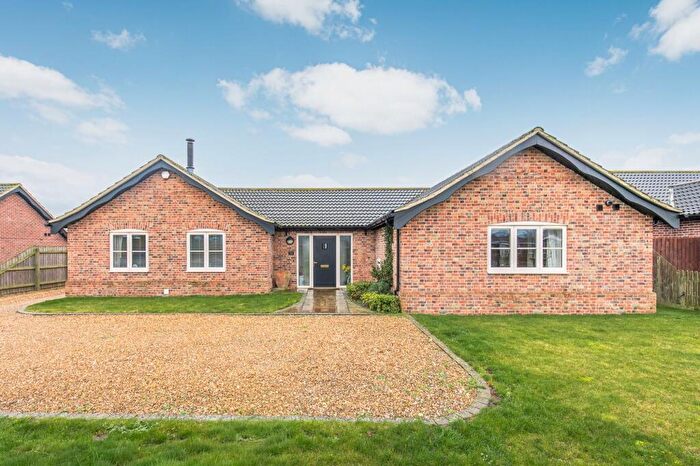
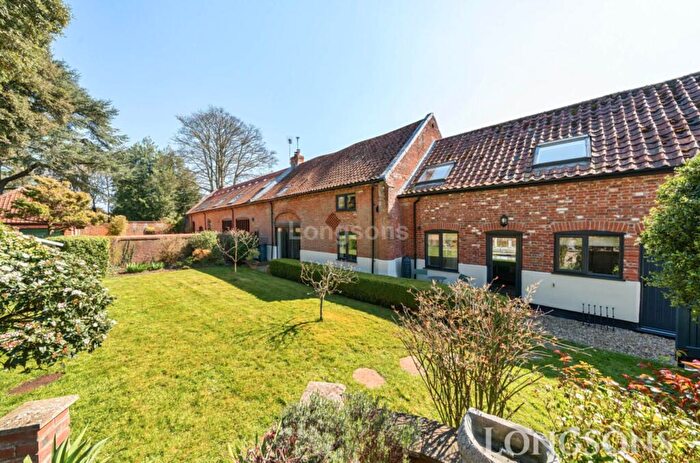
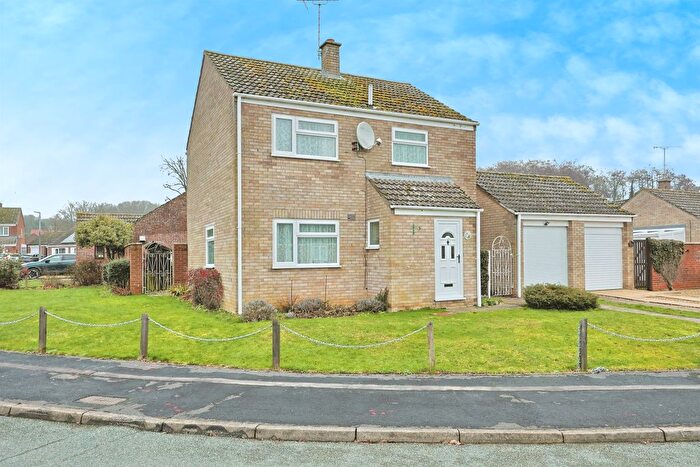
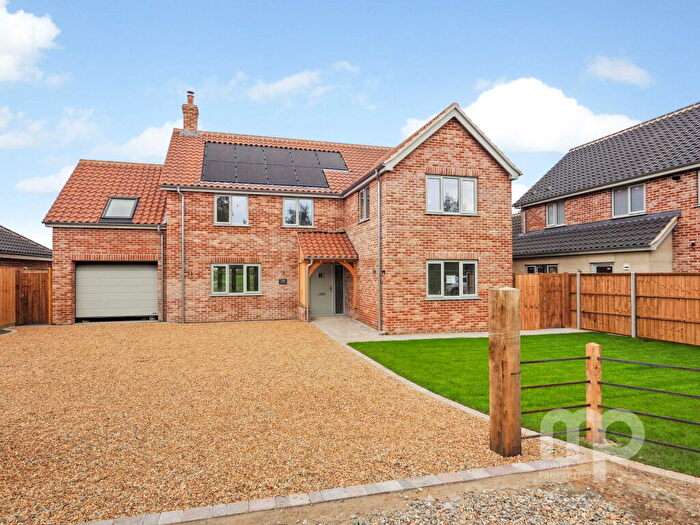
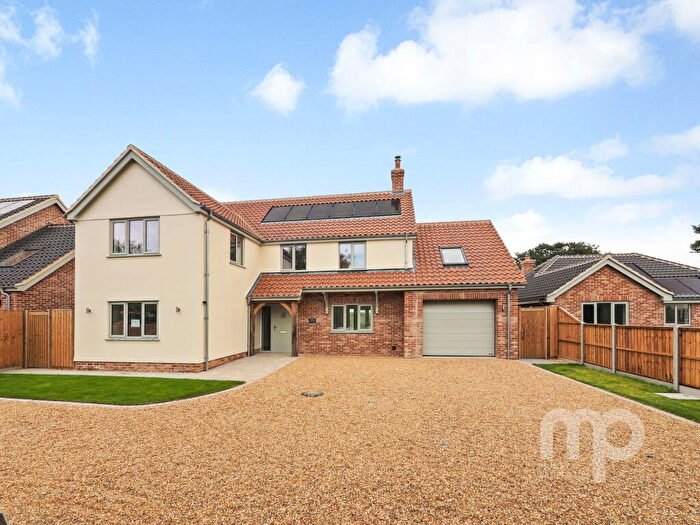
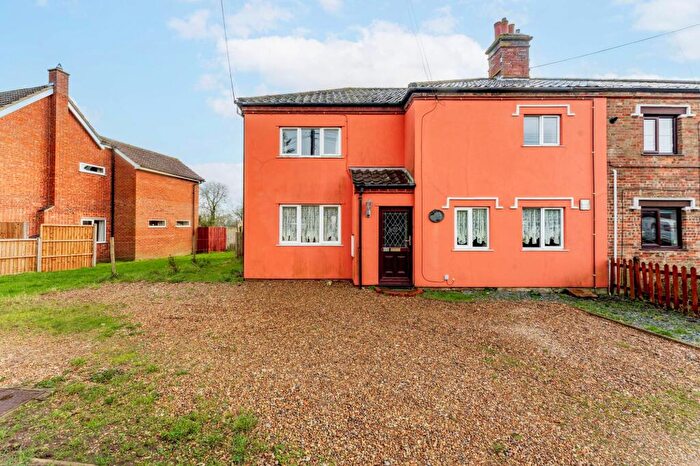
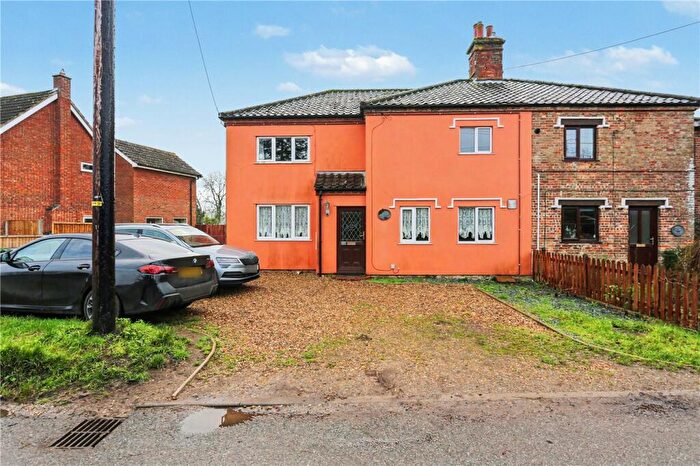
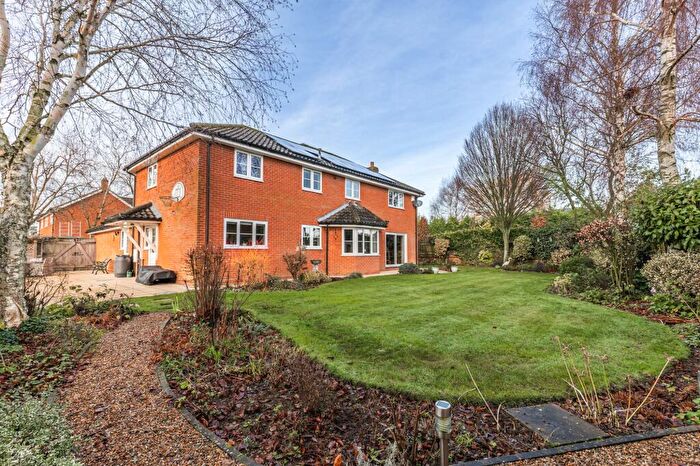
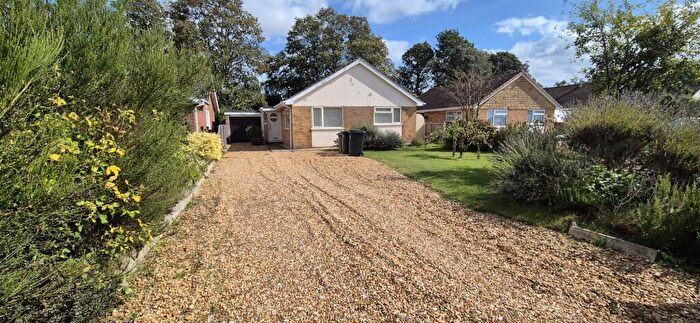
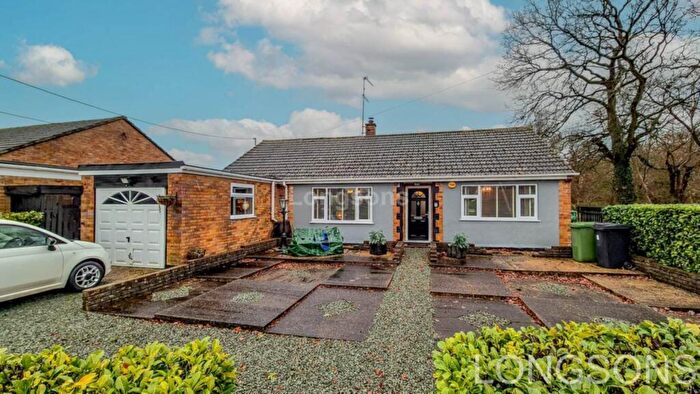
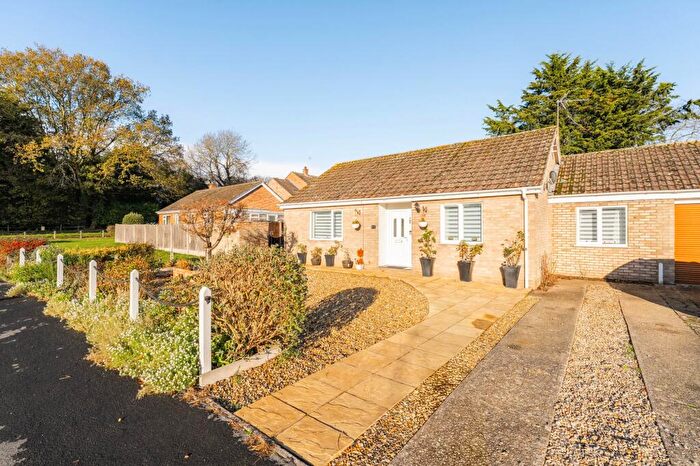
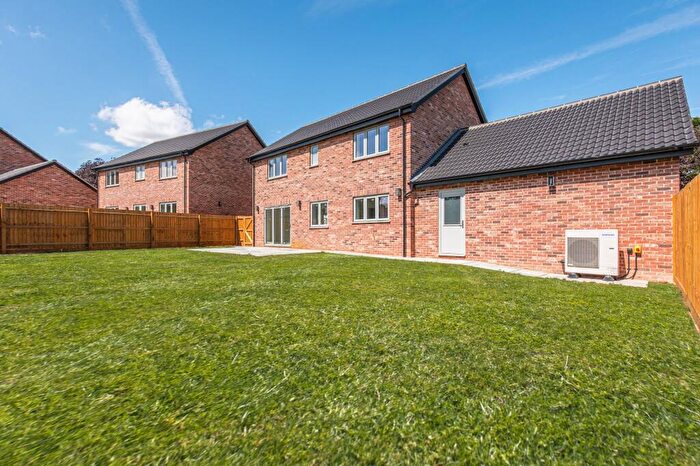
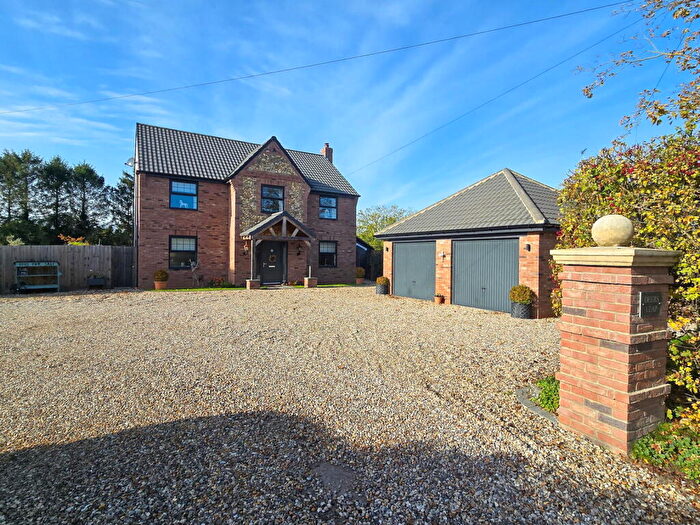
Properties in Wissey have an average house price of £334,475.00 and had 74 Property Transactions within the last 3 years¹.
Wissey is an area in Thetford, Norfolk with 823 households², where the most expensive property was sold for £2,200,000.00.
Properties for sale in Wissey
Roads and Postcodes in Wissey
Navigate through our locations to find the location of your next house in Wissey, Thetford for sale or to rent.
| Streets | Postcodes |
|---|---|
| Acacia Avenue | IP25 7AR |
| Bury Hall Cottages | IP25 7BP |
| Church Lane | IP25 7DS |
| Church Road | IP25 7DR |
| Church Street | IP25 7AW |
| Cliffords Yard | IP25 7DQ |
| Common Road | IP25 7BA |
| Cook Road | IP25 7DJ |
| Cressingham Road | IP25 7BY IP25 7DG |
| Dunnetts Close | IP25 7AY |
| Edward Close | IP25 7BF |
| Fairholme Close | IP25 7BJ |
| Fir Park | IP25 7DE |
| Follet Close | IP25 7EE |
| Goose Green | IP25 7AS |
| Granary Fields | IP25 7BN |
| Greenacre Close | IP25 7AZ |
| Hale Road | IP25 7AU IP25 7AX IP25 7BG IP25 7BL |
| Lewis Close | IP25 7BH |
| Low Common | IP25 7AG |
| Lower Road | IP25 7EB |
| Millfield | IP25 7BQ |
| Necton Road | IP25 7EA |
| Orchard Close | IP25 7DA |
| Red Lion Close | IP25 7DL |
| School Road | IP25 7DN IP25 7DP IP25 7DW |
| St Andrews Close | IP25 7EH |
| Station Road | IP25 7DY IP25 7DZ |
| Swaffham Road | IP25 7BT IP25 7DB IP25 7DX |
| The Green | IP25 7AT |
| The Limes | IP25 7DD |
| The Oaks | IP25 7AN |
| Watton Road | IP25 7AJ IP25 7AQ |
| White Houses | IP25 7DU |
| Woodlands | IP25 7AL |
Transport near Wissey
-
Attleborough Station
-
Harling Road Station
-
Eccles Road Station
-
Brandon Station
-
Thetford Station
-
Spooner Row Station
-
Wymondham Station
- FAQ
- Price Paid By Year
- Property Type Price
Frequently asked questions about Wissey
What is the average price for a property for sale in Wissey?
The average price for a property for sale in Wissey is £334,475. This amount is 28% higher than the average price in Thetford. There are 764 property listings for sale in Wissey.
What streets have the most expensive properties for sale in Wissey?
The streets with the most expensive properties for sale in Wissey are Church Street at an average of £911,666, Necton Road at an average of £581,750 and Cook Road at an average of £545,000.
What streets have the most affordable properties for sale in Wissey?
The streets with the most affordable properties for sale in Wissey are Low Common at an average of £171,000, Fairholme Close at an average of £197,500 and Acacia Avenue at an average of £235,909.
Which train stations are available in or near Wissey?
Some of the train stations available in or near Wissey are Attleborough, Harling Road and Eccles Road.
Property Price Paid in Wissey by Year
The average sold property price by year was:
| Year | Average Sold Price | Price Change |
Sold Properties
|
|---|---|---|---|
| 2025 | £283,659 | -13% |
22 Properties |
| 2024 | £319,555 | -27% |
30 Properties |
| 2023 | £405,636 | 28% |
22 Properties |
| 2022 | £292,845 | 9% |
42 Properties |
| 2021 | £267,890 | -4% |
56 Properties |
| 2020 | £279,785 | 15% |
35 Properties |
| 2019 | £237,539 | -16% |
38 Properties |
| 2018 | £274,789 | 13% |
34 Properties |
| 2017 | £239,135 | 17% |
37 Properties |
| 2016 | £198,807 | -5% |
39 Properties |
| 2015 | £209,270 | 10% |
36 Properties |
| 2014 | £188,342 | 20% |
38 Properties |
| 2013 | £150,078 | -10% |
39 Properties |
| 2012 | £164,498 | -22% |
31 Properties |
| 2011 | £201,230 | 13% |
26 Properties |
| 2010 | £175,130 | - |
23 Properties |
| 2009 | £175,095 | -27% |
34 Properties |
| 2008 | £222,305 | -4% |
18 Properties |
| 2007 | £231,971 | 13% |
47 Properties |
| 2006 | £201,200 | 23% |
42 Properties |
| 2005 | £155,269 | -10% |
33 Properties |
| 2004 | £171,421 | 6% |
37 Properties |
| 2003 | £161,324 | 23% |
64 Properties |
| 2002 | £124,120 | 16% |
41 Properties |
| 2001 | £104,870 | 17% |
44 Properties |
| 2000 | £87,432 | 26% |
32 Properties |
| 1999 | £64,787 | 6% |
48 Properties |
| 1998 | £60,785 | 12% |
37 Properties |
| 1997 | £53,624 | 9% |
43 Properties |
| 1996 | £48,965 | -26% |
37 Properties |
| 1995 | £61,464 | - |
42 Properties |
Property Price per Property Type in Wissey
Here you can find historic sold price data in order to help with your property search.
The average Property Paid Price for specific property types in the last three years are:
| Property Type | Average Sold Price | Sold Properties |
|---|---|---|
| Semi Detached House | £257,208.00 | 12 Semi Detached Houses |
| Detached House | £362,922.00 | 56 Detached Houses |
| Terraced House | £223,500.00 | 6 Terraced Houses |

