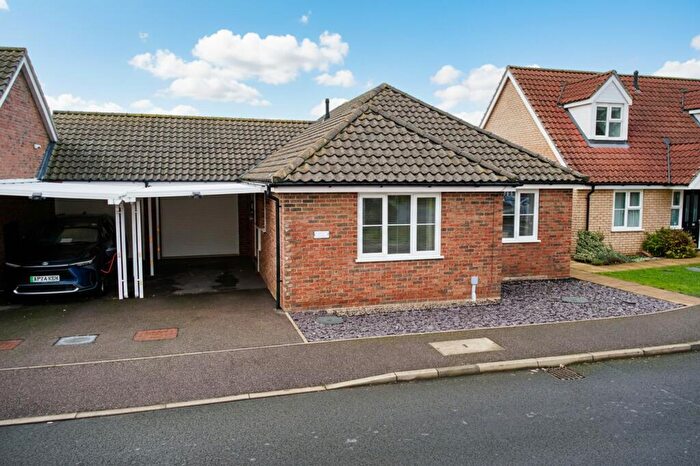
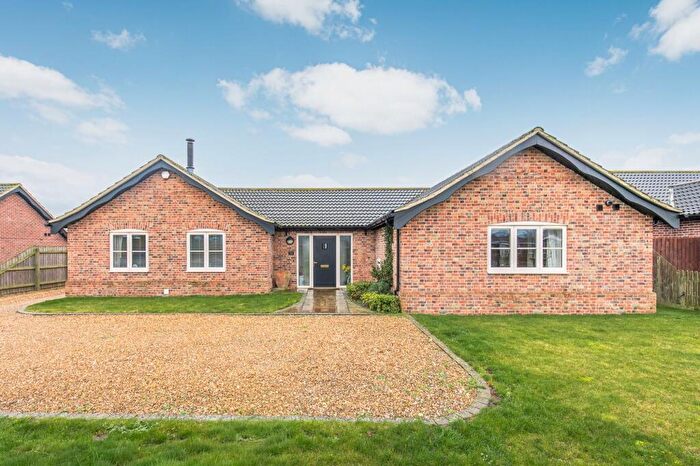
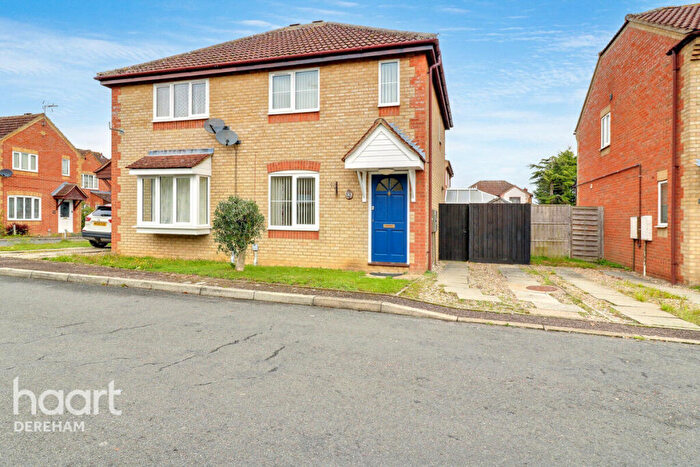
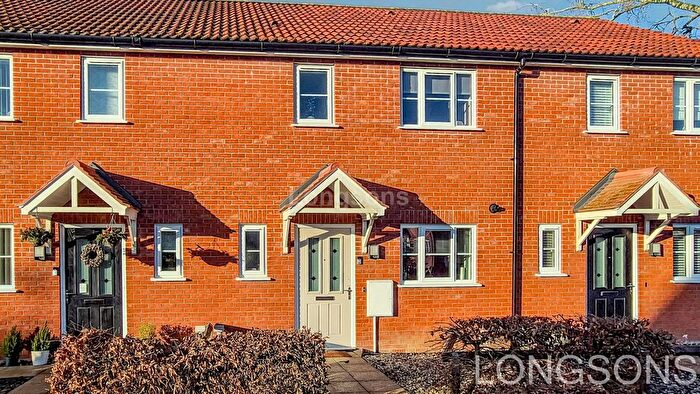
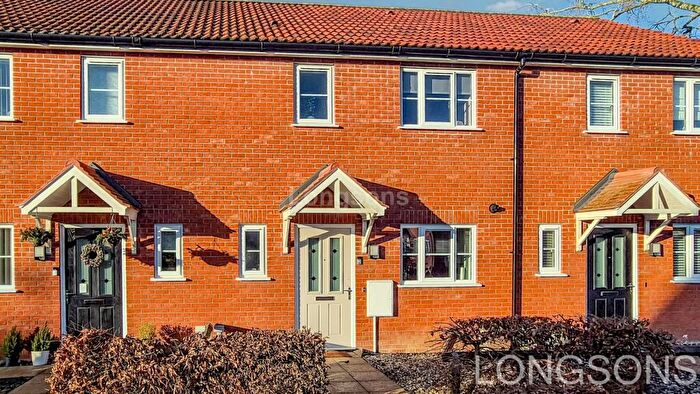
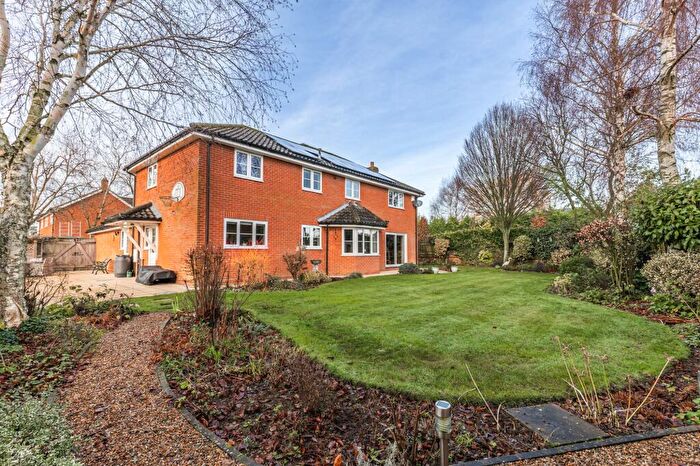
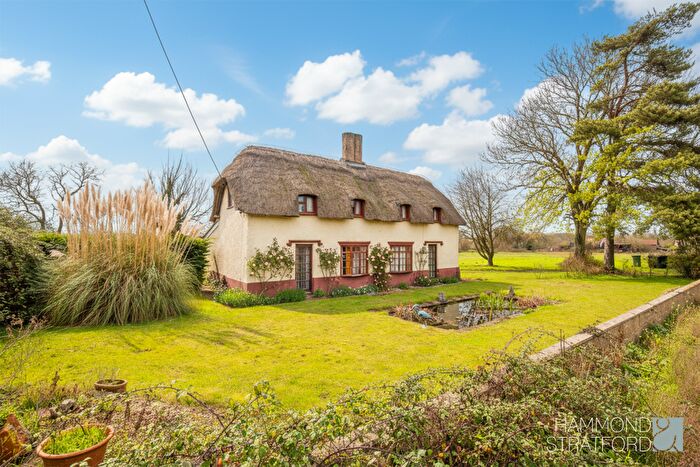
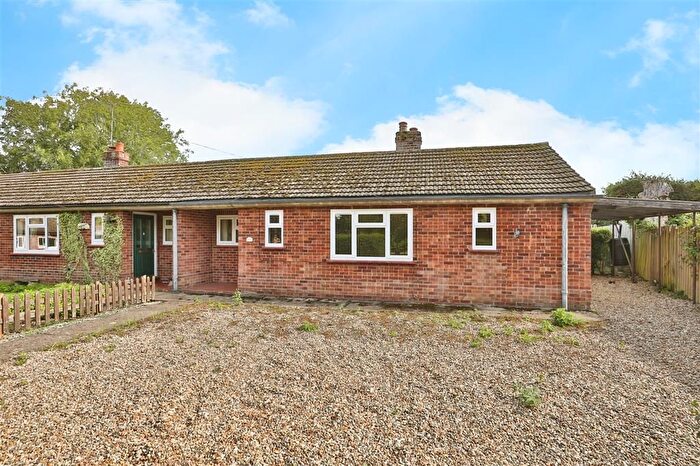
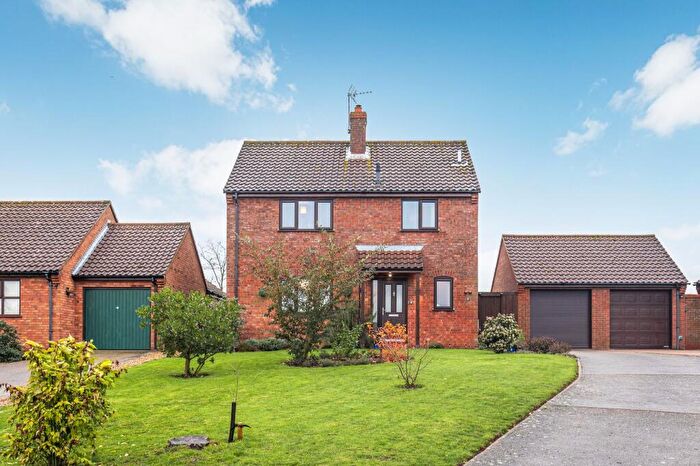
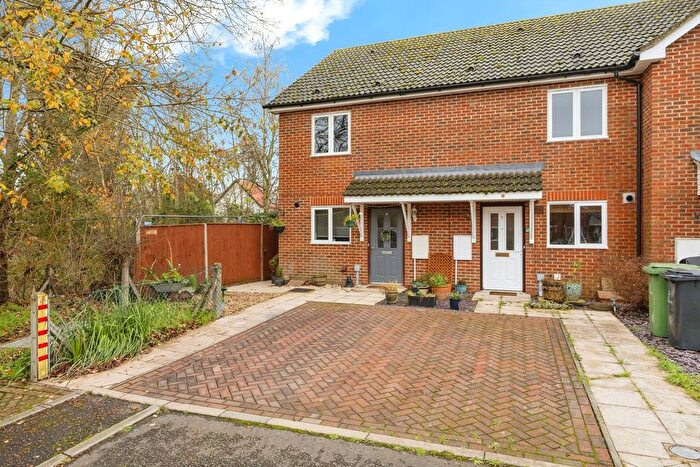
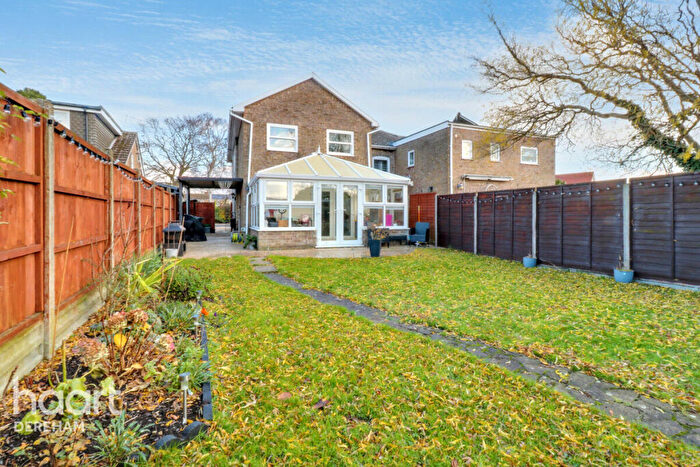
Houses for sale & to rent in Haggard De Toni, Thetford
House Prices in Haggard De Toni
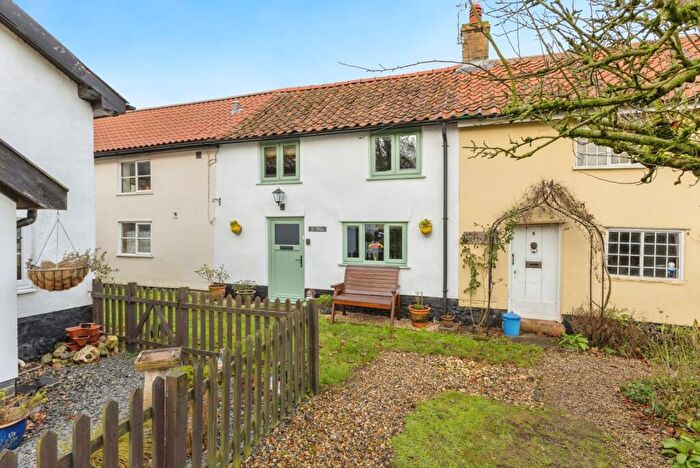
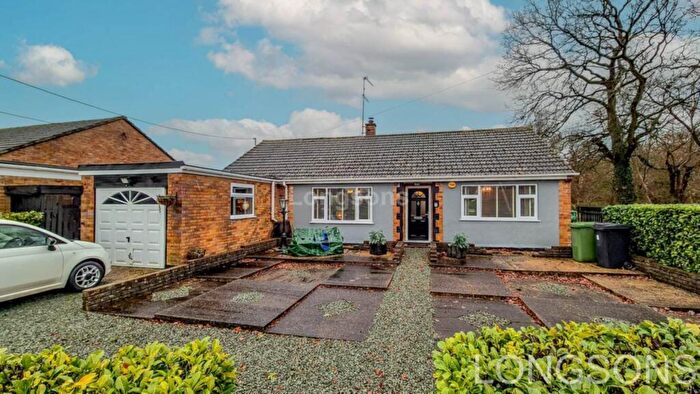
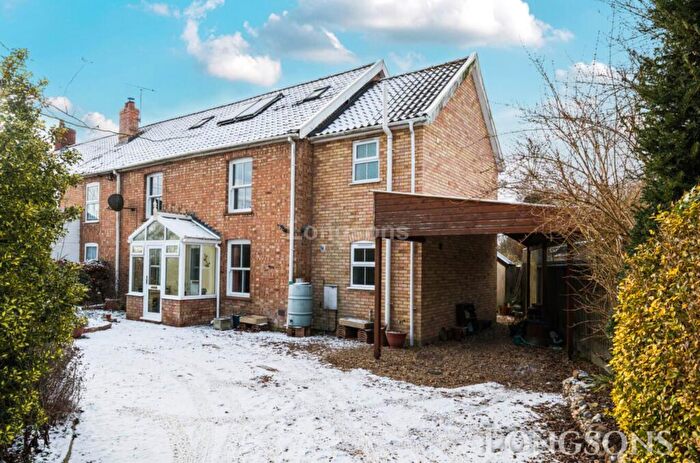
Properties in Haggard De Toni have an average house price of £360,784.00 and had 123 Property Transactions within the last 3 years¹.
Haggard De Toni is an area in Thetford, Norfolk with 900 households², where the most expensive property was sold for £2,000,000.00.
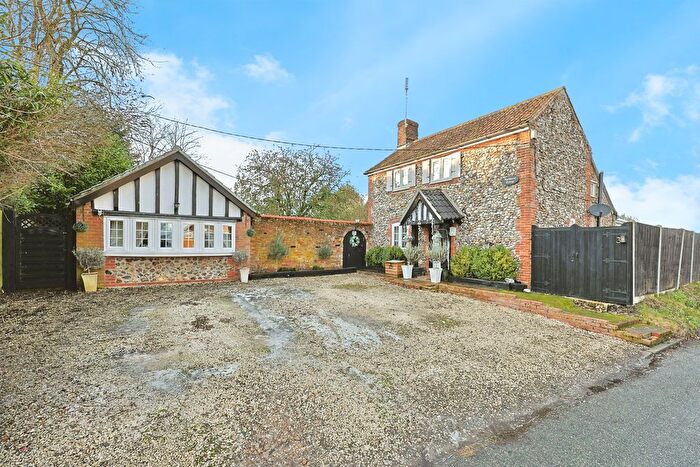
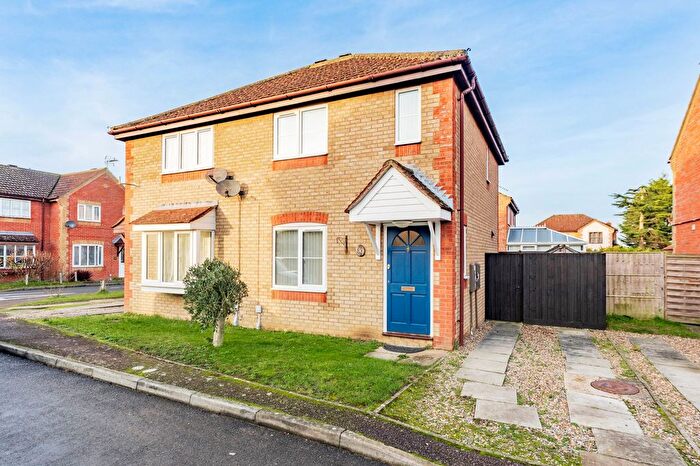
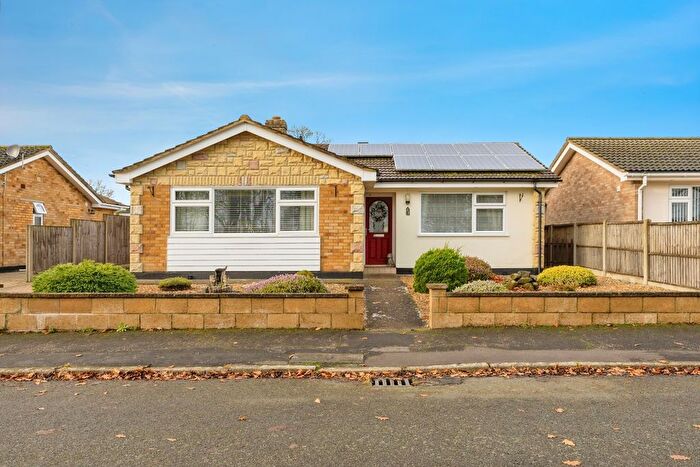
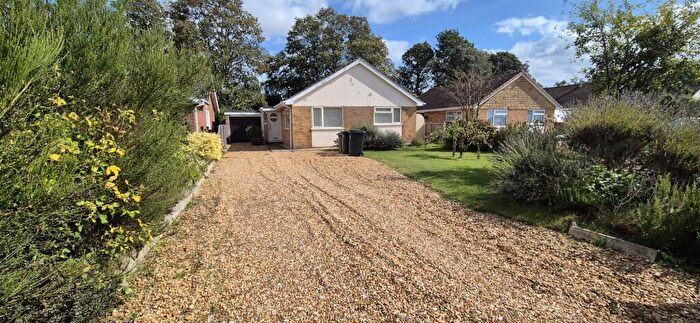
Properties for sale in Haggard De Toni
Roads and Postcodes in Haggard De Toni
Navigate through our locations to find the location of your next house in Haggard De Toni, Thetford for sale or to rent.
| Streets | Postcodes |
|---|---|
| Admiral Close | IP25 7GB |
| Amys Close | IP25 7HU |
| Bell Lane | IP25 7HD |
| Bellmere Way | IP25 7HA |
| Brandon Road | IP25 6LR |
| Bridge Lane | IP25 7JW |
| Chequers Lane | IP25 7HH IP25 7HQ |
| Church Street | IP25 7QL |
| Cley Lane | IP25 7HE |
| Coburg Lane | IP25 7JF |
| Council Houses | IP25 7JN |
| Cressingham Road | IP25 7AF |
| Dolphin Crescent | IP25 7EL |
| Hale Road | IP25 7QX IP25 7RA |
| High Green | IP25 7RD |
| Hills Road | IP25 7EN IP25 7EW IP25 7EZ |
| Hillside Mews | IP25 7FB |
| Hunts Farm Close | IP25 7GE |
| Leys Farm Cottages | IP25 7QF |
| Long Road | IP25 7RH IP25 7RJ |
| Martins Close | IP25 7EQ |
| Mere Close | IP25 7HS |
| Mill Hill | IP25 7QW |
| Mill Street | IP25 7QN |
| Millview | IP25 7HG |
| Nelson Close | IP25 7RB |
| Neville Close | IP25 7HR |
| Ovington Road | IP25 7HF |
| Pages Lane | IP25 7HJ IP25 7HL |
| Park Farm Cottages | IP25 7JL |
| Pound Hill | IP25 7HN |
| Richmond Road | IP25 7EP IP25 7ER IP25 7ES IP25 7ET IP25 7EU IP25 7EX |
| Saham Hills | IP25 7JG IP25 7JJ |
| School Road | IP25 7QU |
| Shepherds Drove | IP25 7BD |
| Southend | IP25 7QY |
| St Georges Close | IP25 7HT |
| The Oval | IP25 7HW |
| Threxton Road | IP25 7AB |
| Westend | IP25 7QZ |
| White Hall Lane | IP25 7HB |
| White Horse Close | IP25 7EY |
| Woodview Close | IP25 7HZ |
| IP25 7QG IP25 7QH IP25 7QR IP25 7SL |
Transport near Haggard De Toni
-
Attleborough Station
-
Harling Road Station
-
Eccles Road Station
-
Spooner Row Station
-
Wymondham Station
-
Thetford Station
-
Brandon Station
- FAQ
- Price Paid By Year
- Property Type Price
Frequently asked questions about Haggard De Toni
What is the average price for a property for sale in Haggard De Toni?
The average price for a property for sale in Haggard De Toni is £360,784. This amount is 32% higher than the average price in Thetford. There are 2,960 property listings for sale in Haggard De Toni.
What streets have the most expensive properties for sale in Haggard De Toni?
The streets with the most expensive properties for sale in Haggard De Toni are Hillside Mews at an average of £747,500, Richmond Road at an average of £598,928 and School Road at an average of £514,400.
What streets have the most affordable properties for sale in Haggard De Toni?
The streets with the most affordable properties for sale in Haggard De Toni are The Oval at an average of £157,500, Brandon Road at an average of £200,000 and Southend at an average of £242,500.
Which train stations are available in or near Haggard De Toni?
Some of the train stations available in or near Haggard De Toni are Attleborough, Harling Road and Eccles Road.
Property Price Paid in Haggard De Toni by Year
The average sold property price by year was:
| Year | Average Sold Price | Price Change |
Sold Properties
|
|---|---|---|---|
| 2025 | £302,100 | -29% |
15 Properties |
| 2024 | £389,355 | 6% |
31 Properties |
| 2023 | £364,808 | 2% |
34 Properties |
| 2022 | £357,476 | 2% |
43 Properties |
| 2021 | £351,115 | 12% |
52 Properties |
| 2020 | £310,231 | 10% |
30 Properties |
| 2019 | £279,590 | -5% |
22 Properties |
| 2018 | £294,479 | 11% |
36 Properties |
| 2017 | £260,779 | 2% |
48 Properties |
| 2016 | £254,575 | 4% |
42 Properties |
| 2015 | £244,284 | 2% |
42 Properties |
| 2014 | £239,418 | 8% |
51 Properties |
| 2013 | £219,743 | 3% |
37 Properties |
| 2012 | £212,096 | -2% |
31 Properties |
| 2011 | £215,363 | 24% |
33 Properties |
| 2010 | £164,043 | -30% |
16 Properties |
| 2009 | £213,884 | 18% |
35 Properties |
| 2008 | £175,047 | -26% |
17 Properties |
| 2007 | £220,278 | 13% |
49 Properties |
| 2006 | £190,653 | -4% |
41 Properties |
| 2005 | £198,539 | 10% |
48 Properties |
| 2004 | £178,311 | 24% |
36 Properties |
| 2003 | £135,685 | -2% |
40 Properties |
| 2002 | £138,549 | 18% |
36 Properties |
| 2001 | £112,978 | 32% |
50 Properties |
| 2000 | £77,230 | -25% |
30 Properties |
| 1999 | £96,182 | 20% |
57 Properties |
| 1998 | £76,484 | 13% |
52 Properties |
| 1997 | £66,495 | 12% |
54 Properties |
| 1996 | £58,567 | -2% |
41 Properties |
| 1995 | £59,830 | - |
33 Properties |
Property Price per Property Type in Haggard De Toni
Here you can find historic sold price data in order to help with your property search.
The average Property Paid Price for specific property types in the last three years are:
| Property Type | Average Sold Price | Sold Properties |
|---|---|---|
| Semi Detached House | £285,056.00 | 36 Semi Detached Houses |
| Detached House | £410,673.00 | 78 Detached Houses |
| Terraced House | £231,333.00 | 9 Terraced Houses |

