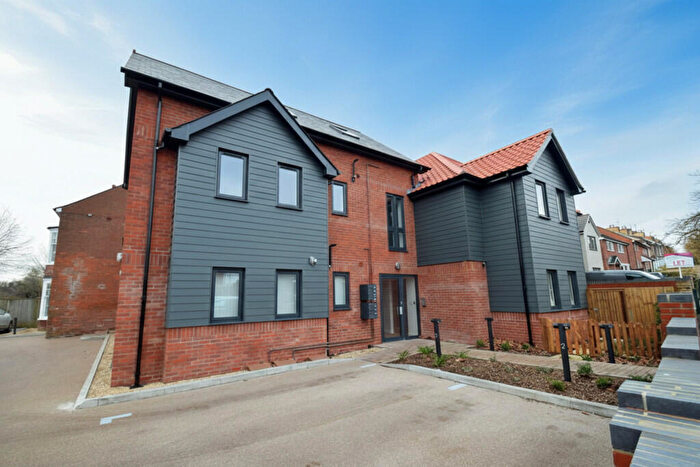
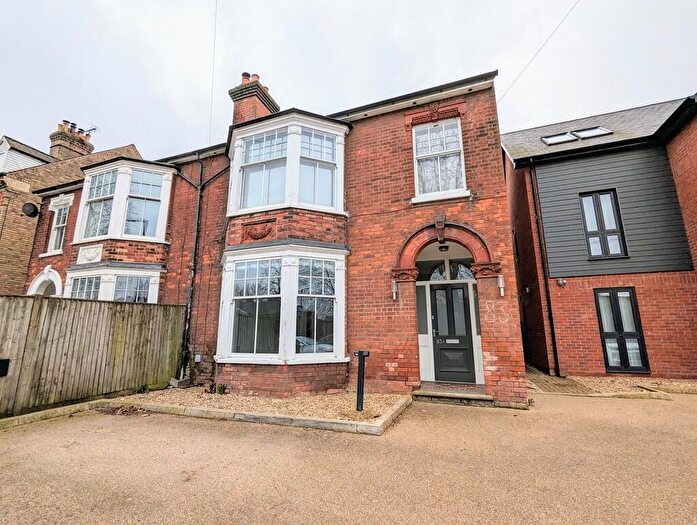
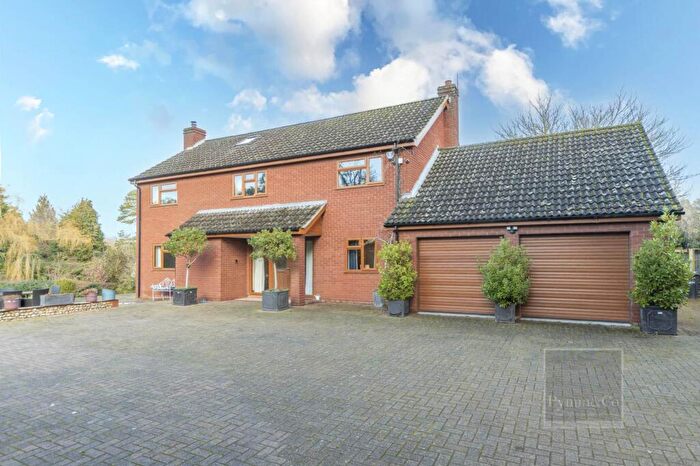
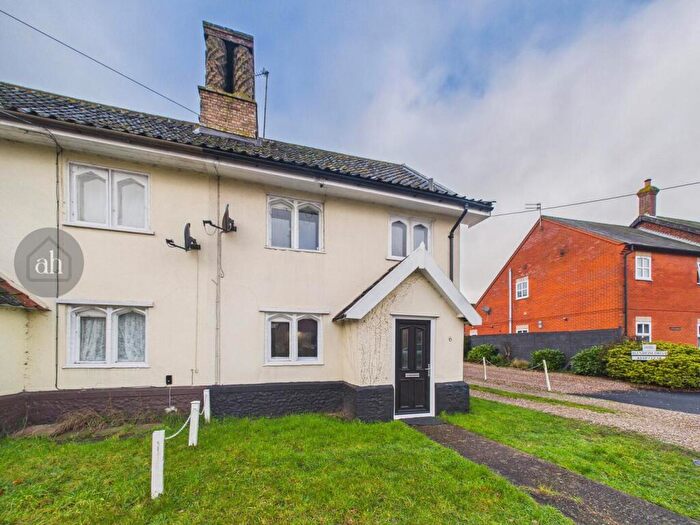
Houses for sale & to rent in Thetford, Norfolk
House Prices in Thetford
Properties in Thetford have an average house price of £261,519.00 and had 2,196 Property Transactions within the last 3 years.¹
Thetford is an area in Norfolk with 21,813 households², where the most expensive property was sold for £2,200,000.00.
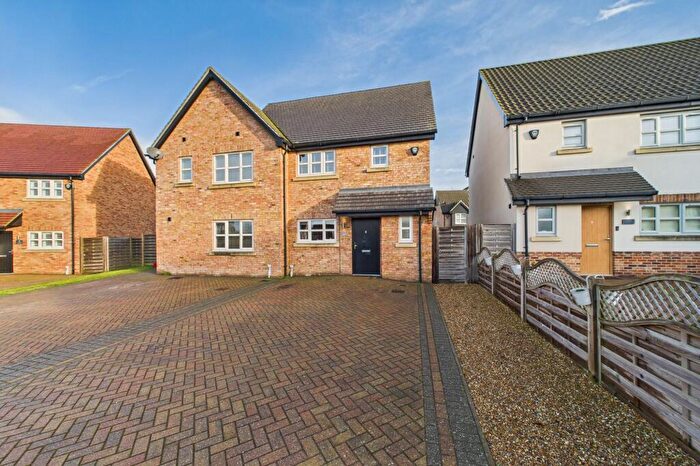
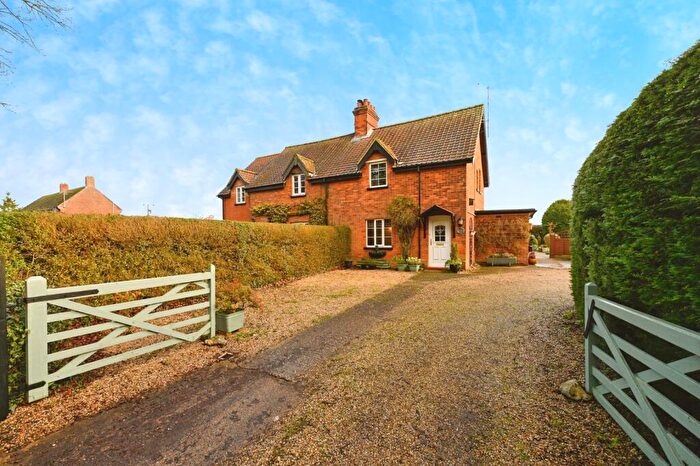
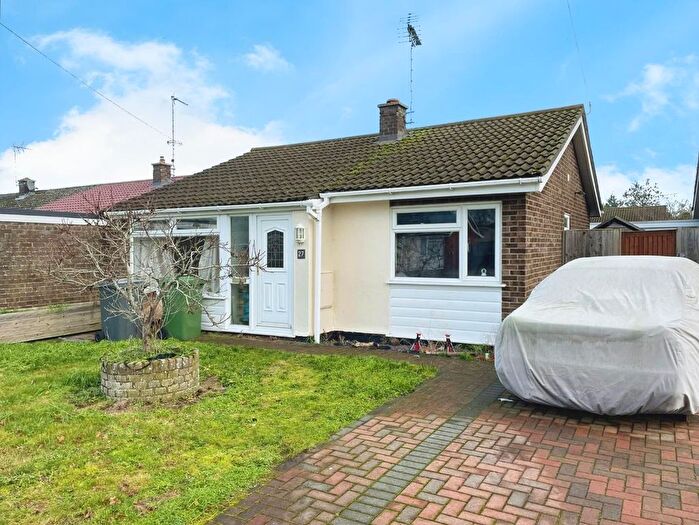
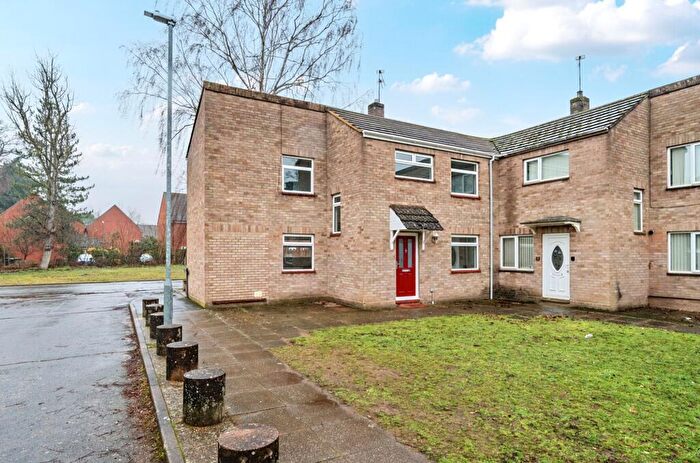
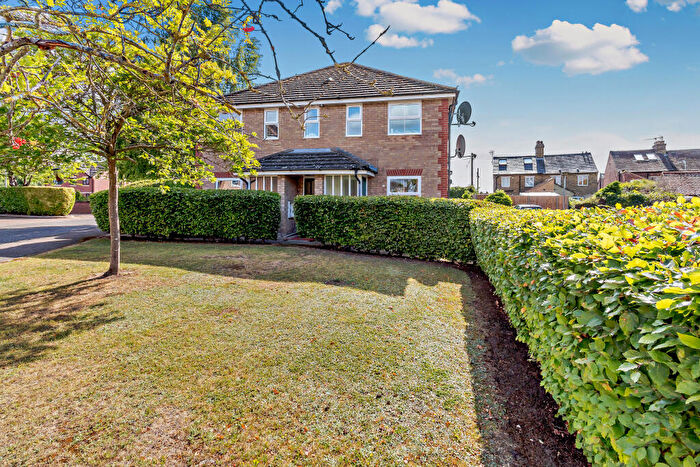
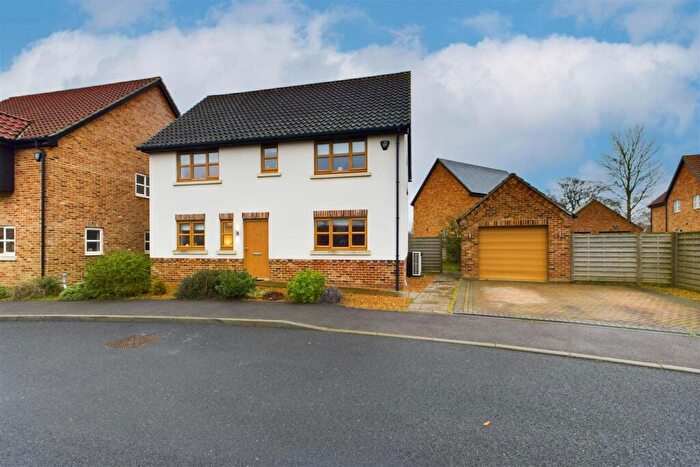
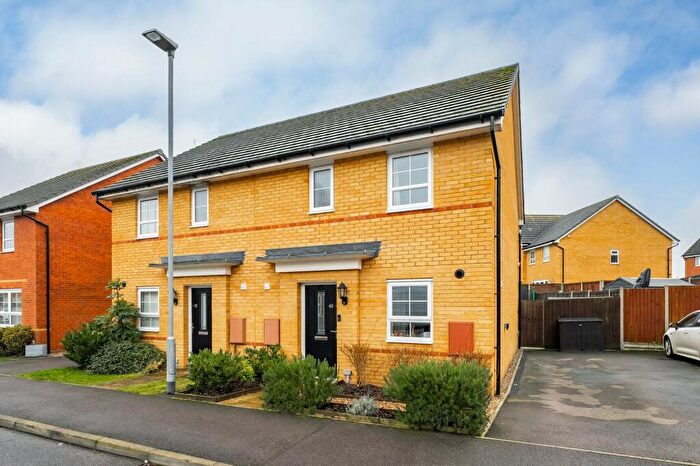
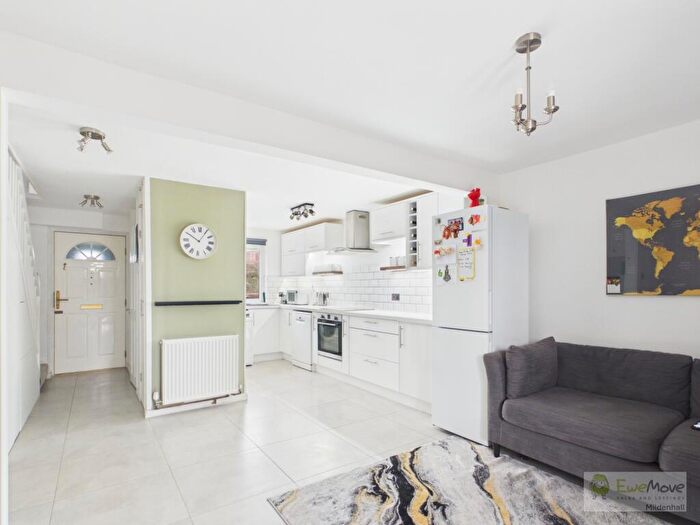
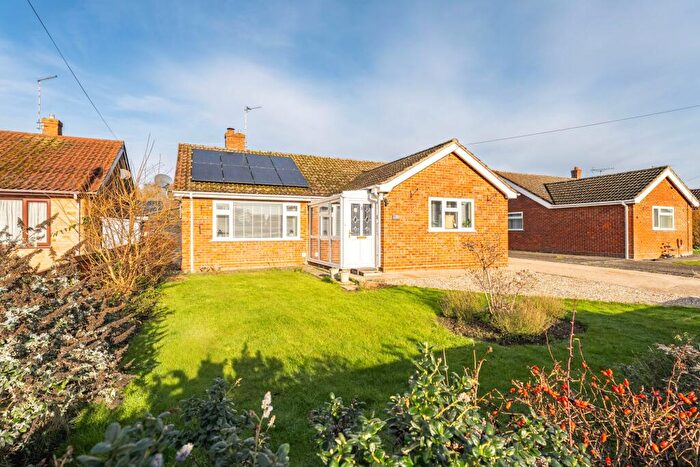
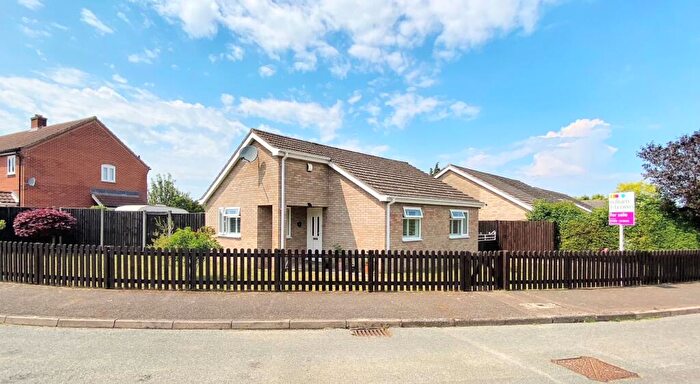
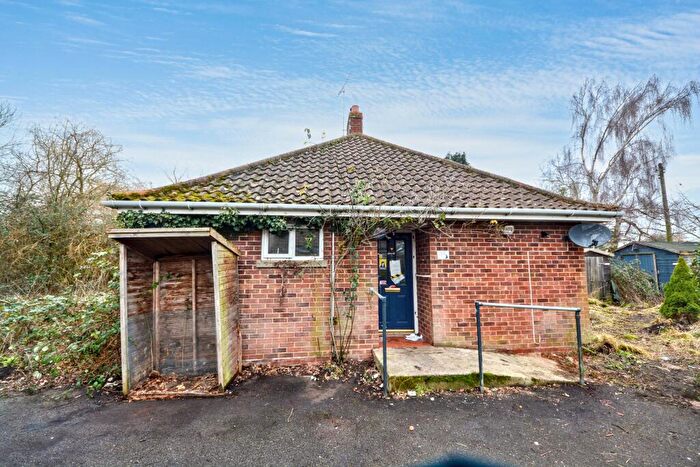
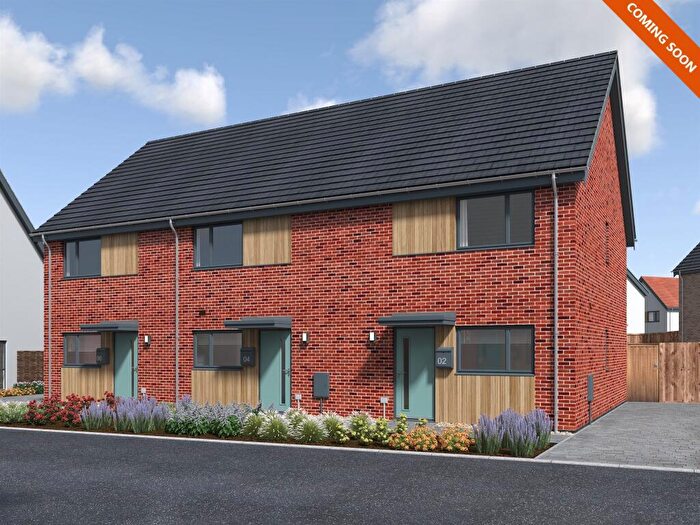
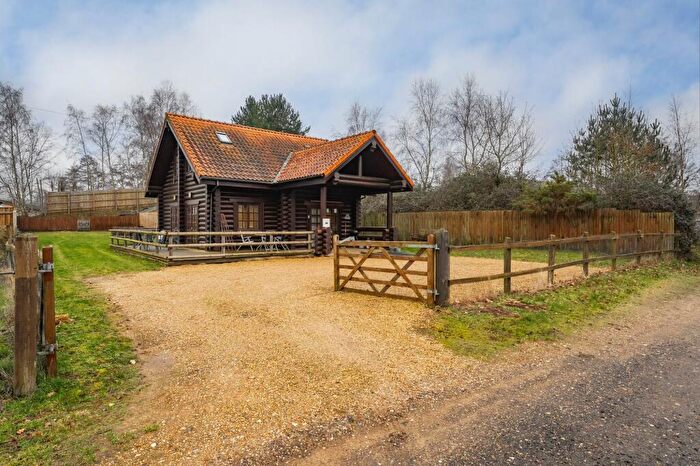
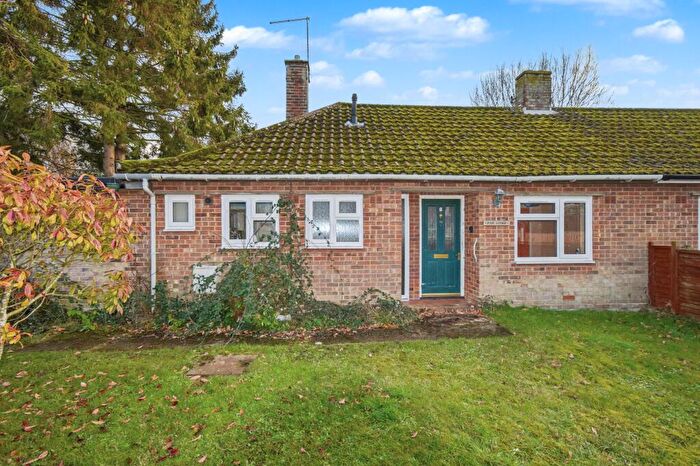
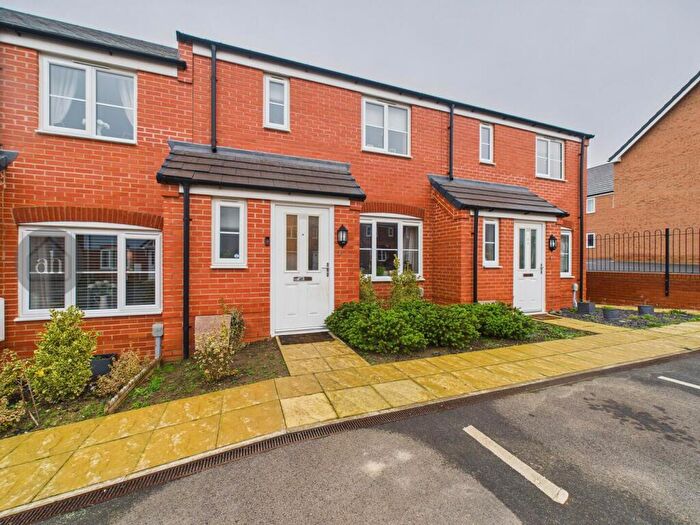
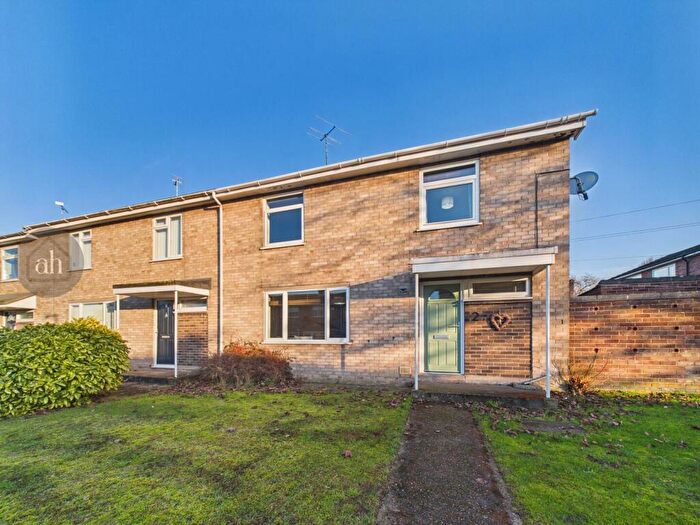
Properties for sale in Thetford
Neighbourhoods in Thetford
Navigate through our locations to find the location of your next house in Thetford, Norfolk for sale or to rent.
- Conifer
- Denton
- Haggard De Toni
- Harling And Heathlands
- Mid Forest
- Shipdham
- Springvale And Scarning
- Templar
- Thetford-abbey
- Thetford-castle
- Thetford-guildhall
- Thetford-saxon
- Upper Yare
- Watton
- Wayland
- Weeting
- Wissey
- Thetford Priory
- All Saints & Wayland
- Thetford Boudica
- Thetford Burrell
- Harling & Heathlands
- Ashill
- Saham Toney
- Shipdham-with-Scarning
- Feltwell
- Methwold
- Bedingfeld
- Lakenheath
- Forest
- Necton
Transport in Thetford
Please see below transportation links in this area:
- FAQ
- Price Paid By Year
- Property Type Price
Frequently asked questions about Thetford
What is the average price for a property for sale in Thetford?
The average price for a property for sale in Thetford is £261,519. This amount is 13% lower than the average price in Norfolk. There are more than 10,000 property listings for sale in Thetford.
What locations have the most expensive properties for sale in Thetford?
The locations with the most expensive properties for sale in Thetford are Harling And Heathlands at an average of £564,636, Methwold at an average of £500,000 and Weeting at an average of £448,812.
What locations have the most affordable properties for sale in Thetford?
The locations with the most affordable properties for sale in Thetford are Thetford Burrell at an average of £111,045, Thetford-abbey at an average of £210,011 and Thetford-saxon at an average of £212,892.
Which train stations are available in or near Thetford?
Some of the train stations available in or near Thetford are Thetford, Brandon and Harling Road.
Property Price Paid in Thetford by Year
The average sold property price by year was:
| Year | Average Sold Price | Price Change |
Sold Properties
|
|---|---|---|---|
| 2025 | £260,122 | 1% |
630 Properties |
| 2024 | £256,461 | -4% |
795 Properties |
| 2023 | £267,876 | -13% |
771 Properties |
| 2022 | £301,380 | 14% |
957 Properties |
| 2021 | £258,355 | 5% |
1,187 Properties |
| 2020 | £244,547 | 8% |
824 Properties |
| 2019 | £224,164 | 1% |
974 Properties |
| 2018 | £222,833 | 4% |
981 Properties |
| 2017 | £213,836 | 6% |
1,023 Properties |
| 2016 | £200,320 | 8% |
1,104 Properties |
| 2015 | £185,009 | 3% |
1,045 Properties |
| 2014 | £178,771 | 10% |
1,038 Properties |
| 2013 | £161,248 | 3% |
841 Properties |
| 2012 | £156,984 | -1% |
680 Properties |
| 2011 | £158,396 | -1% |
730 Properties |
| 2010 | £160,517 | 9% |
647 Properties |
| 2009 | £145,945 | -13% |
587 Properties |
| 2008 | £164,252 | -4% |
607 Properties |
| 2007 | £170,881 | 5% |
1,376 Properties |
| 2006 | £162,089 | 8% |
1,422 Properties |
| 2005 | £149,111 | 3% |
1,174 Properties |
| 2004 | £144,441 | 14% |
1,288 Properties |
| 2003 | £123,737 | 17% |
1,301 Properties |
| 2002 | £103,146 | 19% |
1,354 Properties |
| 2001 | £83,698 | 12% |
1,193 Properties |
| 2000 | £73,301 | 10% |
1,185 Properties |
| 1999 | £66,176 | 9% |
1,325 Properties |
| 1998 | £60,311 | 5% |
1,299 Properties |
| 1997 | £57,219 | 8% |
1,089 Properties |
| 1996 | £52,544 | 4% |
929 Properties |
| 1995 | £50,627 | - |
757 Properties |
Property Price per Property Type in Thetford
Here you can find historic sold price data in order to help with your property search.
The average Property Paid Price for specific property types in the last three years are:
| Property Type | Average Sold Price | Sold Properties |
|---|---|---|
| Semi Detached House | £234,935.00 | 561 Semi Detached Houses |
| Terraced House | £190,484.00 | 615 Terraced Houses |
| Detached House | £346,643.00 | 890 Detached Houses |
| Flat | £129,519.00 | 130 Flats |

