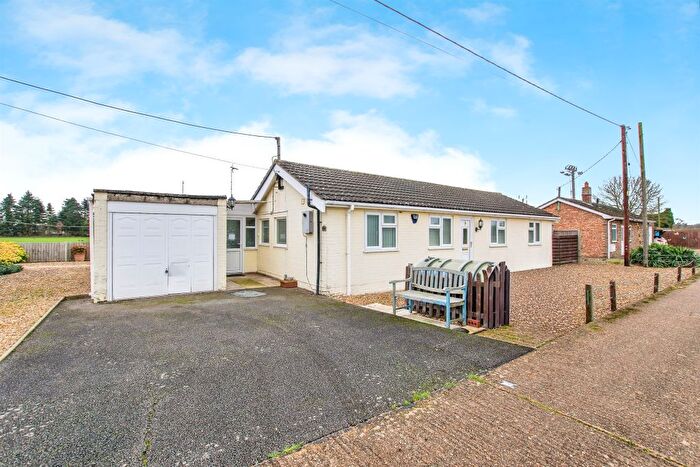
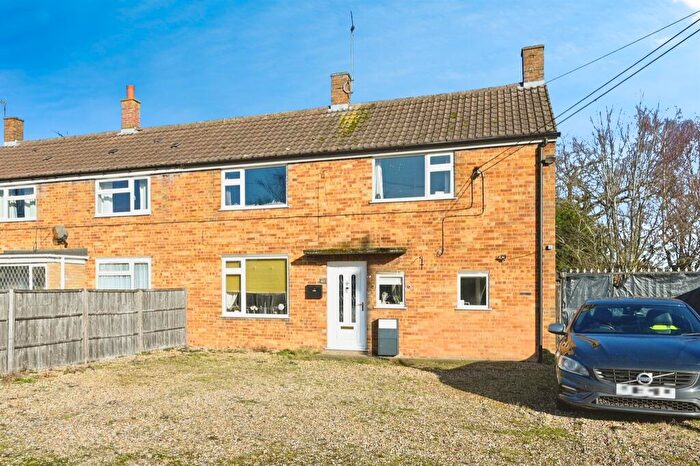
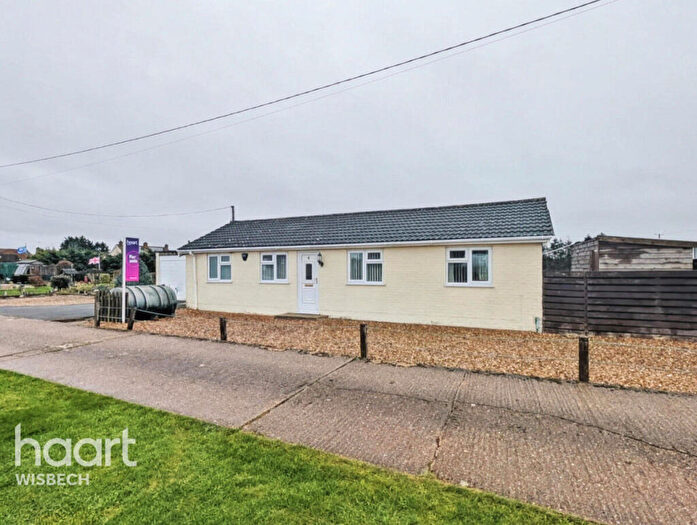
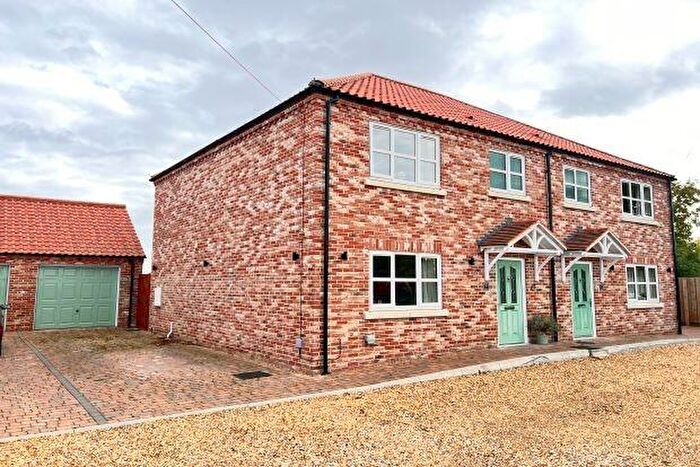
Houses for sale & to rent in Upwell And Delph, Wisbech
House Prices in Upwell And Delph
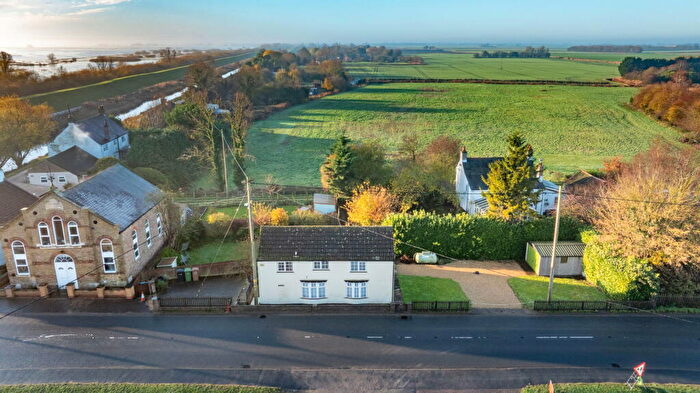
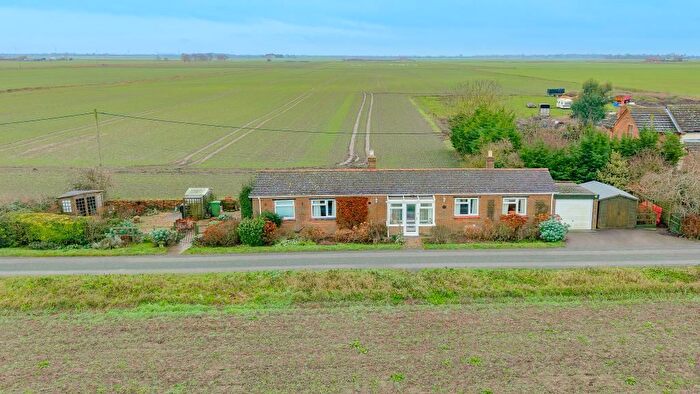
Properties in Upwell And Delph have an average house price of £258,123.00 and had 101 Property Transactions within the last 3 years¹.
Upwell And Delph is an area in Wisbech, Norfolk with 1,299 households², where the most expensive property was sold for £735,000.00.
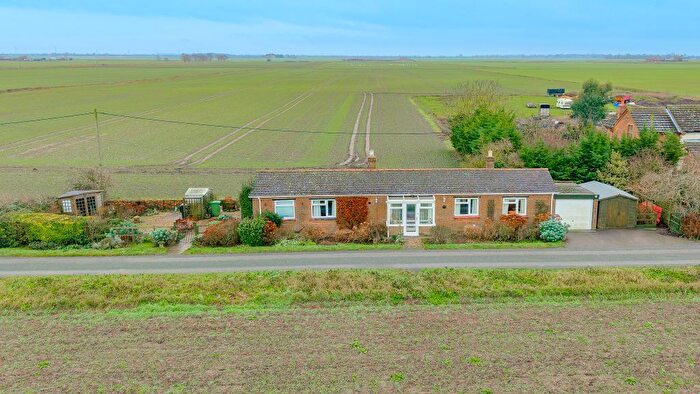
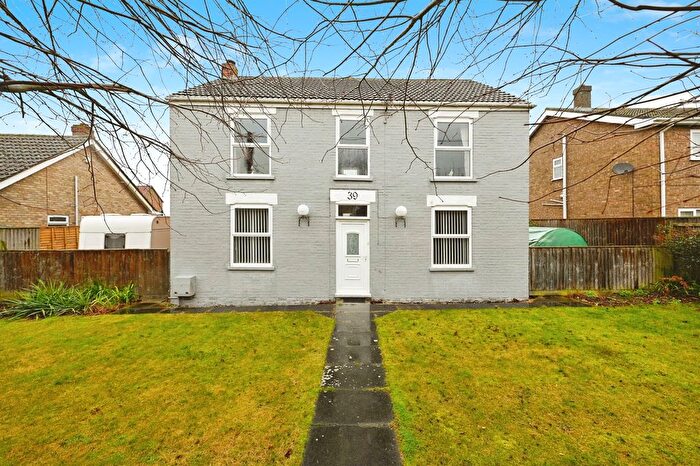
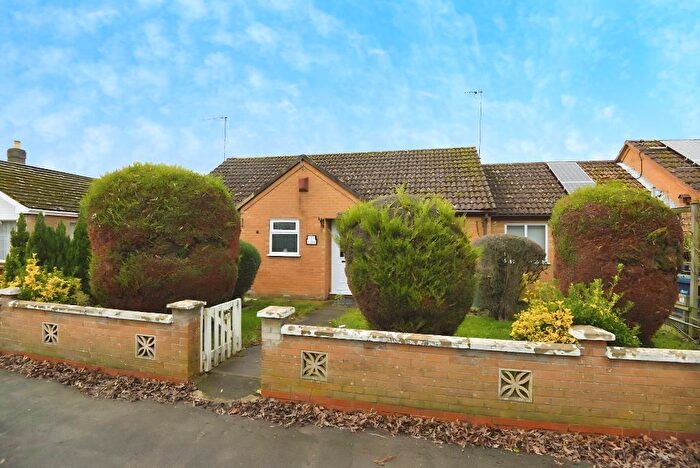
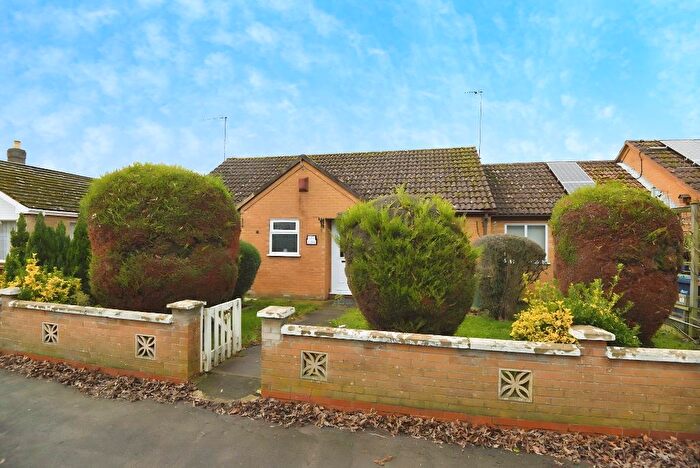
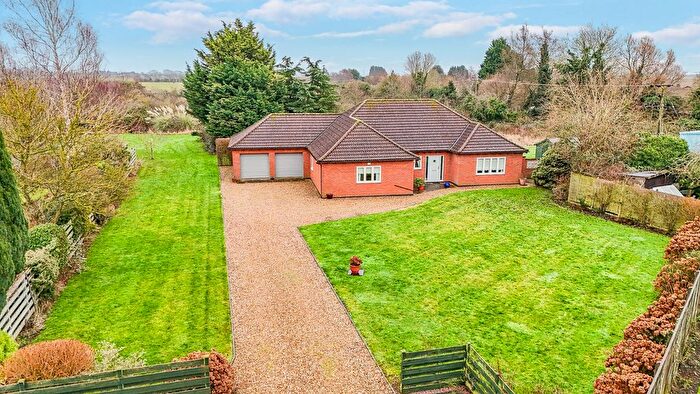
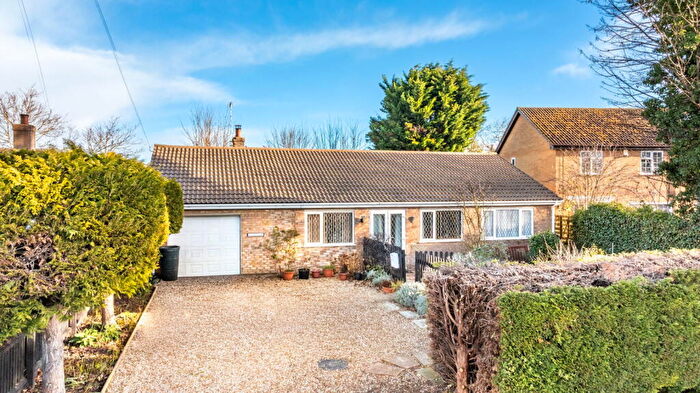
Properties for sale in Upwell And Delph
Roads and Postcodes in Upwell And Delph
Navigate through our locations to find the location of your next house in Upwell And Delph, Wisbech for sale or to rent.
| Streets | Postcodes |
|---|---|
| Back Drove | PE14 9EX PE14 9RH |
| Baptist Road | PE14 9DU PE14 9EY |
| Bardyke Bank | PE14 9HH PE14 9HN |
| Bedford Bank | PE14 9RJ |
| Broad Drove | PE14 9HA |
| Chestnut Avenue | PE14 9RG |
| Cock Fen Road | PE14 9QE PE14 9QQ |
| Croft Road | PE14 9HE PE14 9HQ |
| Dovecote Road | PE14 9HB |
| Elderberry Place | PE14 9BF |
| Fred Hartleys Bungalows | PE14 9QB |
| Green Road | PE14 9HS |
| Hall Bridge Road | PE14 9DP |
| Herne Drove | PE14 9SD |
| Herneside | PE14 9SB |
| Horsehead Drove | PE14 9JJ |
| Hundred Foot Bank | PE14 9TL PE14 9TN |
| Hurst Crescent | PE14 9QJ |
| Lake Avenue | PE14 9QD |
| Lakes End | PE14 9QH |
| Listers Road | PE14 9BW |
| Lode Avenue | PE14 9BH |
| Lode Avenue Bungalows | PE14 9BQ |
| Lotts Bridge | PE14 9JG |
| Low Side | PE14 9BB |
| Main Road | PE14 9JA PE14 9JS |
| Main Street | PE14 9RB |
| March Road | PE14 9SA PE14 9SE |
| Mill Rigg | PE14 9DR |
| Millfield | PE14 9AH |
| Mudds Drove | PE14 9JU |
| Mulberry Lea | PE14 9AG |
| Mumbys Drove | PE14 9JT |
| New Bridge | PE14 9DW |
| New Bridge Road | PE14 9DT |
| New Road | PE14 9AB PE14 9BP PE14 9HP PE14 9RA |
| Pinfold Road | PE14 9DZ |
| Ransomes Close | PE14 9AY |
| Scholars Way | PE14 9BX |
| School Road | PE14 9ES PE14 9EW |
| Small Lode | PE14 9BA PE14 9BE PE14 9BG PE14 9BL |
| Squires Drove | PE14 9JY |
| St Peters Road | PE14 9EH PE14 9EJ |
| Stone House Road | PE14 9DX PE14 9EA |
| Stow Road | PE14 8QN |
| Suspension Bridge | PE14 9TF PE14 9TJ |
| Taymor Place | PE14 9RD |
| The Pingle | PE14 9BN |
| The Row | PE14 9JR |
| The Russets | PE14 9AJ PE14 9AQ |
| Thurlands Drove | PE14 9AP |
| Tipps End | PE14 9SF |
| Tointons Road | PE14 9HL |
| Toll Road | PE14 9JB |
| Town Street | PE14 9AD PE14 9AF PE14 9AU PE14 9DA PE14 9DF PE14 9DQ |
| Townley Close | PE14 9BT |
| Townsend Road | PE14 9HJ |
| West Villas | PE14 9AL |
| Wisbech Road | PE14 9QA PE14 9QN PE14 9RF PE14 9RQ PE14 9SQ |
| Workhouse Lane | PE14 9ET |
| PE14 9JW |
Transport near Upwell And Delph
- FAQ
- Price Paid By Year
- Property Type Price
Frequently asked questions about Upwell And Delph
What is the average price for a property for sale in Upwell And Delph?
The average price for a property for sale in Upwell And Delph is £258,123. This amount is 11% lower than the average price in Wisbech. There are 1,550 property listings for sale in Upwell And Delph.
What streets have the most expensive properties for sale in Upwell And Delph?
The streets with the most expensive properties for sale in Upwell And Delph are Thurlands Drove at an average of £615,000, Wisbech Road at an average of £515,000 and Low Side at an average of £464,000.
What streets have the most affordable properties for sale in Upwell And Delph?
The streets with the most affordable properties for sale in Upwell And Delph are Back Drove at an average of £100,000, Herneside at an average of £103,600 and Lode Avenue Bungalows at an average of £115,000.
Which train stations are available in or near Upwell And Delph?
Some of the train stations available in or near Upwell And Delph are Manea, March and Downham Market.
Property Price Paid in Upwell And Delph by Year
The average sold property price by year was:
| Year | Average Sold Price | Price Change |
Sold Properties
|
|---|---|---|---|
| 2025 | £279,279 | 17% |
34 Properties |
| 2024 | £233,015 | -12% |
32 Properties |
| 2023 | £260,528 | -31% |
35 Properties |
| 2022 | £340,344 | 18% |
68 Properties |
| 2021 | £278,971 | 13% |
61 Properties |
| 2020 | £241,953 | -1% |
44 Properties |
| 2019 | £243,454 | -3% |
44 Properties |
| 2018 | £250,351 | 18% |
47 Properties |
| 2017 | £205,598 | 8% |
74 Properties |
| 2016 | £188,693 | 18% |
62 Properties |
| 2015 | £154,087 | -17% |
57 Properties |
| 2014 | £179,565 | 4% |
75 Properties |
| 2013 | £172,725 | -1% |
41 Properties |
| 2012 | £173,774 | 16% |
40 Properties |
| 2011 | £145,297 | -30% |
55 Properties |
| 2010 | £189,269 | 11% |
39 Properties |
| 2009 | £168,858 | -5% |
60 Properties |
| 2008 | £177,443 | -4% |
36 Properties |
| 2007 | £185,396 | 1% |
73 Properties |
| 2006 | £183,788 | 9% |
89 Properties |
| 2005 | £166,923 | 8% |
56 Properties |
| 2004 | £153,189 | 16% |
95 Properties |
| 2003 | £128,124 | 13% |
66 Properties |
| 2002 | £111,798 | 21% |
80 Properties |
| 2001 | £88,607 | 21% |
74 Properties |
| 2000 | £70,329 | 11% |
60 Properties |
| 1999 | £62,249 | 12% |
82 Properties |
| 1998 | £54,895 | -19% |
62 Properties |
| 1997 | £65,428 | 14% |
56 Properties |
| 1996 | £56,327 | 20% |
63 Properties |
| 1995 | £45,203 | - |
41 Properties |
Property Price per Property Type in Upwell And Delph
Here you can find historic sold price data in order to help with your property search.
The average Property Paid Price for specific property types in the last three years are:
| Property Type | Average Sold Price | Sold Properties |
|---|---|---|
| Semi Detached House | £197,900.00 | 35 Semi Detached Houses |
| Detached House | £323,555.00 | 54 Detached Houses |
| Terraced House | £138,818.00 | 11 Terraced Houses |
| Flat | £145,000.00 | 1 Flat |

