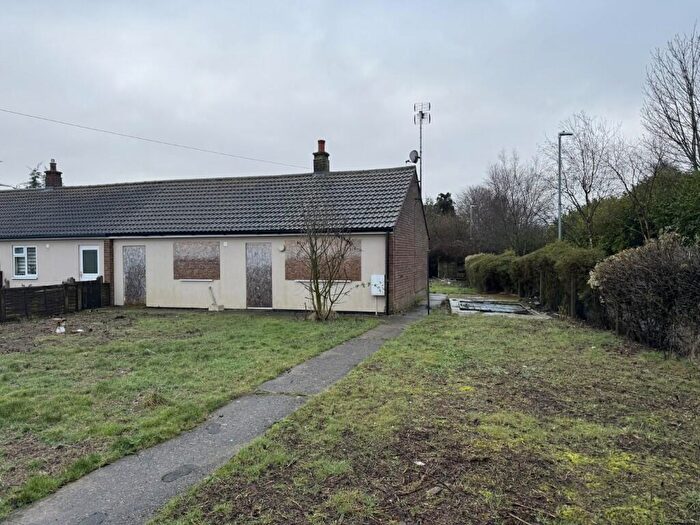
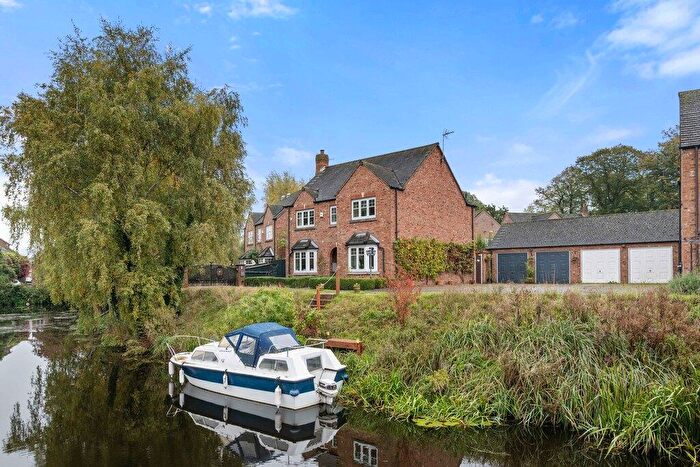
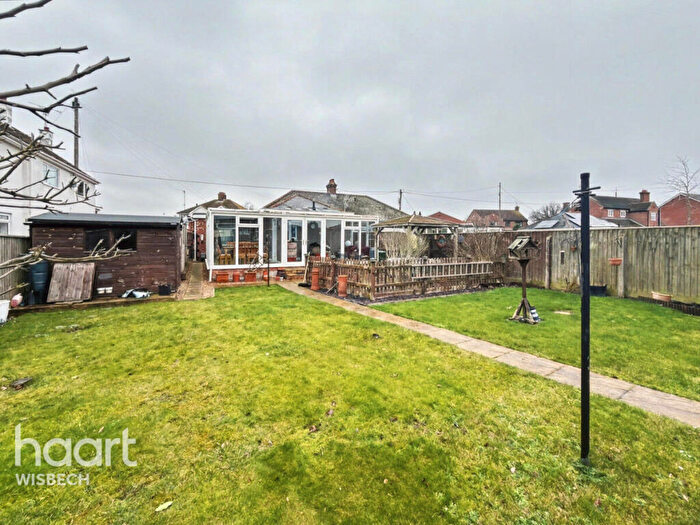
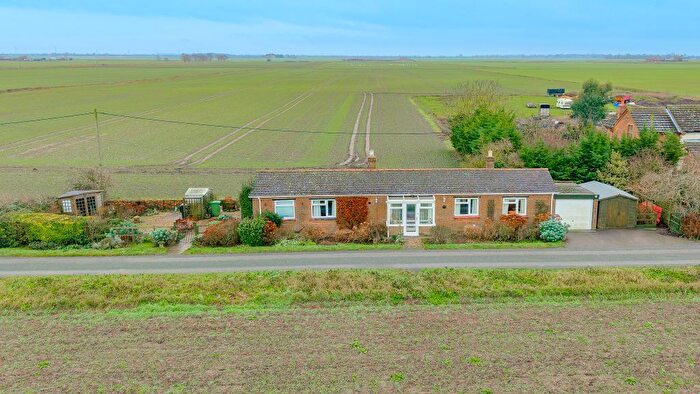
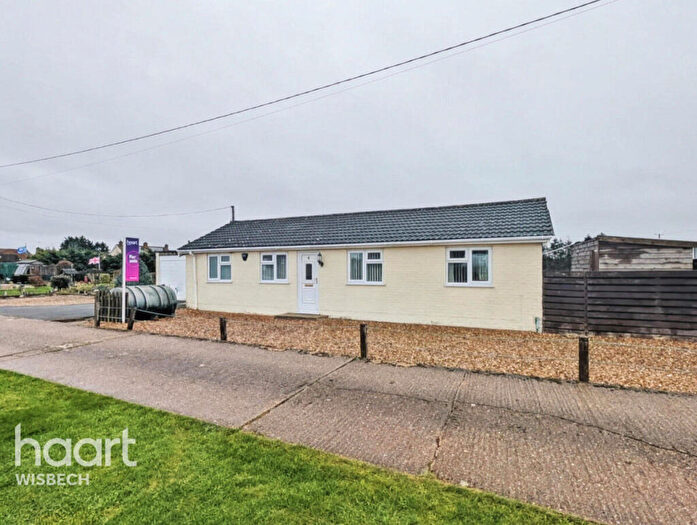
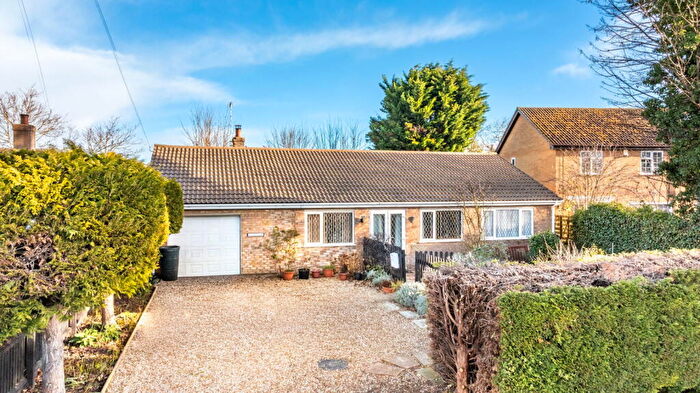
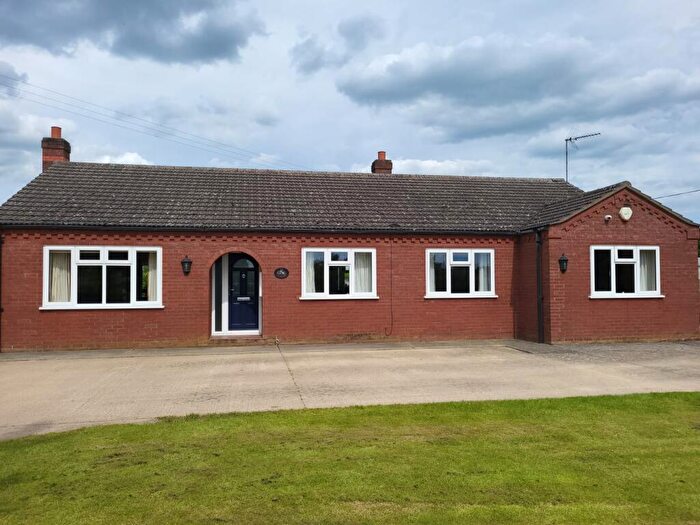
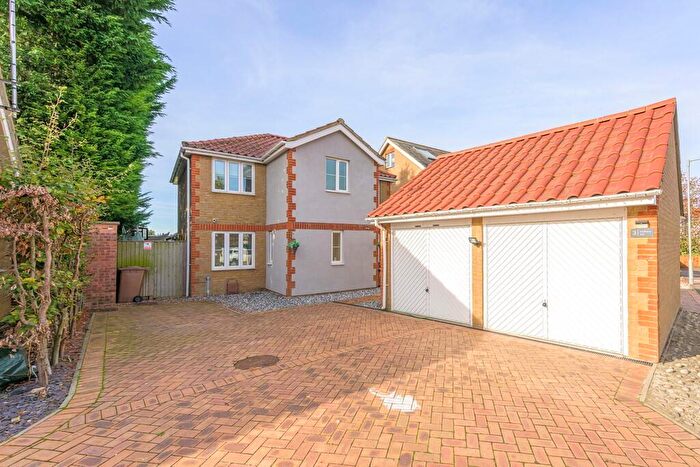
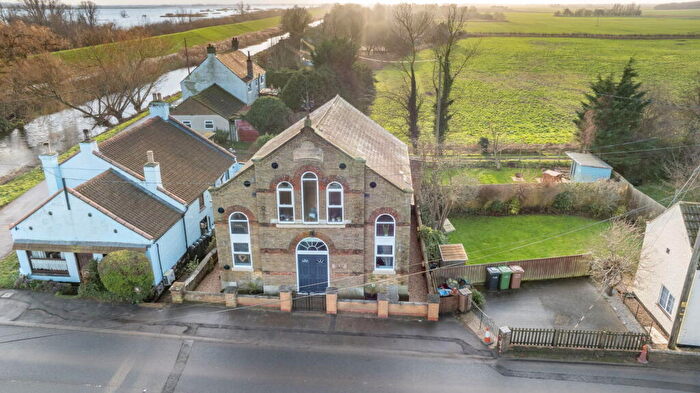
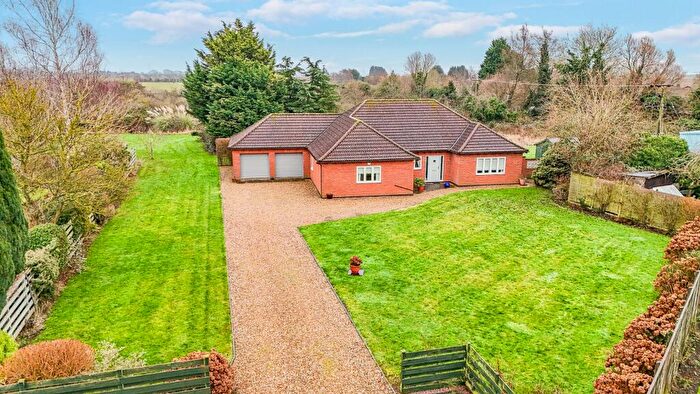
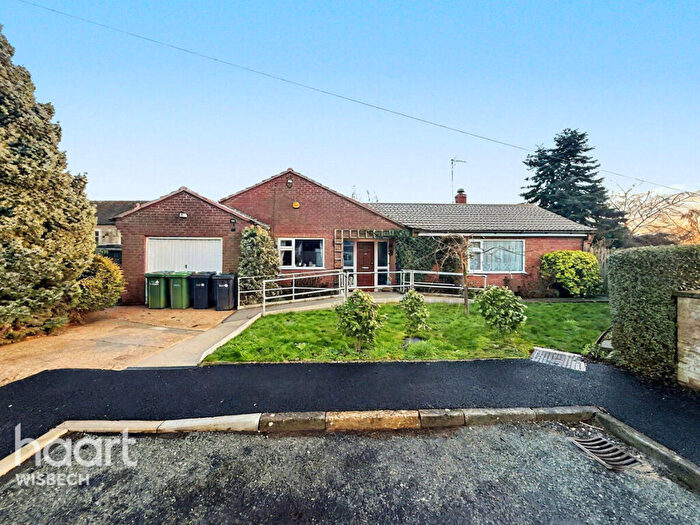
Houses for sale & to rent in Upwell & Delph, Wisbech
House Prices in Upwell & Delph
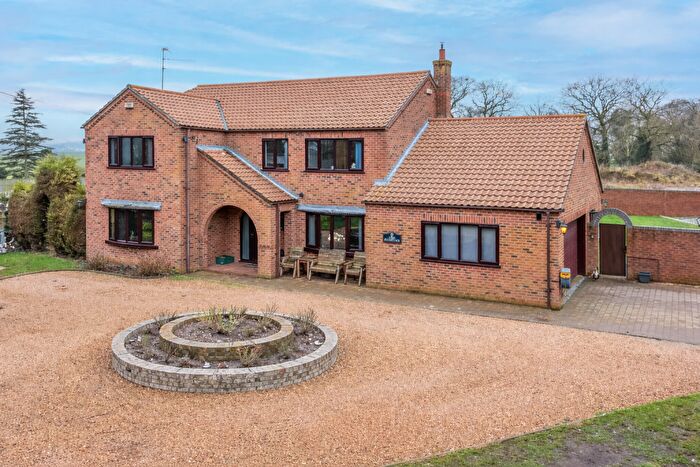
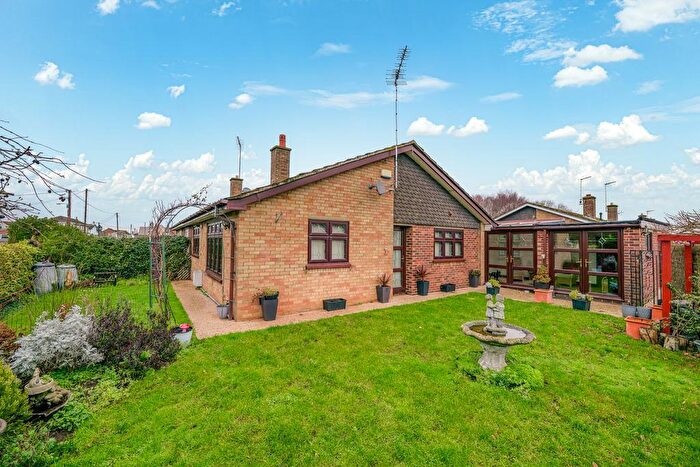
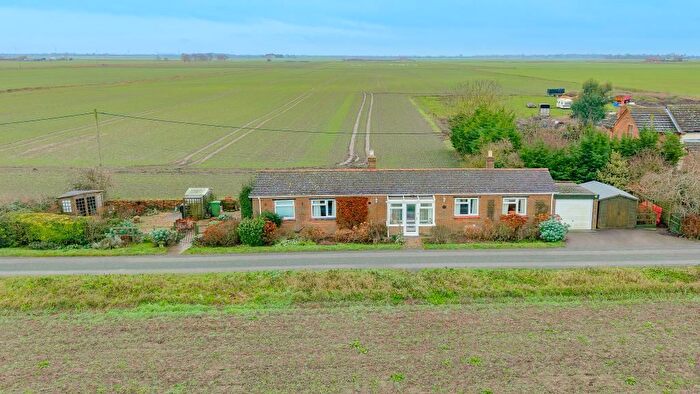
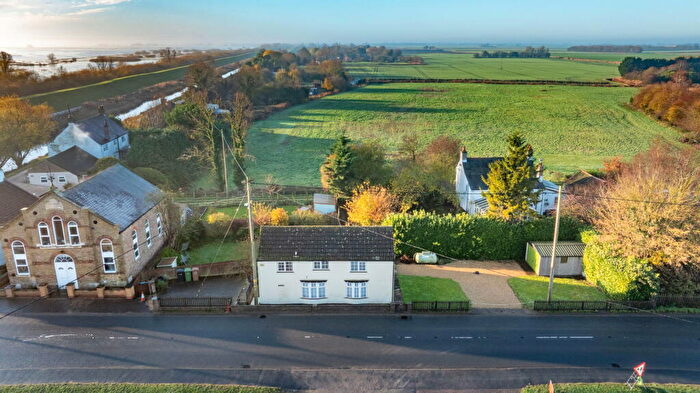
Properties in Upwell & Delph have an average house price of £459,437.00 and had 8 Property Transactions within the last 3 years¹.
Upwell & Delph is an area in Wisbech, Norfolk with 46 households², where the most expensive property was sold for £650,000.00.
Properties for sale in Upwell & Delph
Roads and Postcodes in Upwell & Delph
Navigate through our locations to find the location of your next house in Upwell & Delph, Wisbech for sale or to rent.
| Streets | Postcodes |
|---|---|
| Baptist Road | PE14 9EU |
| Bedford Bank | PE14 9RL |
| Blunts Orchard Drive | PE14 9EP |
| Chalk Road | PE14 9BS PE14 9BZ |
| Cock Fen Road | PE14 9QF PE14 9QG |
| Edina Terrace | PE14 9LA |
| Flint House Road | PE14 9JN |
| Gooseberry Lane | PE14 9JP |
| Ha Penny Toll Road | PE14 9JE |
| Lott's Bridge | PE14 9JQ |
| Main Road | PE14 9JX |
| Main Street | PE14 9RE |
| March Riverside | PE14 9DS |
| New Road | PE14 9AA |
| Old Bedford Row | PE14 9RN |
| Orchard Gardens | PE14 9EQ |
| Rotten Drove | PE14 9SW |
| St Peters Road | PE14 9EL PE14 9EN |
| The Lodge | PE14 9BU |
| Wisbech Road | PE14 9QL PE14 9QP |
| PE14 8QJ PE14 9ER PE14 9HW |
Transport near Upwell & Delph
- FAQ
- Price Paid By Year
- Property Type Price
Frequently asked questions about Upwell & Delph
What is the average price for a property for sale in Upwell & Delph?
The average price for a property for sale in Upwell & Delph is £459,437. This amount is 61% higher than the average price in Wisbech. There are 1,107 property listings for sale in Upwell & Delph.
What streets have the most expensive properties for sale in Upwell & Delph?
The streets with the most expensive properties for sale in Upwell & Delph are Orchard Gardens at an average of £512,000 and Blunts Orchard Drive at an average of £506,000.
What streets have the most affordable properties for sale in Upwell & Delph?
The street with the most affordable properties for sale in Upwell & Delph is Baptist Road at an average of £97,500.
Which train stations are available in or near Upwell & Delph?
Some of the train stations available in or near Upwell & Delph are Manea, March and Downham Market.
Property Price Paid in Upwell & Delph by Year
The average sold property price by year was:
| Year | Average Sold Price | Price Change |
Sold Properties
|
|---|---|---|---|
| 2025 | £281,250 | -88% |
2 Properties |
| 2024 | £527,666 | 3% |
3 Properties |
| 2023 | £510,000 | 29% |
3 Properties |
| 2021 | £360,888 | 3% |
9 Properties |
| 2020 | £349,722 | 14% |
9 Properties |
| 2019 | £302,500 | 31% |
2 Properties |
| 2018 | £208,500 | 16% |
6 Properties |
| 2017 | £175,000 | -0,3% |
1 Property |
| 2016 | £175,500 | 34% |
3 Properties |
| 2014 | £115,500 | 13% |
1 Property |
| 2012 | £100,000 | -78% |
1 Property |
| 2011 | £178,000 | -154% |
1 Property |
| 2007 | £452,500 | 89% |
1 Property |
| 2002 | £50,000 | -400% |
1 Property |
| 2001 | £249,999 | 49% |
1 Property |
| 1998 | £127,499 | - |
2 Properties |
Property Price per Property Type in Upwell & Delph
Here you can find historic sold price data in order to help with your property search.
The average Property Paid Price for specific property types in the last three years are:
| Property Type | Average Sold Price | Sold Properties |
|---|---|---|
| Detached House | £459,437.00 | 8 Detached Houses |

