
Houses for sale in Wisbech, Norfolk
House Prices in Wisbech
Properties in Wisbech have an average house price of £286k and had 647 Property Transactions within the last 3 years.¹
Wisbech is an area in Norfolk with 7,178 households², where the most expensive property was sold for £800k.
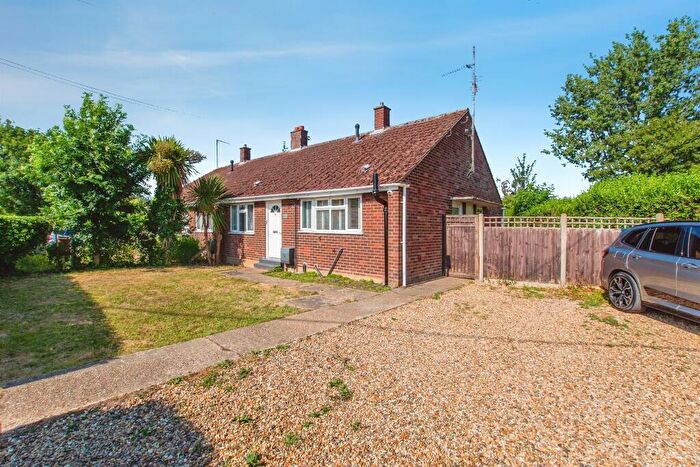
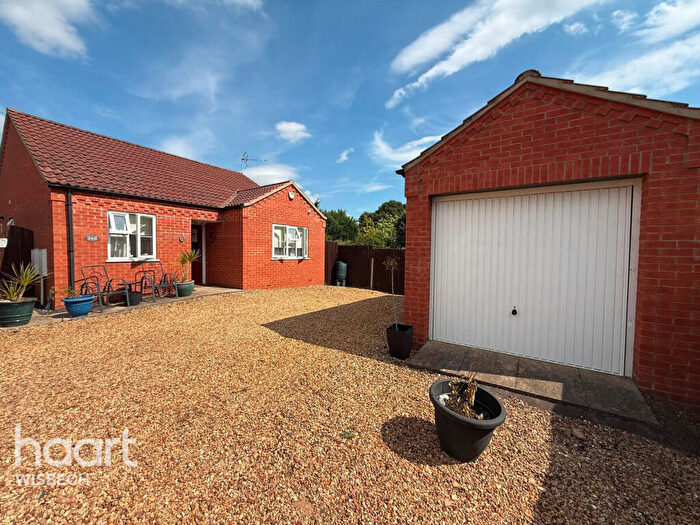
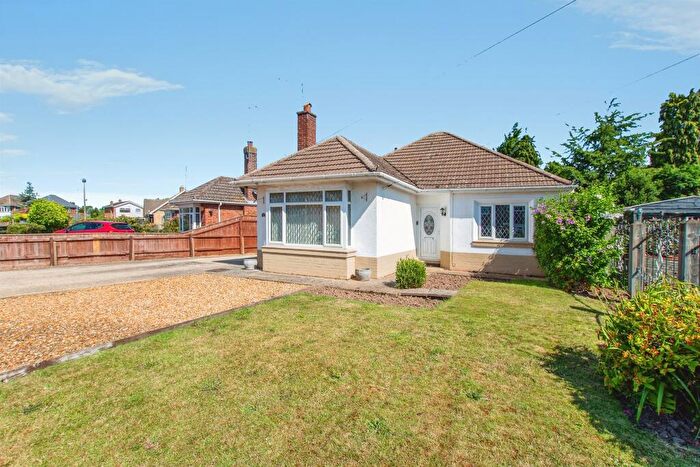
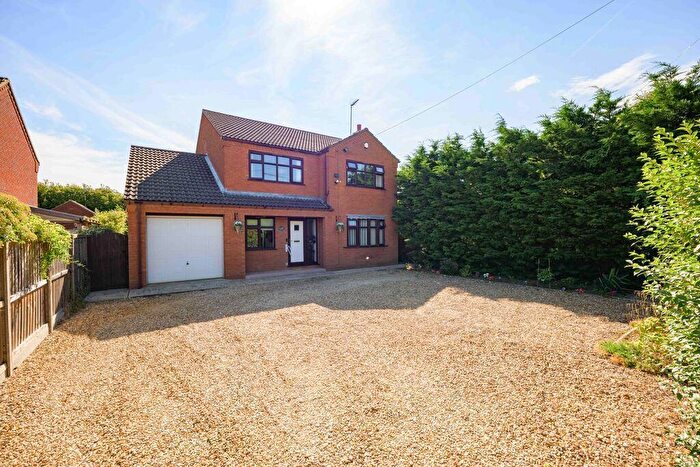
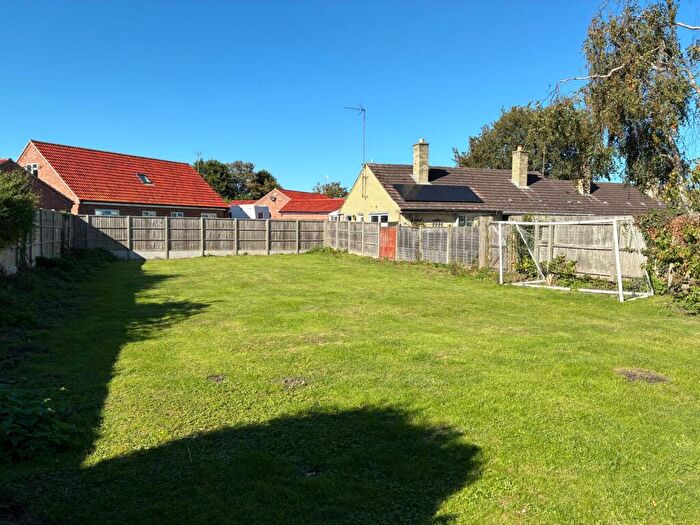
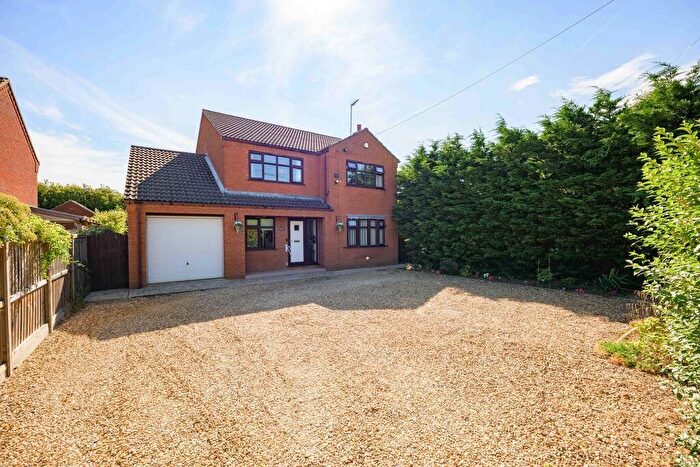
Properties for sale in Wisbech
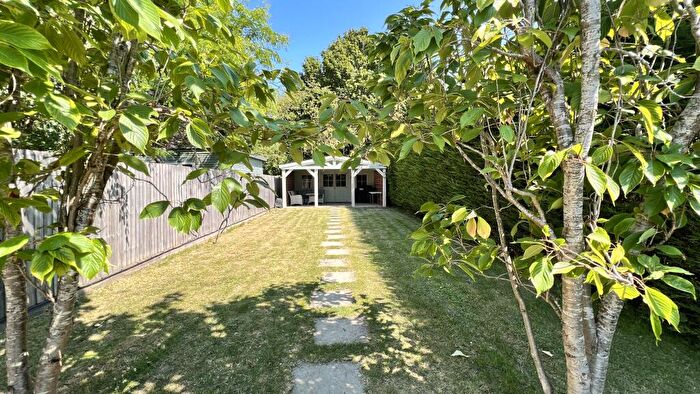
![]()
If you are looking to sell your house, let it out, or receive a property valuation, an expert can help you.
Click the button below to get started.


Neighbourhoods in Wisbech
Navigate through our locations to find the location of your next house in Wisbech, Norfolk for sale or to rent.
Property price trends in Wisbech
According to the latest Land Registry data, the average home in Wisbech sold for £317,550 in 2026. That figure comes from a substantial record of 9,038 sales logged over the past 31 years.
Prices have continued to climb over the last three years. Compared with 2023, when the typical sale came in around £286,457, that's a rise of roughly 10.9%.
Looking back five years, average prices are up about 10.5% since 2021, a gain of around £30,217 in cash terms.
Zoom out to the past decade for the fuller picture. Back in 2016, homes here averaged £199,504, so the typical sold price has climbed about 59.2% since then, roughly 4.8% a year. Stretch the view to fifteen years and that annual pace holds at about 4.8%.
Frequently asked questions about Wisbech
What is the average price for a property for sale in Wisbech?
The average price for a property for sale in Wisbech is £286,006. This amount is 4% lower than the average price in Norfolk. There are more than 10,000 property listings for sale in Wisbech.
What locations have the most expensive properties for sale in Wisbech?
The locations with the most expensive properties for sale in Wisbech are Emneth & Outwell at an average of £470,000, Upwell & Delph at an average of £437,277 and Walsoken, West Walton & Walpole at an average of £332,000.
What locations have the most affordable properties for sale in Wisbech?
The locations with the most affordable properties for sale in Wisbech are Emneth With Outwell at an average of £255,743, Upwell And Delph at an average of £263,382 and St Lawrence at an average of £276,777.
Which train stations are available in or near Wisbech?
Some of the train stations available in or near Wisbech are Downham Market, Watlington and March.
Property Price Paid in Wisbech by Year
The average sold property price by year was:
| Year | Average Sold Price | Price Change |
Sold Properties
|
|---|---|---|---|
| 2026 | £317,550 | 10% |
10 Properties |
| 2025 | £284,334 | -1% |
212 Properties |
| 2024 | £285,775 | -0,2% |
224 Properties |
| 2023 | £286,457 | -14% |
201 Properties |
| 2022 | £327,084 | 12% |
304 Properties |
| 2021 | £287,333 | 12% |
396 Properties |
| 2020 | £254,200 | 2% |
257 Properties |
| 2019 | £249,565 | 8% |
285 Properties |
| 2018 | £230,655 | 7% |
279 Properties |
| 2017 | £215,268 | 7% |
308 Properties |
Property Price per Property Type in Wisbech
Here you can find historic sold price data in order to help with your property search.
The average Property Paid Price for specific property types in the last three years are:
| Property Type | Average Sold Price | Sold Properties |
|---|---|---|
| Semi Detached House | £214,197.00 | 188 Semi Detached Houses |
| Detached House | £333,175.00 | 412 Detached Houses |
| Terraced House | £168,375.00 | 42 Terraced Houses |
| Flat | £87,400.00 | 5 Flats |
Transport in Wisbech
Please see below transportation links in this area:
