Houses for sale & to rent in Ferry, Immingham
House Prices in Ferry
Properties in Ferry have an average house price of £190,656.00 and had 86 Property Transactions within the last 3 years¹.
Ferry is an area in Immingham, North Lincolnshire with 861 households², where the most expensive property was sold for £750,000.00.
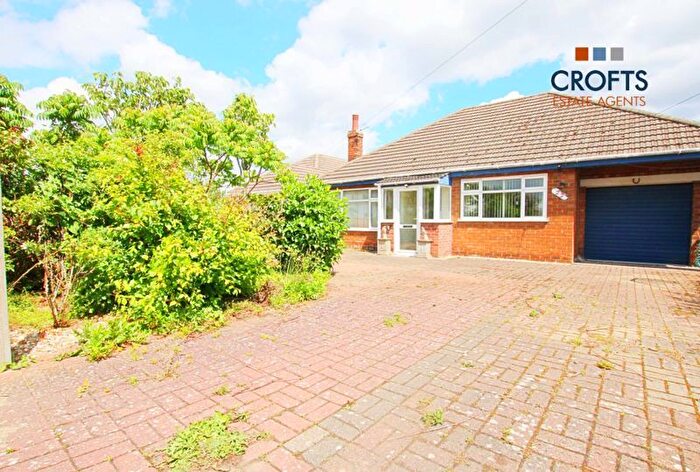
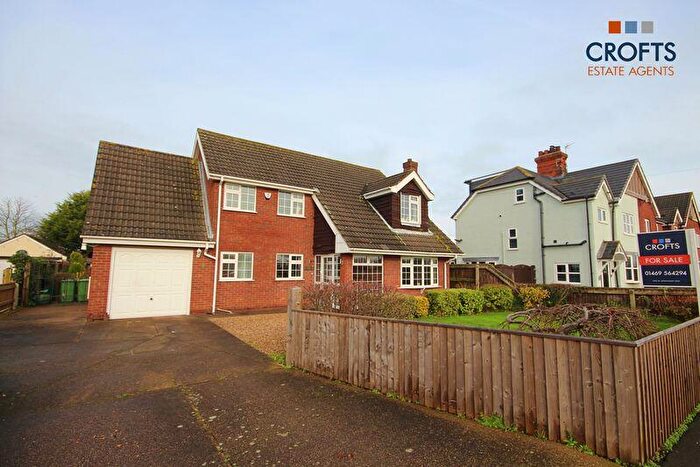
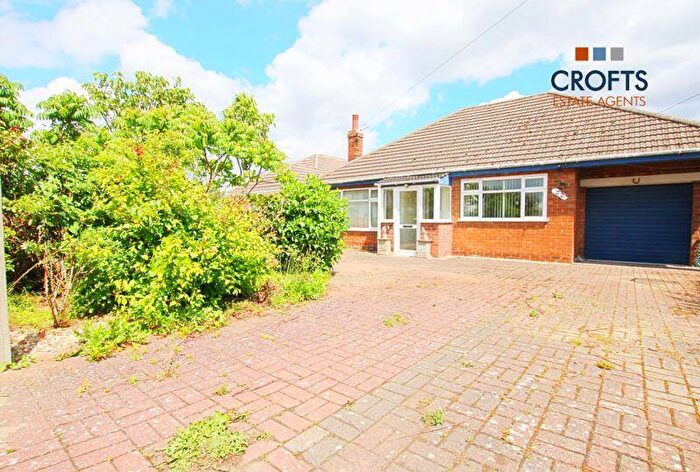
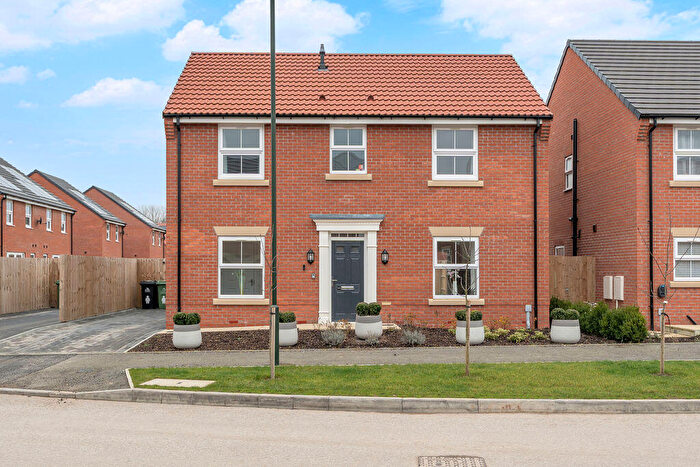
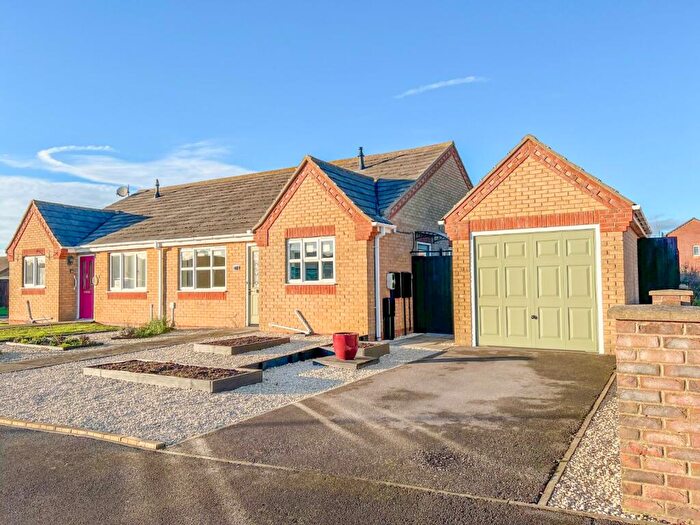
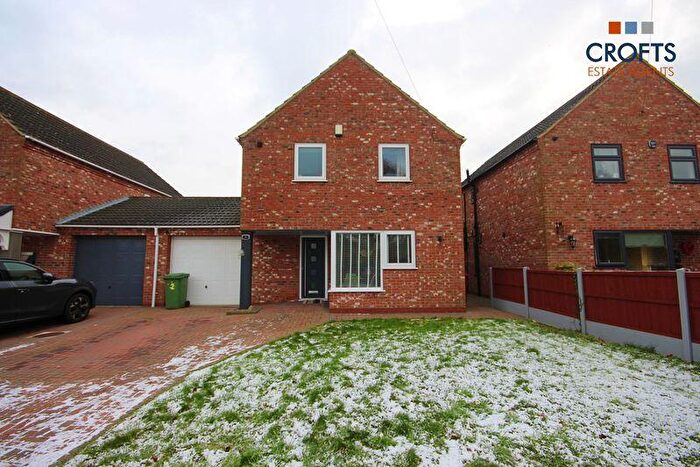
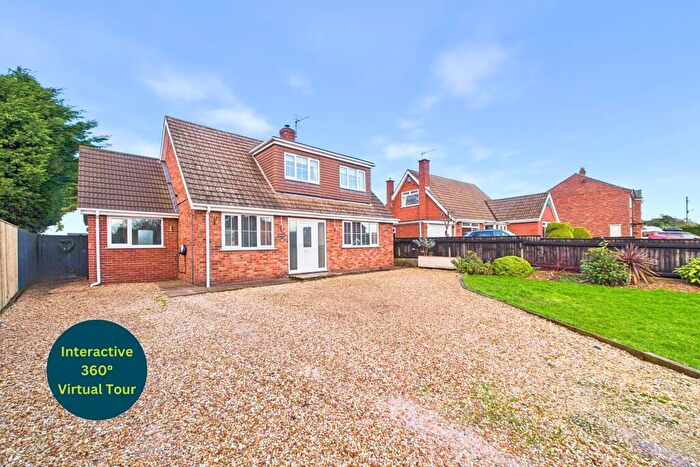
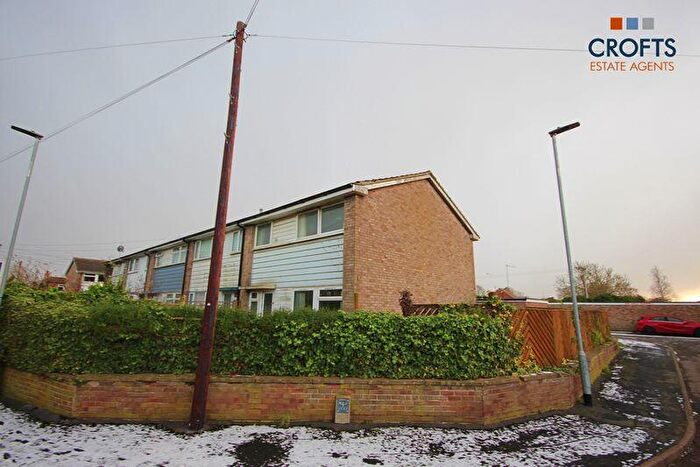
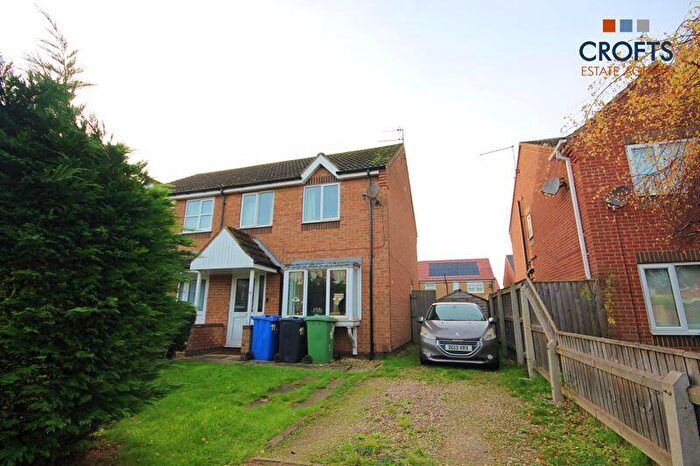
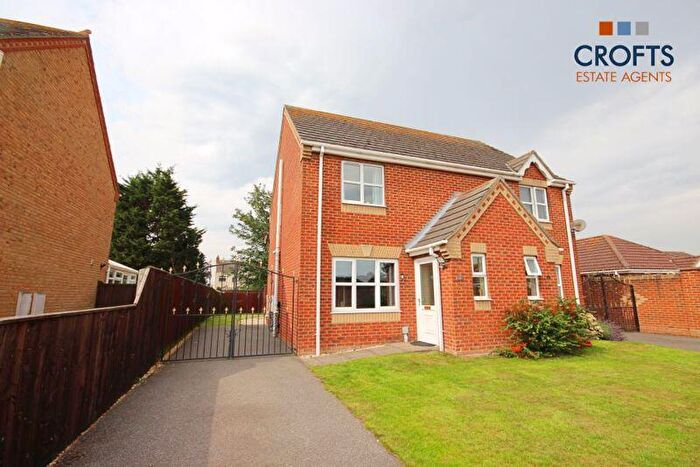
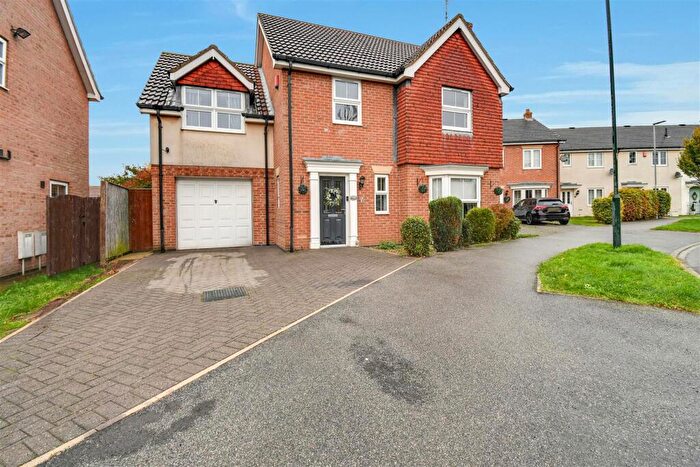
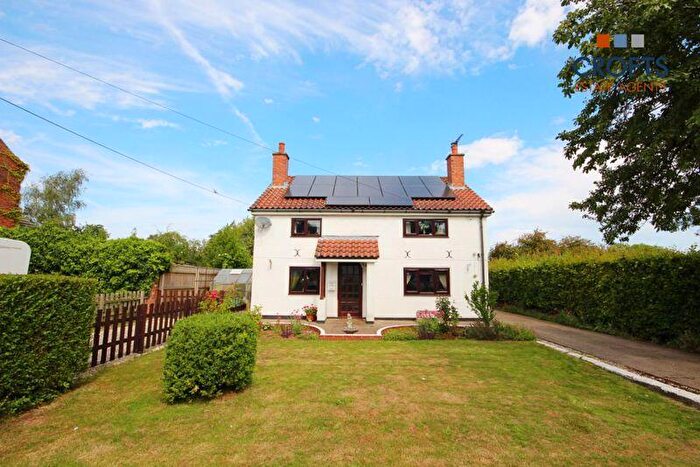
Properties for sale in Ferry
Roads and Postcodes in Ferry
Navigate through our locations to find the location of your next house in Ferry, Immingham for sale or to rent.
| Streets | Postcodes |
|---|---|
| Abbey View | DN40 3QB |
| Ashleigh Terrace | DN40 3NP |
| Baptist Chapel Lane | DN40 3DE |
| Baysgarth | DN40 3NU |
| Briar Close | DN40 3HH |
| Brick Lane | DN40 3PA |
| Celandine Close | DN40 3HP |
| Chase Hill Lane | DN40 3PD |
| Chase Hill Road | DN40 3LU DN40 3PB |
| Church End | DN40 3NX |
| Church Lane | DN40 3JJ DN40 3JH |
| Clarkes Road | DN40 3JQ |
| Clough Lane | DN40 3JP DN40 3JS |
| College Road | DN40 3PJ DN40 3PL DN40 3PN DN40 3PW |
| Crookmill Road | DN40 3QD |
| Eastfield Road | DN40 3DQ DN40 3DR DN40 3DW DN40 3LJ DN40 3LW DN40 3NF |
| Farben Villas | DN40 3EW |
| Faulding Lane | DN40 3EE |
| Garden Village | DN40 3JR |
| Greengate Lane | DN40 3EZ DN40 3HB DN40 3HD DN40 3HE |
| Habrough Court | DN40 3HZ |
| Habrough Road | DN40 3QG |
| Haven Road | DN40 3LA |
| Hawkins Way | DN40 3HQ |
| Hewitts Row | DN40 3ET |
| Humber Road | DN40 3BY DN40 3DJ DN40 3DS DN40 3DU DN40 3LZ |
| Jericho Lane | DN40 3PZ |
| Kettlebridge Lane | DN40 3PP DN40 3PR |
| Killingholme Airfield | DN40 3JY |
| King Street | DN40 3PY |
| Lancaster Approach | DN40 3JZ |
| Lancaster Drive | DN40 3HA DN40 3HL |
| Lease Lane | DN40 3PT |
| Manby Road | DN40 3DX |
| Marsh Lane | DN40 3EA |
| Mayfield Avenue | DN40 3DF |
| Mayfield Terrace | DN40 3NW |
| Mayflower Close | DN40 3HF DN40 3HG |
| Mill Lane | DN40 3QA |
| Moat Lane | DN40 3EU |
| Orchid Close | DN40 3HW |
| Pilgrims Close | DN40 3HU |
| Primitive Chapel Lane | DN40 3BU |
| Rosper Road | DN40 3DZ |
| School Road | DN40 3HS DN40 3HT DN40 3HX DN40 3HY |
| Scrub Lane | DN40 3NT |
| Skitter Road | DN40 3PX |
| St Crispin Close | DN40 3JN |
| St Denys Close | DN40 3EX DN40 3EY |
| Staple Road | DN40 3ER |
| Station Road | DN40 3PU DN40 3ED |
| Swinster Lane | DN40 3NR |
| Top Road | DN40 3JD DN40 3JF DN40 3JU DN40 3JE |
| Town Street | DN40 3BT DN40 3BZ DN40 3DA DN40 3DD DN40 3EP DN40 3HR DN40 3BS DN40 3EL DN40 3EN |
| Townside | DN40 3NL DN40 3NS DN40 3PS |
| Ulceby Road | DN40 3JA DN40 3JB |
| Vicarage Lane | DN40 3JL |
| Warren Farm Close | DN40 3QE |
| Wellington Close | DN40 3HN |
| Woods Lane | DN40 3DB |
| DN40 3DG DN40 3JW DN40 3JX DN40 3LX |
Transport near Ferry
- FAQ
- Price Paid By Year
- Property Type Price
Frequently asked questions about Ferry
What is the average price for a property for sale in Ferry?
The average price for a property for sale in Ferry is £190,656. There are 437 property listings for sale in Ferry.
What streets have the most expensive properties for sale in Ferry?
The streets with the most expensive properties for sale in Ferry are Station Road at an average of £478,750, Mill Lane at an average of £470,000 and Vicarage Lane at an average of £335,000.
What streets have the most affordable properties for sale in Ferry?
The streets with the most affordable properties for sale in Ferry are Baptist Chapel Lane at an average of £50,000, Mayfield Avenue at an average of £64,000 and Hewitts Row at an average of £76,000.
Which train stations are available in or near Ferry?
Some of the train stations available in or near Ferry are Ulceby, Habrough and Thornton Abbey.
Property Price Paid in Ferry by Year
The average sold property price by year was:
| Year | Average Sold Price | Price Change |
Sold Properties
|
|---|---|---|---|
| 2025 | £205,628 | 13% |
19 Properties |
| 2024 | £179,870 | -8% |
37 Properties |
| 2023 | £194,476 | 15% |
30 Properties |
| 2022 | £164,786 | 17% |
42 Properties |
| 2021 | £136,875 | -8% |
37 Properties |
| 2020 | £148,117 | 4% |
32 Properties |
| 2019 | £142,483 | 12% |
31 Properties |
| 2018 | £125,152 | -15% |
41 Properties |
| 2017 | £144,238 | 8% |
31 Properties |
| 2016 | £133,269 | 7% |
33 Properties |
| 2015 | £123,822 | 5% |
34 Properties |
| 2014 | £117,583 | 11% |
24 Properties |
| 2013 | £104,090 | 7% |
27 Properties |
| 2012 | £96,372 | -15% |
20 Properties |
| 2011 | £111,069 | -34% |
34 Properties |
| 2010 | £149,231 | 21% |
19 Properties |
| 2009 | £117,150 | -6% |
15 Properties |
| 2008 | £123,630 | 4% |
21 Properties |
| 2007 | £119,284 | 3% |
60 Properties |
| 2006 | £115,727 | 2% |
56 Properties |
| 2005 | £112,982 | 12% |
45 Properties |
| 2004 | £99,826 | 20% |
56 Properties |
| 2003 | £80,276 | 15% |
37 Properties |
| 2002 | £68,301 | 31% |
47 Properties |
| 2001 | £46,871 | -9% |
47 Properties |
| 2000 | £51,182 | 23% |
31 Properties |
| 1999 | £39,315 | -2% |
20 Properties |
| 1998 | £40,187 | -35% |
39 Properties |
| 1997 | £54,439 | 18% |
28 Properties |
| 1996 | £44,747 | 13% |
18 Properties |
| 1995 | £38,863 | - |
27 Properties |
Property Price per Property Type in Ferry
Here you can find historic sold price data in order to help with your property search.
The average Property Paid Price for specific property types in the last three years are:
| Property Type | Average Sold Price | Sold Properties |
|---|---|---|
| Semi Detached House | £136,083.00 | 33 Semi Detached Houses |
| Detached House | £246,550.00 | 44 Detached Houses |
| Terraced House | £117,500.00 | 9 Terraced Houses |

