
Houses for sale & to rent in Ferry, Ulceby
House Prices in Ferry
Properties in Ferry have an average house price of £221k and had 125 Property Transactions within the last 3 years¹.
Ferry is an area in Ulceby, North Lincolnshire with 1,207 households², where the most expensive property was sold for £530k.
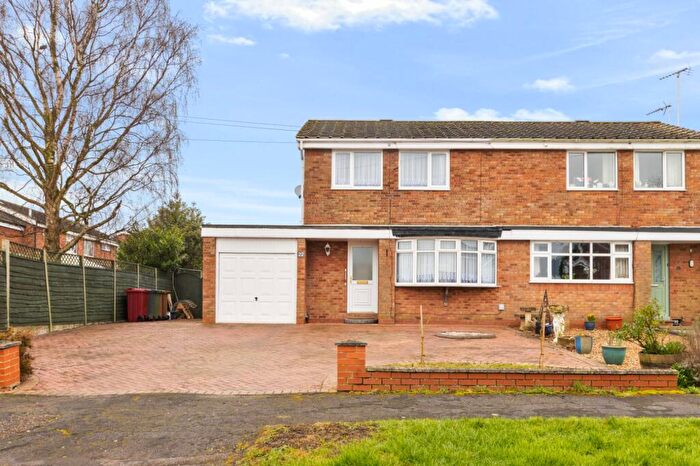
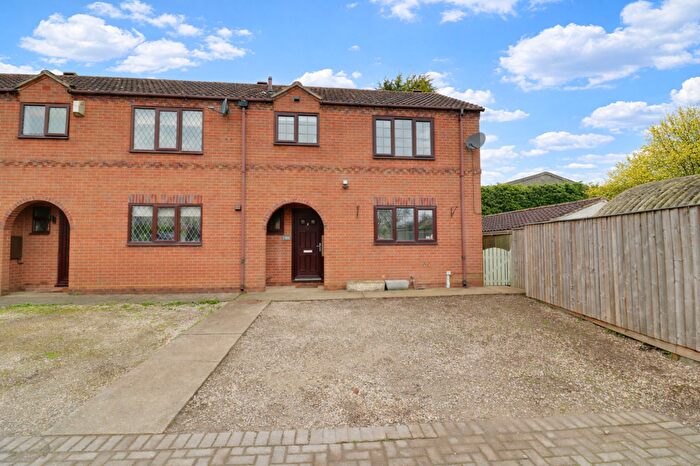
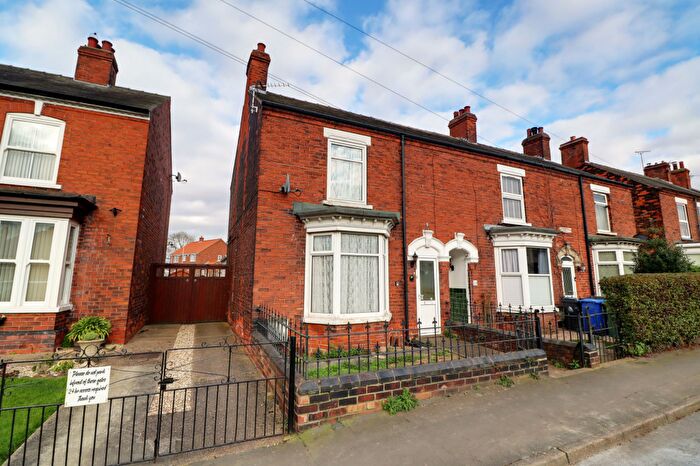
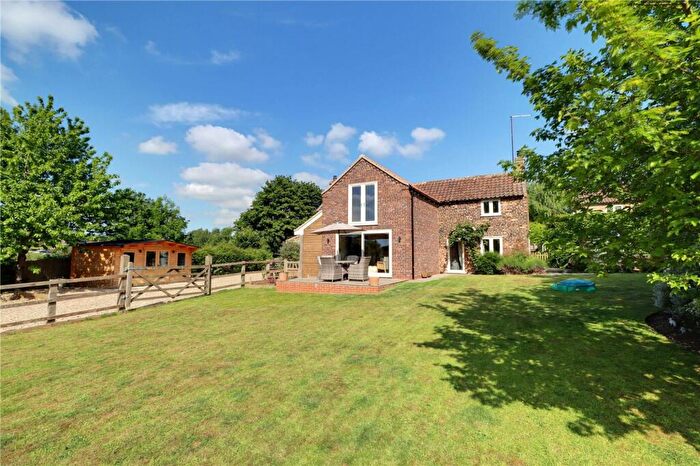
Properties for sale in Ferry
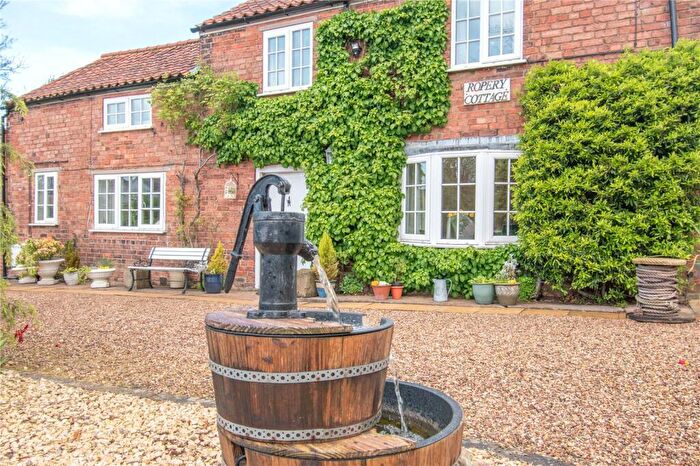
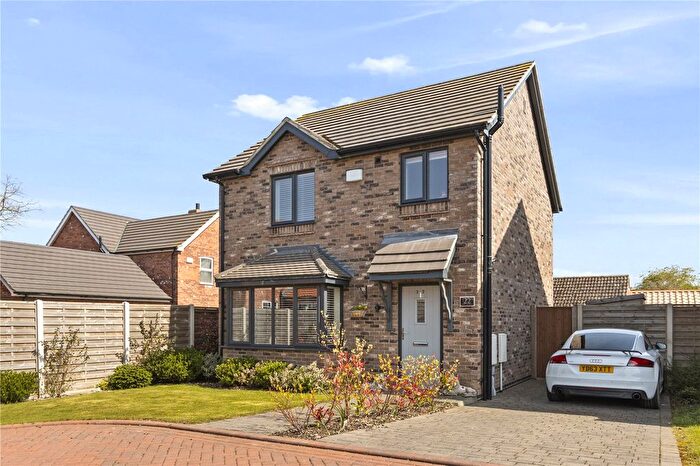
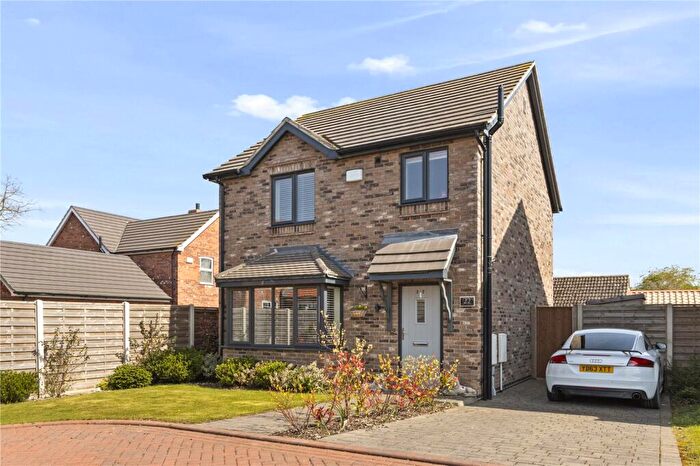
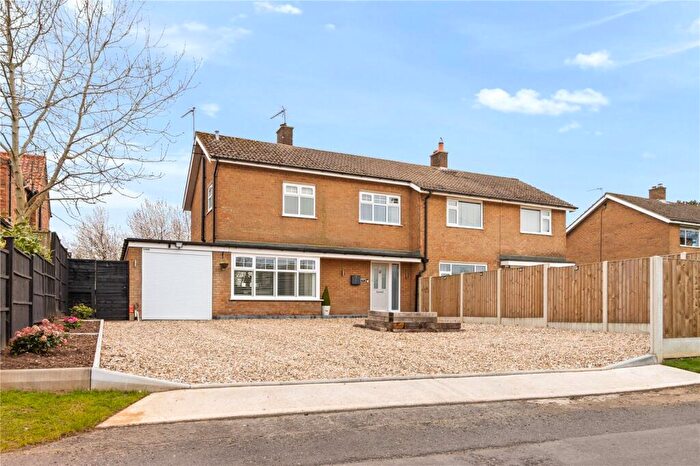
![]()
If you are looking to sell your house, let it out, or receive a property valuation, an expert can help you.
Click the button below to get started.
Roads and Postcodes in Ferry
Navigate through our locations to find the location of your next house in Ferry, Ulceby for sale or to rent.
| Streets | Postcodes |
|---|---|
| Abbey Road | DN39 6TJ |
| Abbots Way | DN39 6TL |
| Advent Court | DN39 6UW |
| Barton Road | DN39 6RN |
| Brocklesby Park | DN39 6YF |
| Brocklesby Road | DN39 6GU DN39 6ST DN39 6SU |
| Burnham Lane | DN39 6XH |
| Caistor Road | DN39 6YG |
| Cherry Lane | DN39 6RL |
| Church Lane | DN39 6TB |
| College Road | DN39 6TU |
| Coronation Road | DN39 6SX |
| Crookmill Road | DN39 6AG |
| Cross Road | DN39 6TR |
| Croxton Road | DN39 6RQ DN39 6YL |
| Dam Lane | DN39 6XN |
| Earl Close | DN39 6US |
| East End | DN39 6YS |
| East Grove | DN39 6SA |
| Fields End | DN39 6UT |
| Forge Crescent | DN39 6RY |
| Fortyfoot Lane | DN39 6YJ |
| Franklin Way | DN39 6AB |
| Friars Gate | DN39 6TQ |
| Front Street | DN39 6SY |
| Gordon Villas | DN39 6TX |
| Gower Close | DN39 6AD |
| Goxhill Road | DN39 6XL |
| Gravel Pit Lane | DN39 6YU DN39 6YX |
| Grimsby Road | DN39 6YH DN39 6YQ |
| Habrough Lane | DN39 6FA |
| Hallcroft | DN39 6SZ |
| Hawthorn Close | DN39 6RB |
| High Street | DN39 6RP DN39 6RR DN39 6RW DN39 6SG DN39 6TG DN39 6YY DN39 6YZ |
| James Place | DN39 6UG |
| Killingholme Road | DN39 6TZ |
| Laurel Lane | DN39 6XJ |
| Limber Road | DN39 6YB DN39 6YP |
| Little Farm Close | DN39 6GW |
| Main Street | DN39 6XW DN39 6YW |
| Martins Road | DN39 6UB |
| Meadow Avenue | DN39 6TH |
| Model Farm Lane | DN39 6GA |
| Mount Royale Close | DN39 6RX |
| Nelthorpe Close | DN39 6FB |
| New Row | DN39 6TY |
| Occupation Lane | DN39 6SL |
| Orchard Lane | DN39 6YA |
| Parks Close | DN39 6SN |
| Pitmoor Lane | DN39 6SW |
| Pond Side | DN39 6SD DN39 6SF |
| Post Office Lane | DN39 6YT |
| Priory Crescent | DN39 6TS |
| Race Lane | DN39 6RF |
| Ransome Court | DN39 6YN |
| Sackville Close | DN39 6RS |
| Schiphol Way | DN39 6GB DN39 6HB |
| School Mews | DN39 6AF |
| Southfield Close | DN39 6UN |
| Spruce Lane | DN39 6UH DN39 6UJ DN39 6UL |
| Station Road | DN39 6TT DN39 6UA DN39 6UQ DN39 6XF DN39 6UF DN39 6XA |
| Stephen Close | DN39 6SP |
| Swallow Lane | DN39 6SB |
| The Paddock | DN39 6XS |
| Thornton Lane | DN39 6SR |
| Thornton Road | DN39 6SJ DN39 6XR |
| Ulceby Chase | DN39 6YE |
| Ulceby Road | DN39 6SE |
| Vicarage Lane | DN39 6SH |
| Walkers Way | DN39 6UD |
| West End Road | DN39 6TE |
| Williams Drive | DN39 6UE |
| Willow Close | DN39 6UR |
| Wold Road | DN39 6RG |
| Wootton Road | DN39 6TD DN39 6XU DN39 6XT |
| Worsley Paddock | DN39 6UU |
| Wudaton Court | DN39 6SQ |
| Yarborough Court | DN39 6RZ |
| DN39 6YD DN39 6AA DN39 6UX |
Transport near Ferry

- FAQ
- Price Paid By Year
- Property Type Price
Frequently asked questions about Ferry
What is the average price for a property for sale in Ferry?
The average price for a property for sale in Ferry is £220,999. There are 812 property listings for sale in Ferry.
What streets have the most expensive properties for sale in Ferry?
The streets with the most expensive properties for sale in Ferry are Southfield Close at an average of £378,000, West End Road at an average of £356,000 and Nelthorpe Close at an average of £342,500.
What streets have the most affordable properties for sale in Ferry?
The streets with the most affordable properties for sale in Ferry are Occupation Lane at an average of £48,500, Williams Drive at an average of £95,000 and New Row at an average of £115,000.
Which train stations are available in or near Ferry?
Some of the train stations available in or near Ferry are Ulceby, Thornton Abbey and Habrough.
Property Price Paid in Ferry by Year
The average sold property price by year was:
| Year | Average Sold Price | Price Change |
Sold Properties
|
|---|---|---|---|
| 2025 | £217,417 | -11% |
42 Properties |
| 2024 | £241,637 | 15% |
39 Properties |
| 2023 | £206,125 | -19% |
44 Properties |
| 2022 | £245,228 | -1% |
49 Properties |
| 2021 | £248,525 | 3% |
54 Properties |
| 2020 | £240,003 | 24% |
43 Properties |
| 2019 | £183,530 | 8% |
60 Properties |
| 2018 | £168,189 | -13% |
47 Properties |
| 2017 | £190,496 | 13% |
65 Properties |
| 2016 | £165,137 | -2% |
43 Properties |
| 2015 | £167,911 | 11% |
34 Properties |
| 2014 | £149,601 | 1% |
42 Properties |
| 2013 | £147,491 | 7% |
42 Properties |
| 2012 | £137,338 | 5% |
34 Properties |
| 2011 | £129,991 | -22% |
35 Properties |
| 2010 | £158,852 | -13% |
18 Properties |
| 2009 | £179,995 | 7% |
24 Properties |
| 2008 | £166,957 | -1% |
44 Properties |
| 2007 | £168,068 | 4% |
88 Properties |
| 2006 | £161,657 | 21% |
53 Properties |
| 2005 | £127,506 | -6% |
43 Properties |
| 2004 | £134,829 | 14% |
61 Properties |
| 2003 | £116,235 | 23% |
76 Properties |
| 2002 | £89,327 | 23% |
74 Properties |
| 2001 | £68,745 | 8% |
66 Properties |
| 2000 | £63,306 | 20% |
53 Properties |
| 1999 | £50,898 | -21% |
44 Properties |
| 1998 | £61,405 | 10% |
50 Properties |
| 1997 | £55,122 | 9% |
64 Properties |
| 1996 | £50,010 | - |
35 Properties |
| 1995 | £50,005 | - |
45 Properties |
Property Price per Property Type in Ferry
Here you can find historic sold price data in order to help with your property search.
The average Property Paid Price for specific property types in the last three years are:
| Property Type | Average Sold Price | Sold Properties |
|---|---|---|
| Semi Detached House | £168,009.00 | 50 Semi Detached Houses |
| Detached House | £300,436.00 | 56 Detached Houses |
| Terraced House | £126,318.00 | 19 Terraced Houses |