
Houses for sale in Weston-super-mare, North Somerset
House Prices in Weston-super-mare
Properties in Weston-super-mare have an average house price of £267k and had 4,874 Property Transactions within the last 3 years.¹
Weston-super-mare is an area in North Somerset with 43,423 households², where the most expensive property was sold for £1.1M.
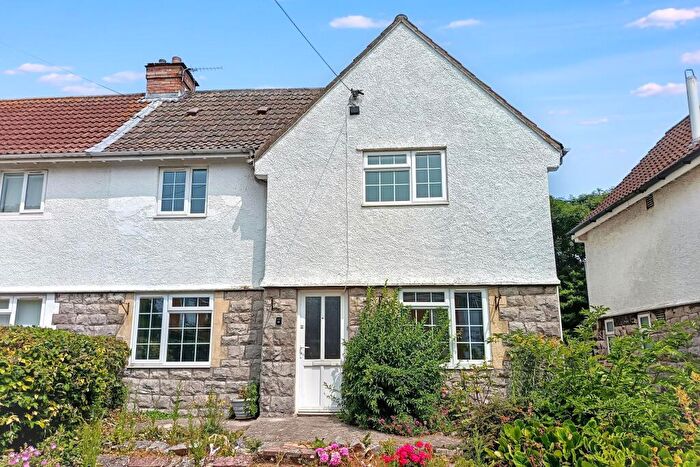
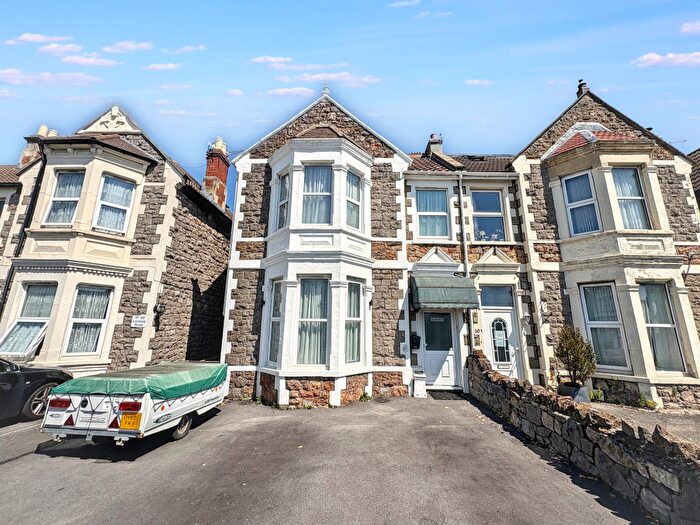
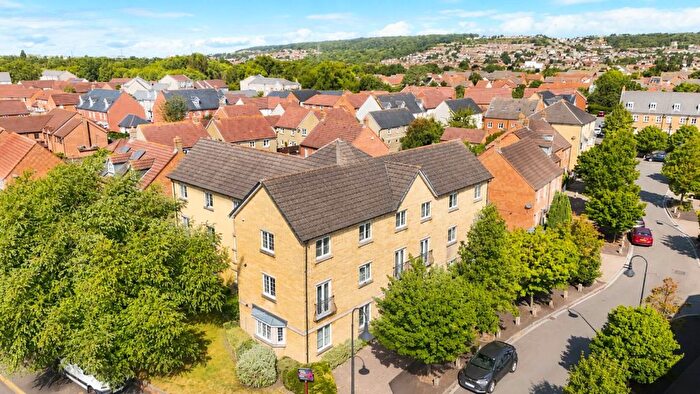
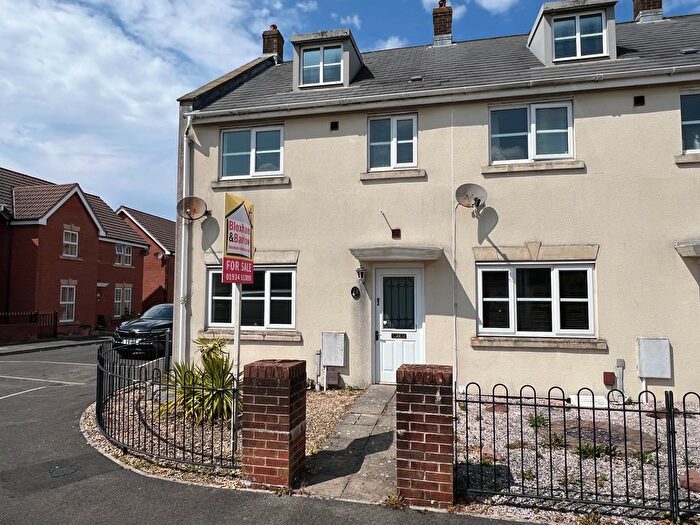
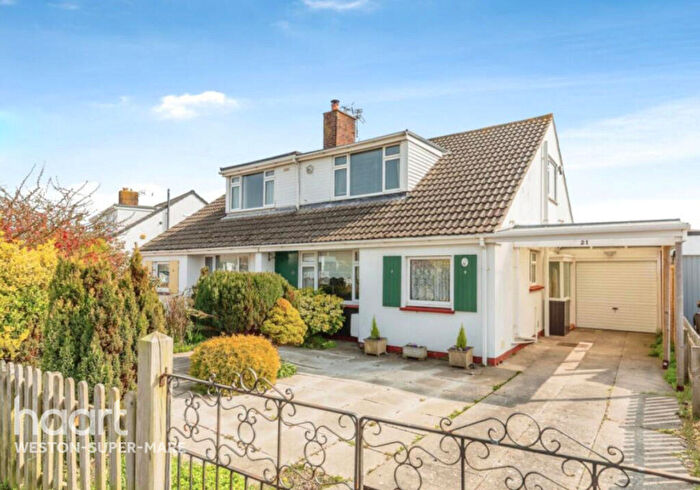
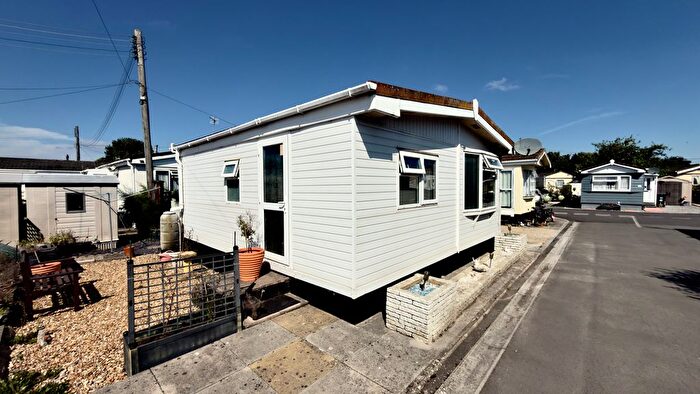
Properties for sale in Weston-super-mare
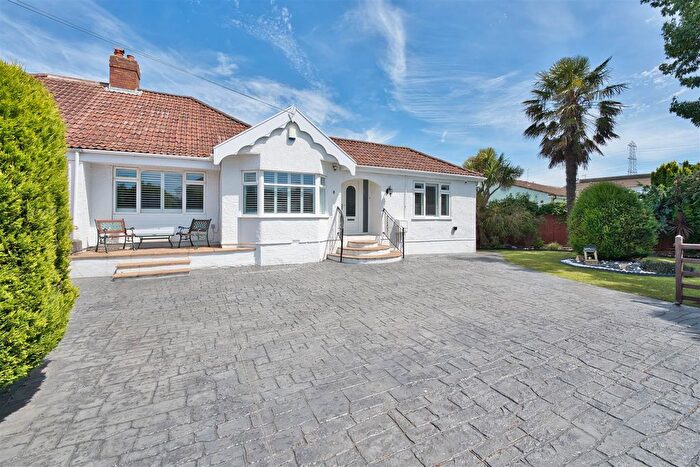
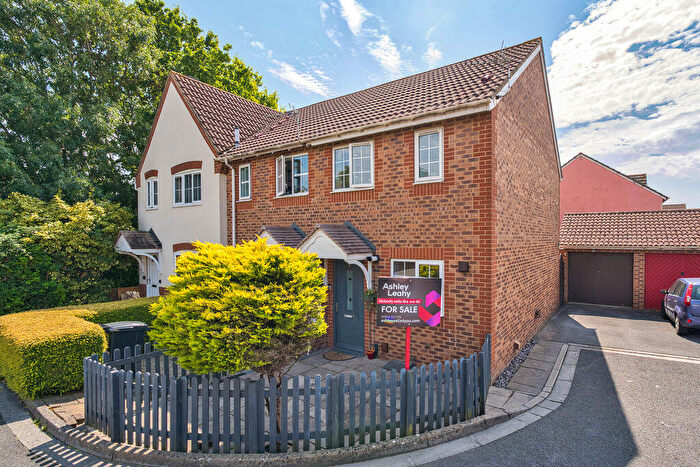
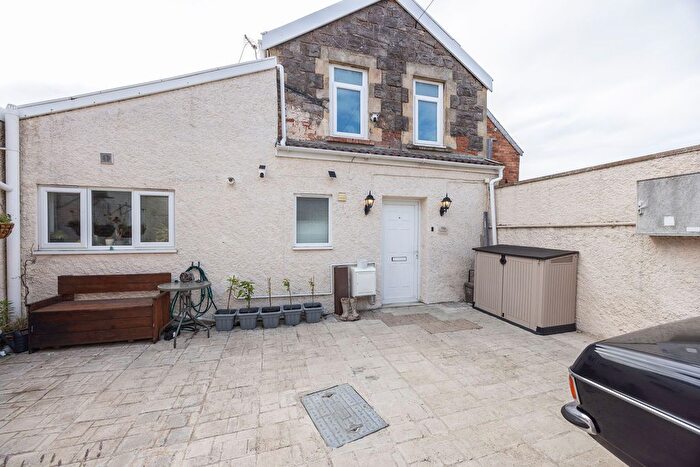
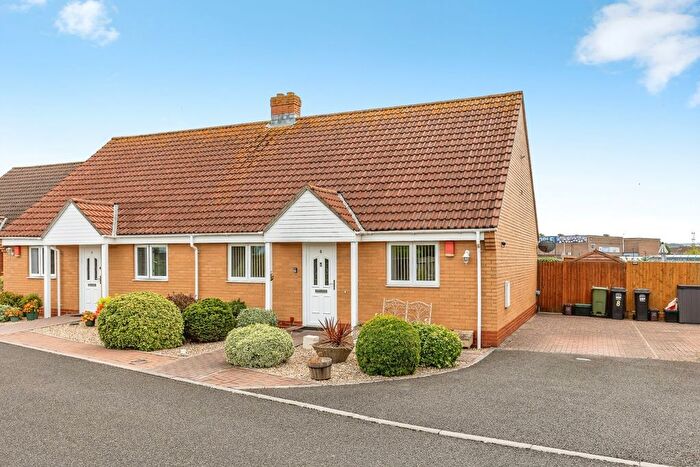
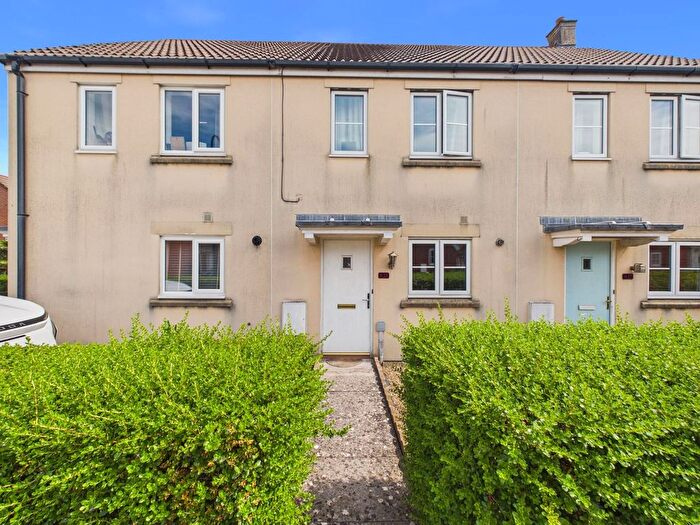
![]()
If you are looking to sell your house, let it out, or receive a property valuation, an expert can help you.
Click the button below to get started.


Neighbourhoods in Weston-super-mare
Navigate through our locations to find the location of your next house in Weston-super-mare, North Somerset for sale or to rent.
- Banwell And Winscombe
- Congresbury
- Hutton And Locking
- Kewstoke
- Weston-super-mare Central
- Weston-super-mare Clarence And Uphill
- Weston-super-mare East
- Weston-super-mare Milton And Old Worle
- Weston-super-mare North Worle
- Weston-super-mare South
- Weston-super-mare South Worle
- Weston-super-mare West
- Weston-super-Mare Mid Worle
- Weston-super-Mare Kewstoke
- Wick St Lawrence & St Georges
- Weston-super-Mare Hillside
- Weston-super-Mare Milton
- Weston-super-Mare Winterstoke
- Weston-super-Mare Uphill
- Hutton & Locking
- Congresbury & Puxton
- Banwell & Winscombe
Property price trends in Weston-super-mare
According to the latest Land Registry data, the average home in Weston-super-mare sold for £281,484 in 2026. That figure comes from a substantial record of 65,689 sales logged over the past 31 years.
Prices have continued to climb over the last three years. Compared with 2023, when the typical sale came in around £260,311, that's a rise of roughly 8.1%.
Looking back five years, average prices are up about 12.5% since 2021, a gain of around £31,306 in cash terms.
Zoom out to the past decade for the fuller picture. Back in 2016, homes here averaged £193,575, so the typical sold price has climbed about 45.4% since then, roughly 3.8% a year. Stretch the view to fifteen years and that annual pace eases back to about 3.5%.
Frequently asked questions about Weston-super-mare
What is the average price for a property for sale in Weston-super-mare?
The average price for a property for sale in Weston-super-mare is £267,107. This amount is 25% lower than the average price in North Somerset. There are more than 10,000 property listings for sale in Weston-super-mare.
What locations have the most expensive properties for sale in Weston-super-mare?
The locations with the most expensive properties for sale in Weston-super-mare are Kewstoke at an average of £380,084, Hutton And Locking at an average of £331,934 and Weston-super-mare Milton And Old Worle at an average of £314,555.
What locations have the most affordable properties for sale in Weston-super-mare?
The locations with the most affordable properties for sale in Weston-super-mare are Weston-super-Mare Mid Worle at an average of £115,462, Weston-super-mare Central at an average of £189,560 and Weston-super-mare South at an average of £195,497.
Which train stations are available in or near Weston-super-mare?
Some of the train stations available in or near Weston-super-mare are Weston Milton, Weston-Super-Mare and Worle.
Property Price Paid in Weston-super-mare by Year
The average sold property price by year was:
| Year | Average Sold Price | Price Change |
Sold Properties
|
|---|---|---|---|
| 2026 | £281,484 | 4% |
136 Properties |
| 2025 | £270,830 | 1% |
1,697 Properties |
| 2024 | £267,886 | 3% |
1,636 Properties |
| 2023 | £260,311 | -0,4% |
1,405 Properties |
| 2022 | £261,432 | 4% |
1,976 Properties |
| 2021 | £250,178 | 8% |
2,380 Properties |
| 2020 | £231,213 | 6% |
1,579 Properties |
| 2019 | £216,789 | 3% |
1,910 Properties |
| 2018 | £211,369 | 3% |
2,117 Properties |
| 2017 | £204,318 | 5% |
2,169 Properties |
Property Price per Property Type in Weston-super-mare
Here you can find historic sold price data in order to help with your property search.
The average Property Paid Price for specific property types in the last three years are:
| Property Type | Average Sold Price | Sold Properties |
|---|---|---|
| Semi Detached House | £284,371.00 | 1,388 Semi Detached Houses |
| Terraced House | £241,215.00 | 1,141 Terraced Houses |
| Detached House | £391,422.00 | 1,064 Detached Houses |
| Flat | £168,206.00 | 1,281 Flats |
Transport in Weston-super-mare
Please see below transportation links in this area:
