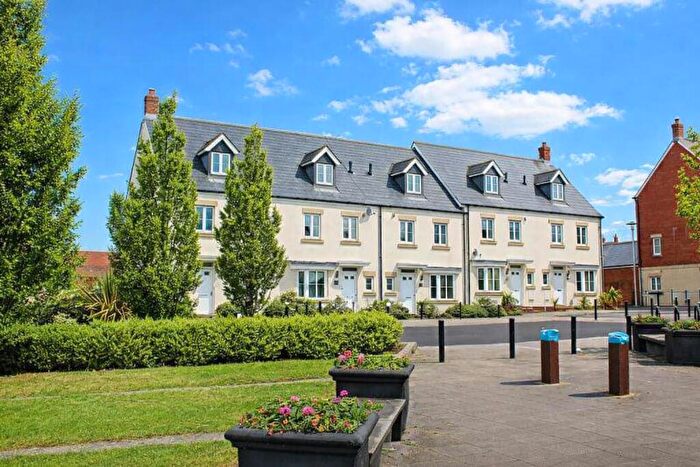
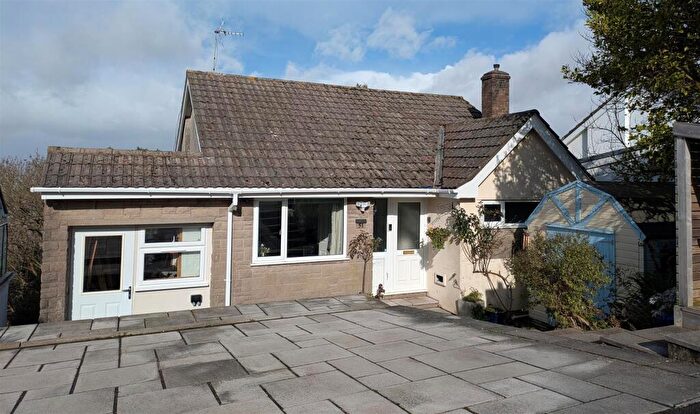
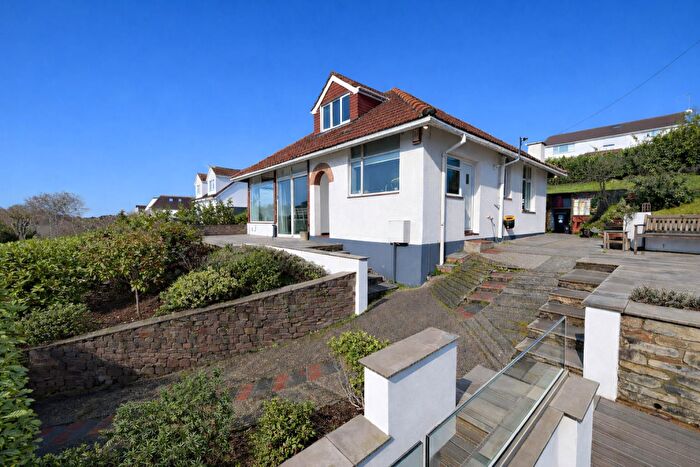
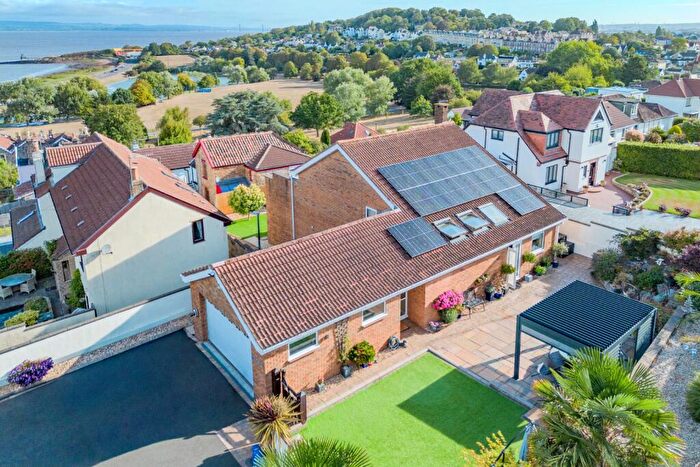
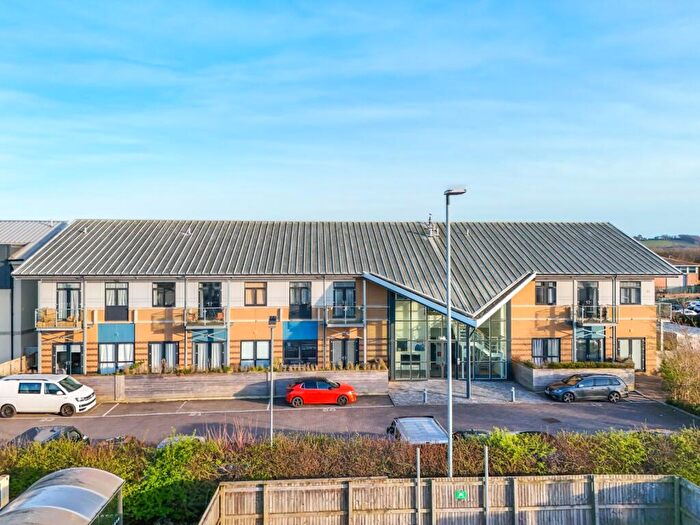
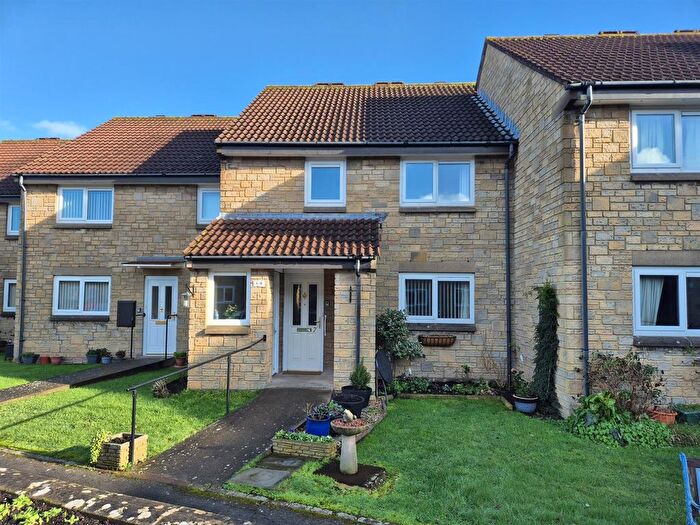
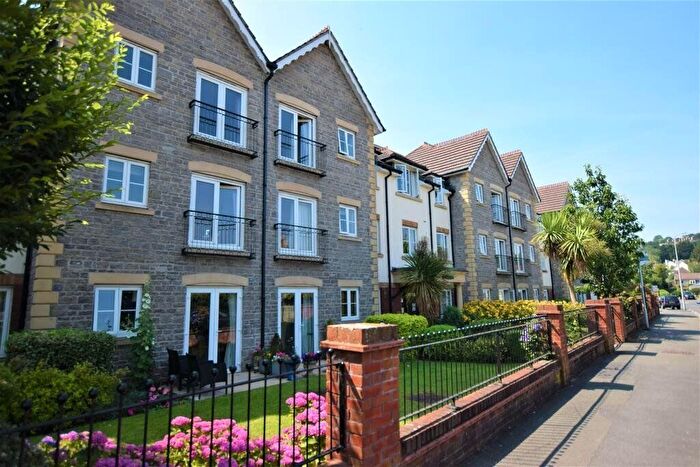
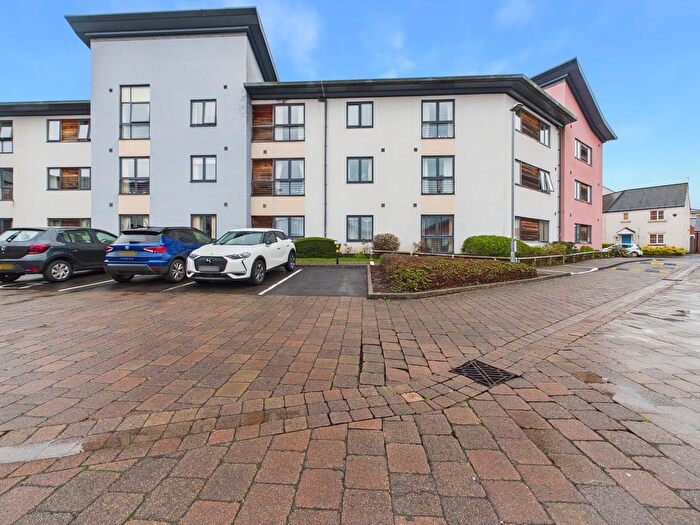
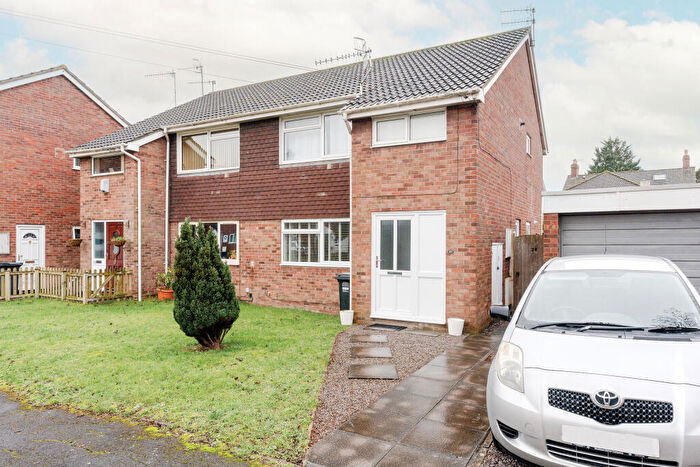
Houses for sale & to rent in Portishead Coast, Bristol
House Prices in Portishead Coast
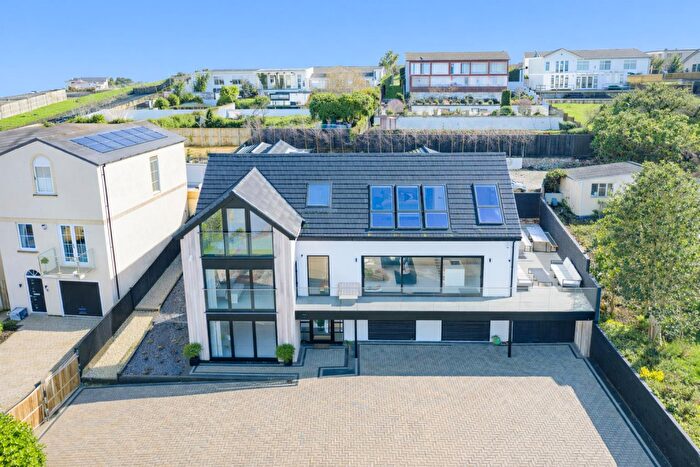
Properties in Portishead Coast have an average house price of £538,609.00 and had 113 Property Transactions within the last 3 years¹.
Portishead Coast is an area in Bristol, North Somerset with 1,170 households², where the most expensive property was sold for £2,400,000.00.
Properties for sale in Portishead Coast
Roads and Postcodes in Portishead Coast
Navigate through our locations to find the location of your next house in Portishead Coast, Bristol for sale or to rent.
| Streets | Postcodes |
|---|---|
| Admirals Walk | BS20 6LE |
| Ashdown Road | BS20 8DP |
| Battery Lane | BS20 7JD |
| Battery Road | BS20 7HP |
| Beach Hill | BS20 7HT |
| Beach Road East | BS20 7ES |
| Beach Road West | BS20 7HJ BS20 7HR BS20 7HU BS20 7HX BS20 7HY |
| Beechwood Drive | BS20 8ES |
| Beechwood Road | BS20 8EP BS20 8ER |
| Belton Road | BS20 8DR |
| Black Nore Point | BS20 8GB |
| Brackenwood Gardens | BS20 8FD |
| Cabot Rise | BS20 6NX |
| Chaplains Wood | BS20 8GA |
| Devonshire Drive | BS20 8EF |
| Drakes Way | BS20 6LB BS20 6LD BS20 6XA |
| Eastwood Place | BS20 7EE |
| Esplanade Road | BS20 7HB |
| Fircliff Park | BS20 7HQ |
| Frobisher Avenue | BS20 6XB |
| Frobisher Close | BS20 6NY |
| Gardner Road | BS20 7ER |
| Glenwood Rise | BS20 8EH |
| Lake Road | BS20 7JA |
| Leigh View Road | BS20 7EB BS20 7ED |
| Nichols Road | BS20 8DT |
| Nore Park Drive | BS20 8DY BS20 8EB |
| Nore Road | BS20 6JY BS20 6JZ BS20 7HN BS20 8DN BS20 8DU BS20 8DW BS20 8DX BS20 8EJ |
| Norewood Grove | BS20 8DL |
| Pier Road | BS20 7HG |
| Pinecroft | BS20 8ED |
| Raleigh Rise | BS20 6LA |
| Riverleaze | BS20 8EA |
| Rodmoor Road | BS20 7HZ BS20 7JE |
| Severnmead | BS20 8DZ |
| Somerset Road | BS20 8EE |
| South Road | BS20 7DU BS20 7DX BS20 7DY |
| South View | BS20 7DP |
| The Knoll | BS20 7NU |
| White Lodge Park | BS20 7HH |
| Wood Hill Park | BS20 7DR |
| Woodhill Avenue | BS20 7EX |
| Woodhill Road | BS20 7ET BS20 7EU BS20 7EY BS20 7EZ BS20 7HA BS20 7QW |
| Woodlands Road | BS20 7HE BS20 7HF |
Transport near Portishead Coast
- FAQ
- Price Paid By Year
- Property Type Price
Frequently asked questions about Portishead Coast
What is the average price for a property for sale in Portishead Coast?
The average price for a property for sale in Portishead Coast is £538,609. This amount is 18% higher than the average price in Bristol. There are 1,759 property listings for sale in Portishead Coast.
What streets have the most expensive properties for sale in Portishead Coast?
The streets with the most expensive properties for sale in Portishead Coast are Battery Lane at an average of £1,225,000, Beach Road West at an average of £1,015,375 and Beach Road East at an average of £780,000.
What streets have the most affordable properties for sale in Portishead Coast?
The streets with the most affordable properties for sale in Portishead Coast are Somerset Road at an average of £205,000, Devonshire Drive at an average of £222,666 and White Lodge Park at an average of £255,750.
Which train stations are available in or near Portishead Coast?
Some of the train stations available in or near Portishead Coast are Avonmouth, St.Andrew's Road and Shirehampton.
Property Price Paid in Portishead Coast by Year
The average sold property price by year was:
| Year | Average Sold Price | Price Change |
Sold Properties
|
|---|---|---|---|
| 2025 | £523,827 | 21% |
35 Properties |
| 2024 | £411,598 | -63% |
38 Properties |
| 2023 | £672,205 | 10% |
40 Properties |
| 2022 | £606,651 | 12% |
57 Properties |
| 2021 | £533,100 | 7% |
54 Properties |
| 2020 | £498,410 | 2% |
56 Properties |
| 2019 | £486,045 | 9% |
54 Properties |
| 2018 | £441,929 | -12% |
58 Properties |
| 2017 | £495,889 | 22% |
58 Properties |
| 2016 | £385,194 | -5% |
54 Properties |
| 2015 | £402,644 | 18% |
68 Properties |
| 2014 | £331,487 | 16% |
58 Properties |
| 2013 | £278,090 | -17% |
61 Properties |
| 2012 | £324,000 | 5% |
54 Properties |
| 2011 | £307,264 | 4% |
54 Properties |
| 2010 | £295,128 | 14% |
40 Properties |
| 2009 | £253,247 | -30% |
28 Properties |
| 2008 | £328,608 | 7% |
22 Properties |
| 2007 | £306,790 | 8% |
99 Properties |
| 2006 | £280,901 | 3% |
106 Properties |
| 2005 | £272,976 | -8% |
58 Properties |
| 2004 | £295,311 | 26% |
59 Properties |
| 2003 | £219,399 | -3% |
72 Properties |
| 2002 | £226,640 | 26% |
88 Properties |
| 2001 | £168,093 | 15% |
78 Properties |
| 2000 | £142,130 | 13% |
70 Properties |
| 1999 | £123,341 | 9% |
63 Properties |
| 1998 | £111,946 | 16% |
79 Properties |
| 1997 | £94,030 | 4% |
62 Properties |
| 1996 | £90,425 | 5% |
55 Properties |
| 1995 | £86,281 | - |
47 Properties |
Property Price per Property Type in Portishead Coast
Here you can find historic sold price data in order to help with your property search.
The average Property Paid Price for specific property types in the last three years are:
| Property Type | Average Sold Price | Sold Properties |
|---|---|---|
| Semi Detached House | £509,865.00 | 19 Semi Detached Houses |
| Detached House | £815,104.00 | 43 Detached Houses |
| Terraced House | £431,822.00 | 10 Terraced Houses |
| Flat | £287,993.00 | 41 Flats |

