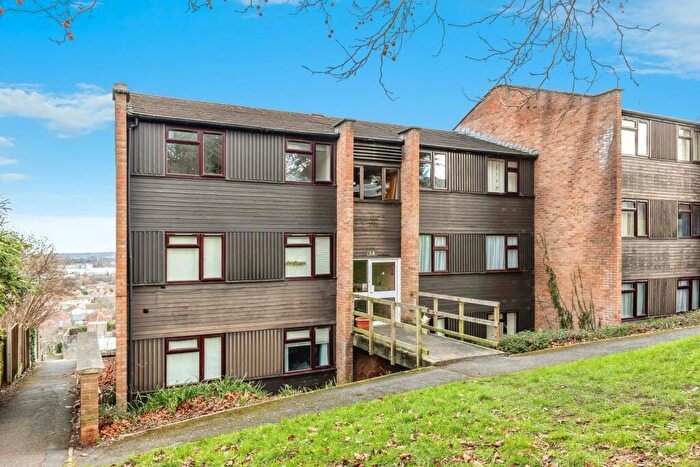
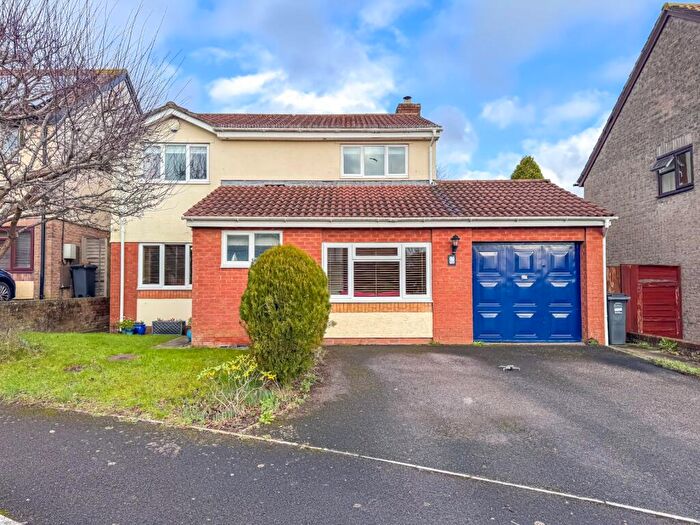
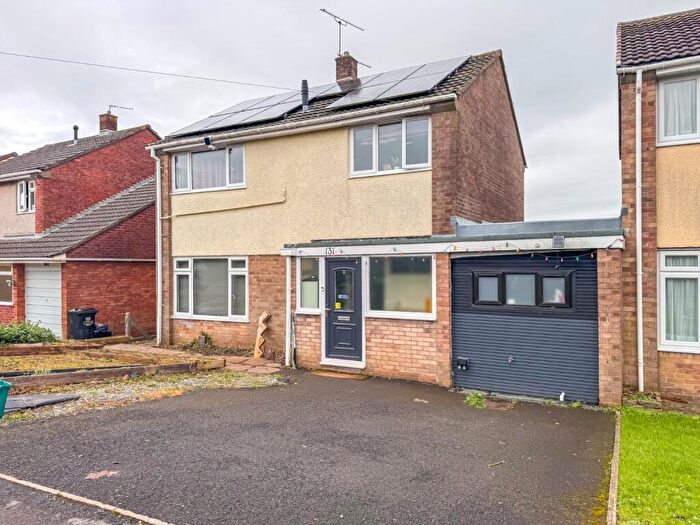
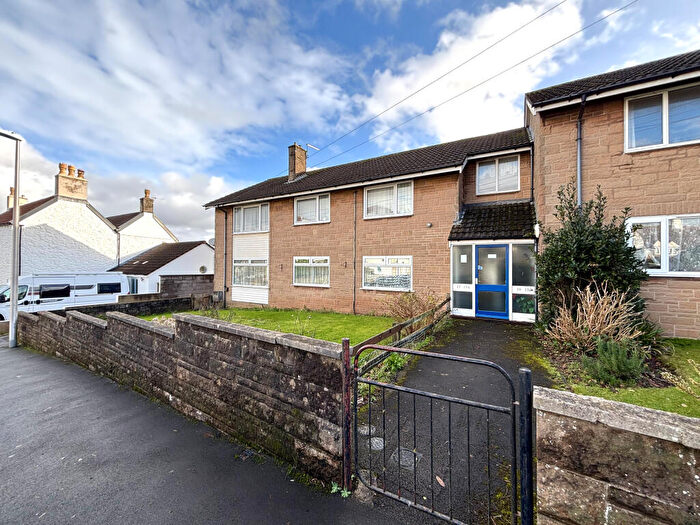
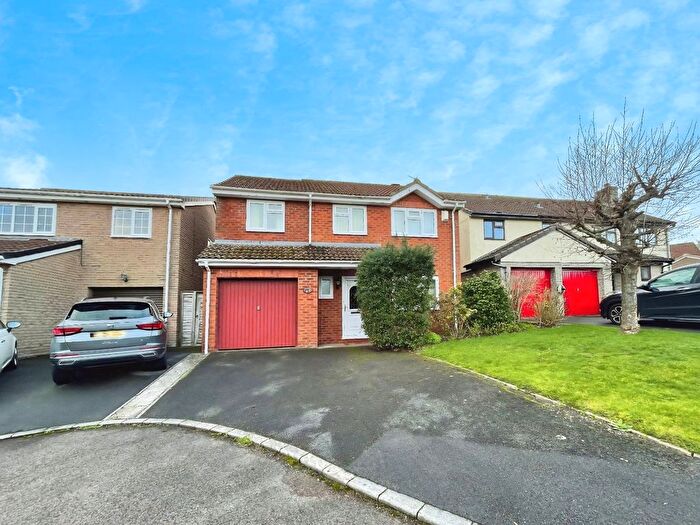
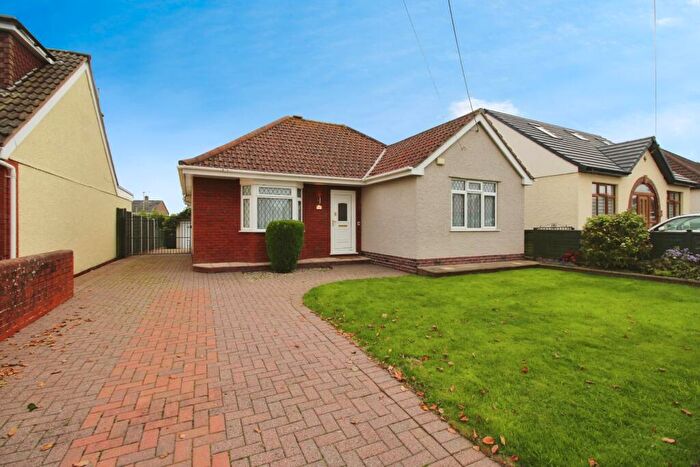
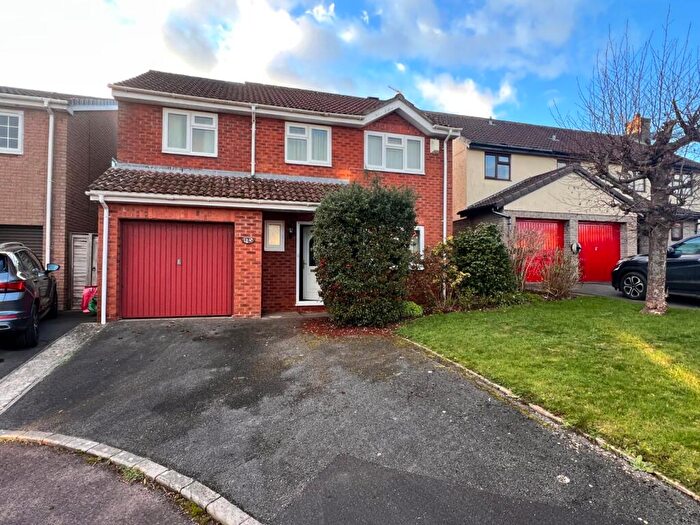
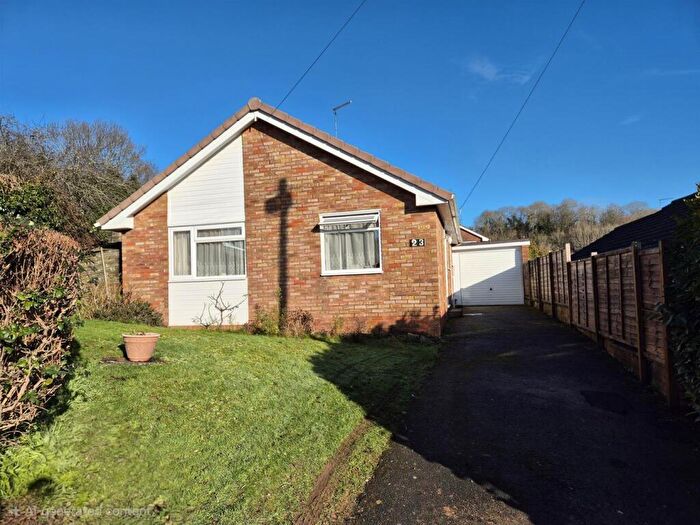
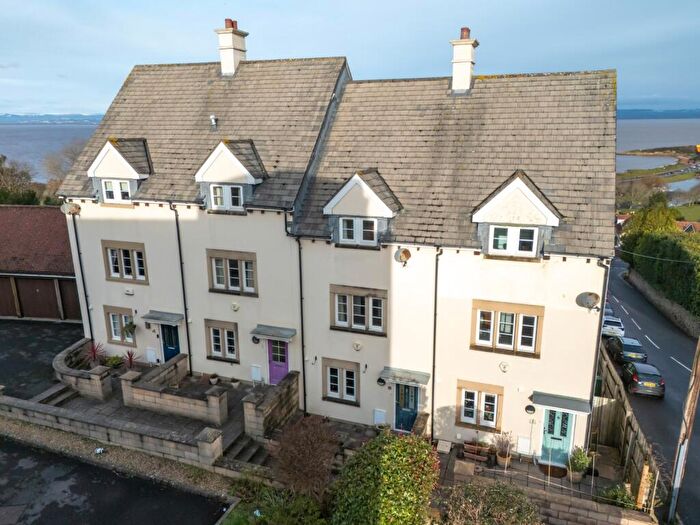
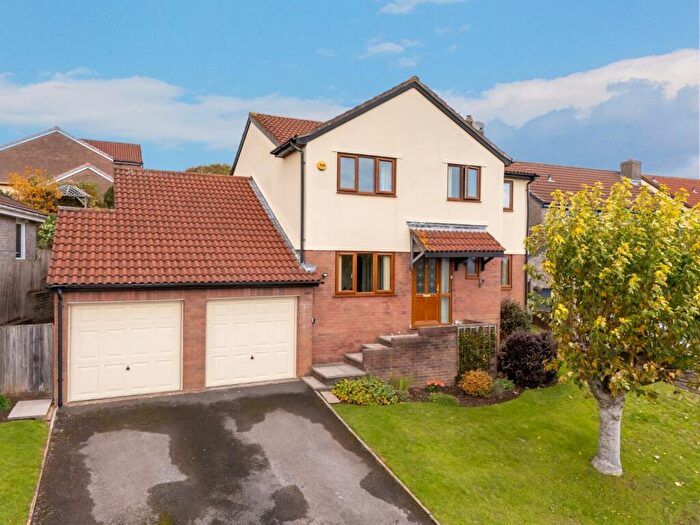
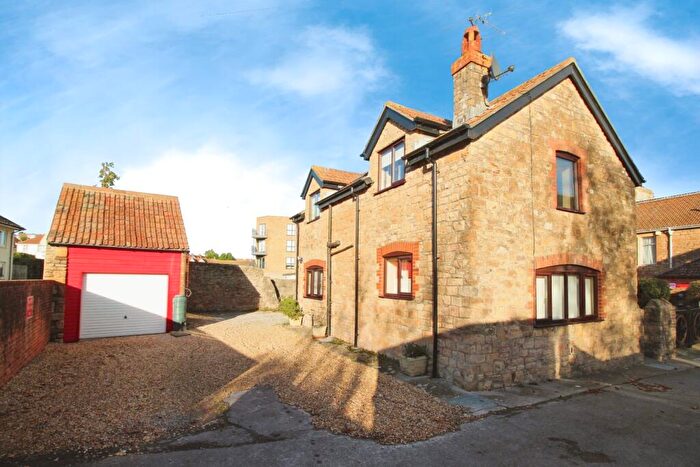
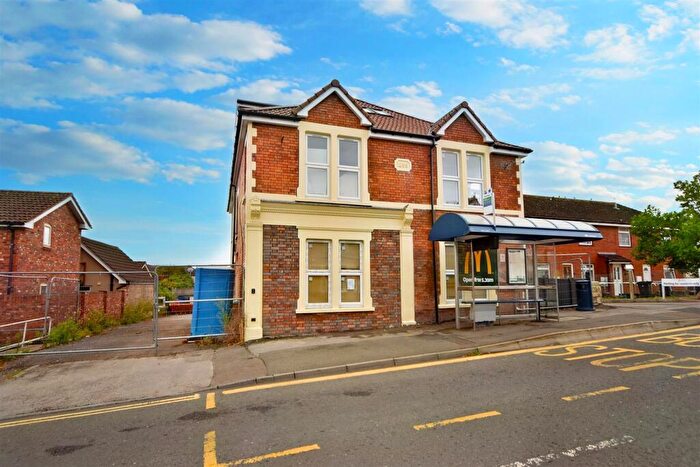
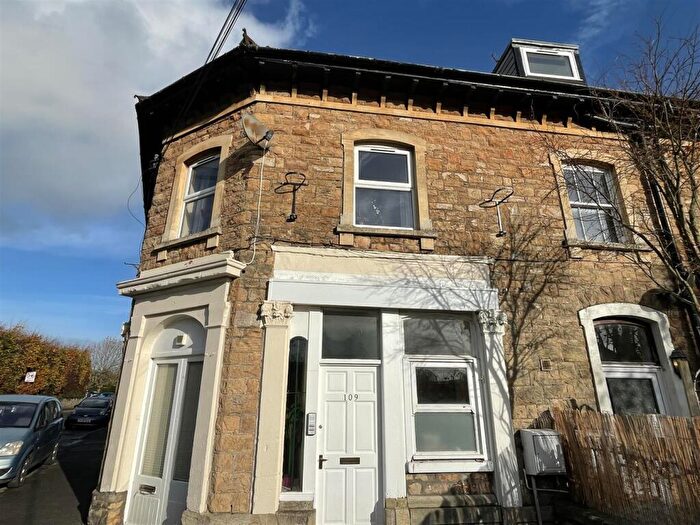
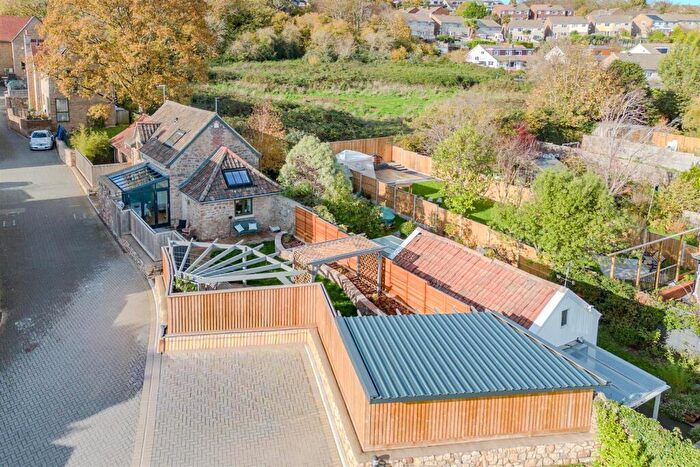
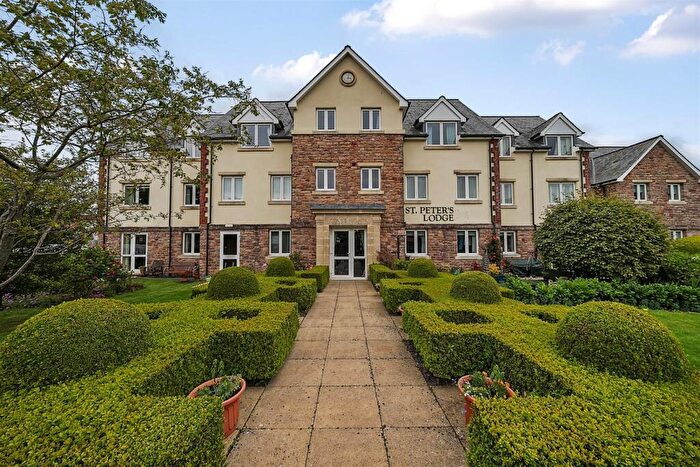
Houses for sale & to rent in Portishead South And North Weston, Bristol
House Prices in Portishead South And North Weston
Properties in Portishead South And North Weston have an average house price of £355,745.00 and had 137 Property Transactions within the last 3 years¹.
Portishead South And North Weston is an area in Bristol, North Somerset with 1,323 households², where the most expensive property was sold for £1,300,000.00.
Properties for sale in Portishead South And North Weston
Roads and Postcodes in Portishead South And North Weston
Navigate through our locations to find the location of your next house in Portishead South And North Weston, Bristol for sale or to rent.
| Streets | Postcodes |
|---|---|
| Avon Way | BS20 6JP BS20 6JQ BS20 6JW BS20 6LT BS20 6LU BS20 6NA |
| Birch Grove | BS20 6SP |
| Blackrock Villas | BS20 8PN |
| Briary Road | BS20 6NE BS20 6NF |
| Capenor Close | BS20 6RH |
| Cedar Way | BS20 6TT |
| Charlton View | BS20 6NN |
| Church Close | BS20 6AR |
| Church Road North | BS20 6PS |
| Church View | BS20 6PU |
| Clarence Gardens | BS20 6BN |
| Clevedon Road | BS20 6RR BS20 6TA BS20 6TB BS20 6TF BS20 8PL |
| Clifton Street | BS20 6TE |
| Elm Walk | BS20 6SU BS20 6SX |
| Fir Tree Cottages | BS20 6AT |
| George Street | BS20 6TD |
| Greenfield Park | BS20 6RG BS20 6RQ |
| High Street | BS20 6PR BS20 6PY BS20 6QL |
| Highfield Villas | BS20 6AU |
| Hollis Avenue | BS20 6TQ |
| Hollis Crescent | BS20 6TH |
| Honeylands | BS20 6RB |
| Ivor Terrace | BS20 6AX |
| Link Road | BS20 6NW |
| Lower Down Road | BS20 6PA BS20 6PD BS20 6PE BS20 6PF |
| Mead Road | BS20 6RY BS20 6RZ |
| Newlands Hill | BS20 6AZ |
| Oak Drive | BS20 6SS |
| Oakfield Place | BS20 7RB |
| Parsonage Court | BS20 6PH |
| Quarry Road | BS20 6AY |
| Queens Avenue | BS20 6NH BS20 6NL |
| Rippleside | BS20 6JG BS20 6NB BS20 6ND |
| Severn Road | BS20 6NG BS20 6NP BS20 6NQ |
| Slade Road | BS20 6AP |
| Spring Rise | BS20 6RE |
| St Marys Park Road | BS20 6SL BS20 6SN |
| St Marys Road | BS20 6QP BS20 6QW |
| St Peters Road | BS20 6QT BS20 6QY |
| The Garstons | BS20 6QU |
| The Paddock | BS20 6QX |
| The Rowans | BS20 6SR |
| The Triangle | BS20 6PG |
| Underwood Road | BS20 6TJ |
| Weston Wood Road | BS20 6RD |
| Wetlands Lane | BS20 6RA BS20 6RF BS20 6RJ BS20 6TZ |
| Willow Close | BS20 6XW |
Transport near Portishead South And North Weston
- FAQ
- Price Paid By Year
- Property Type Price
Frequently asked questions about Portishead South And North Weston
What is the average price for a property for sale in Portishead South And North Weston?
The average price for a property for sale in Portishead South And North Weston is £355,745. This amount is 22% lower than the average price in Bristol. There are 746 property listings for sale in Portishead South And North Weston.
What streets have the most expensive properties for sale in Portishead South And North Weston?
The streets with the most expensive properties for sale in Portishead South And North Weston are St Marys Road at an average of £765,700, Parsonage Court at an average of £550,000 and Capenor Close at an average of £474,337.
What streets have the most affordable properties for sale in Portishead South And North Weston?
The streets with the most affordable properties for sale in Portishead South And North Weston are The Triangle at an average of £152,250, Briary Road at an average of £167,633 and Underwood Road at an average of £228,166.
Which train stations are available in or near Portishead South And North Weston?
Some of the train stations available in or near Portishead South And North Weston are Avonmouth, Shirehampton and St.Andrew's Road.
Property Price Paid in Portishead South And North Weston by Year
The average sold property price by year was:
| Year | Average Sold Price | Price Change |
Sold Properties
|
|---|---|---|---|
| 2025 | £319,484 | -11% |
32 Properties |
| 2024 | £354,282 | -7% |
54 Properties |
| 2023 | £380,048 | 13% |
51 Properties |
| 2022 | £331,870 | -6% |
66 Properties |
| 2021 | £353,370 | 7% |
62 Properties |
| 2020 | £328,502 | 9% |
48 Properties |
| 2019 | £300,490 | -8% |
59 Properties |
| 2018 | £323,881 | 20% |
68 Properties |
| 2017 | £259,837 | -4% |
43 Properties |
| 2016 | £270,487 | 1% |
77 Properties |
| 2015 | £266,472 | 7% |
63 Properties |
| 2014 | £247,717 | 15% |
85 Properties |
| 2013 | £211,347 | 9% |
59 Properties |
| 2012 | £191,626 | -1% |
47 Properties |
| 2011 | £194,041 | -11% |
41 Properties |
| 2010 | £216,276 | 7% |
44 Properties |
| 2009 | £201,184 | -2% |
41 Properties |
| 2008 | £204,352 | -9% |
41 Properties |
| 2007 | £222,025 | 15% |
72 Properties |
| 2006 | £189,764 | 2% |
98 Properties |
| 2005 | £186,267 | 8% |
52 Properties |
| 2004 | £171,106 | 10% |
76 Properties |
| 2003 | £154,110 | 12% |
41 Properties |
| 2002 | £135,250 | 21% |
80 Properties |
| 2001 | £106,841 | 11% |
66 Properties |
| 2000 | £94,839 | 14% |
62 Properties |
| 1999 | £81,621 | 14% |
65 Properties |
| 1998 | £69,963 | 4% |
49 Properties |
| 1997 | £67,215 | -3% |
71 Properties |
| 1996 | £69,181 | 10% |
62 Properties |
| 1995 | £62,528 | - |
45 Properties |
Property Price per Property Type in Portishead South And North Weston
Here you can find historic sold price data in order to help with your property search.
The average Property Paid Price for specific property types in the last three years are:
| Property Type | Average Sold Price | Sold Properties |
|---|---|---|
| Semi Detached House | £366,297.00 | 37 Semi Detached Houses |
| Detached House | £481,941.00 | 37 Detached Houses |
| Terraced House | £362,204.00 | 34 Terraced Houses |
| Flat | £173,703.00 | 29 Flats |

