
Houses for sale & to rent in Weston-super-mare South, Weston-super-mare
House Prices in Weston-super-mare South
Properties in Weston-super-mare South have an average house price of £196k and had 259 Property Transactions within the last 3 years¹.
Weston-super-mare South is an area in Weston-super-mare, North Somerset with 4,426 households², where the most expensive property was sold for £455k.
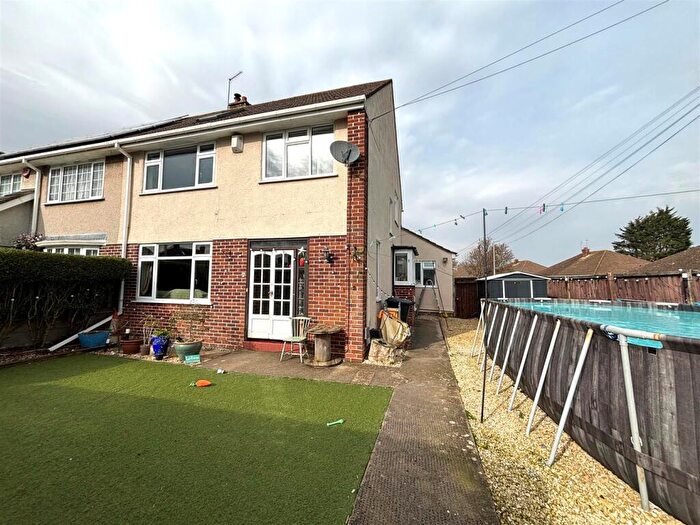
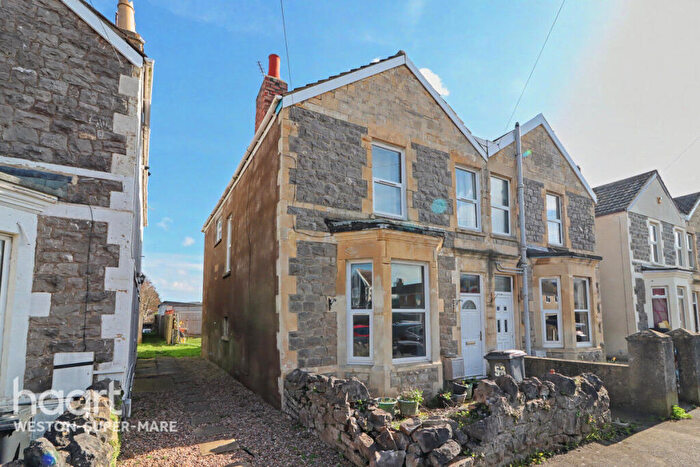
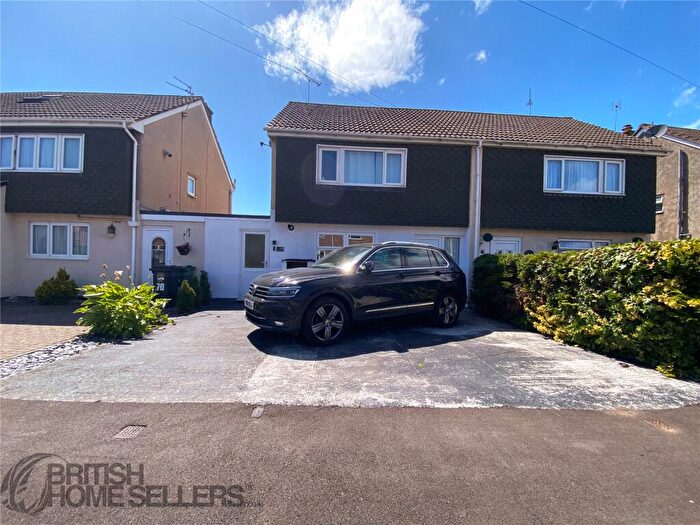
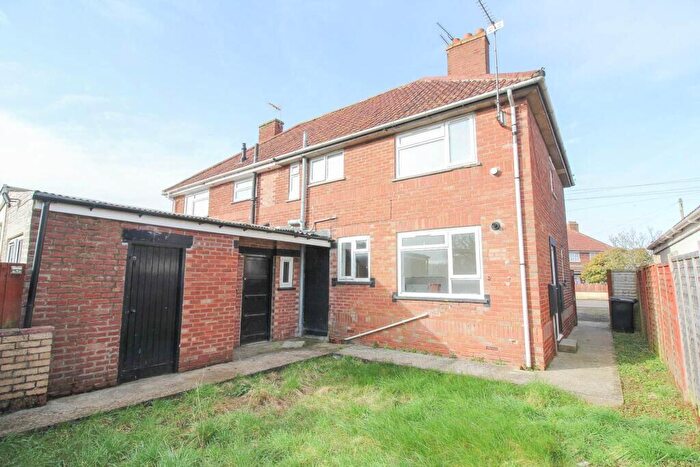
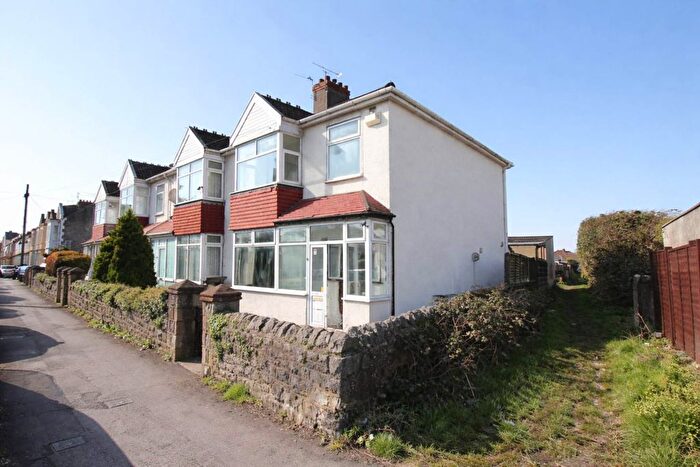
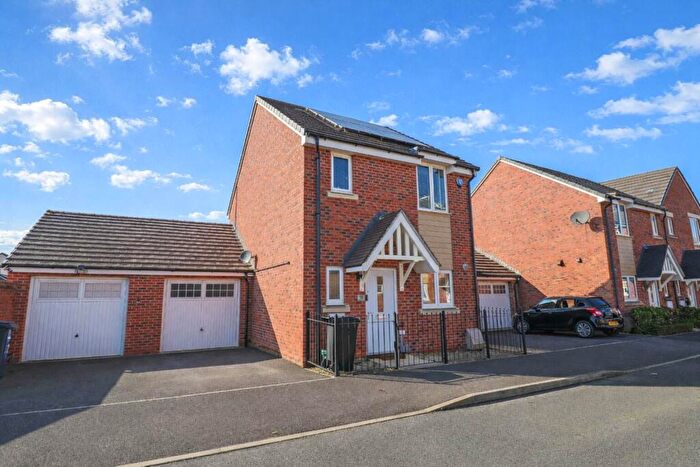
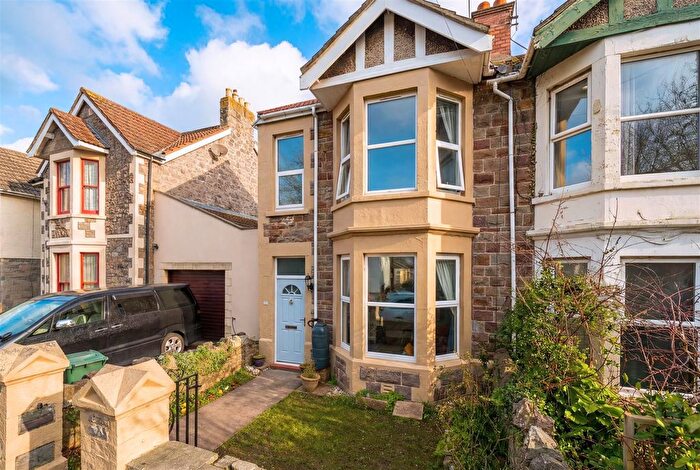
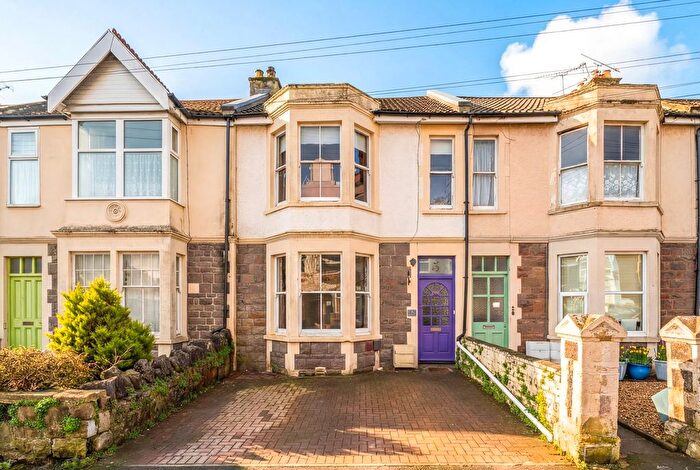
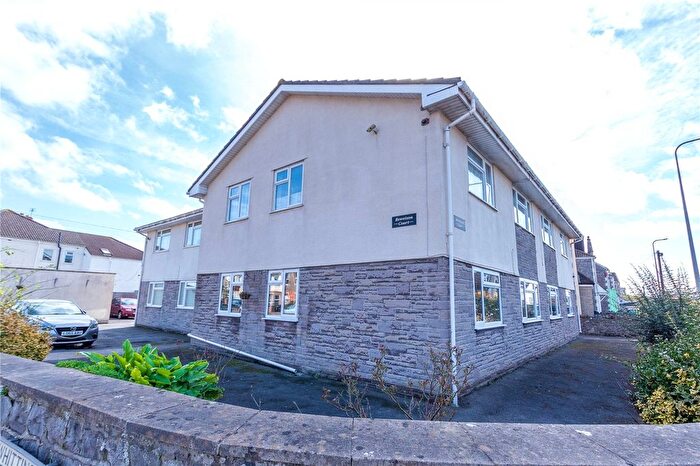
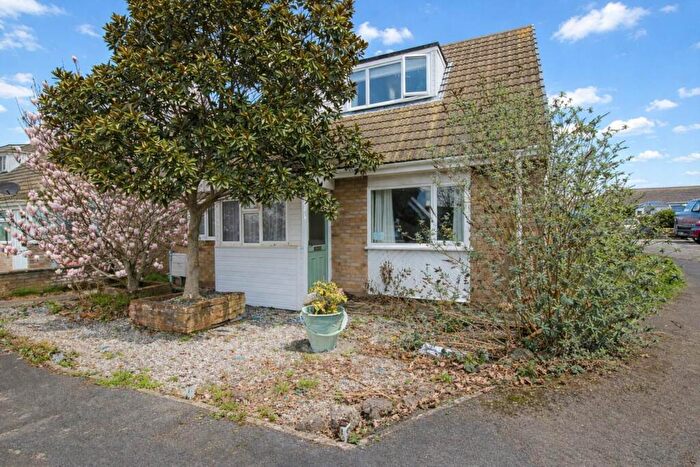
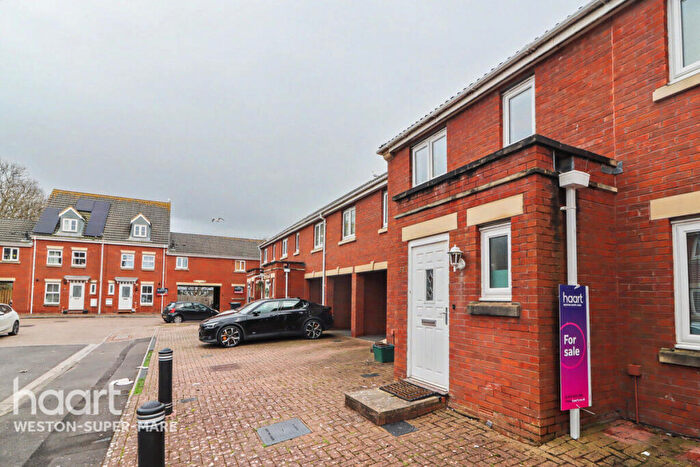
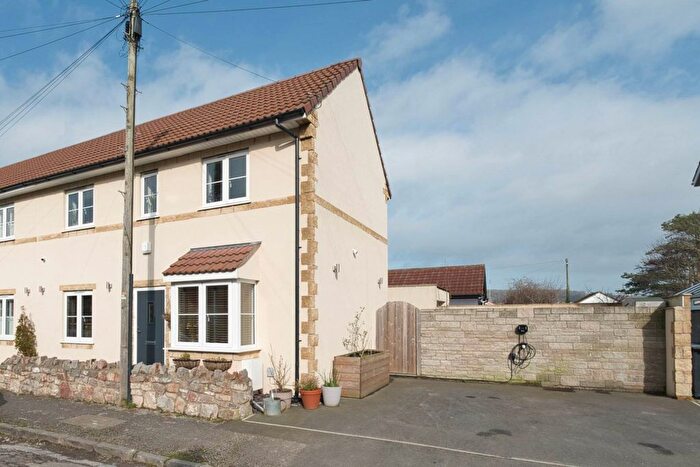
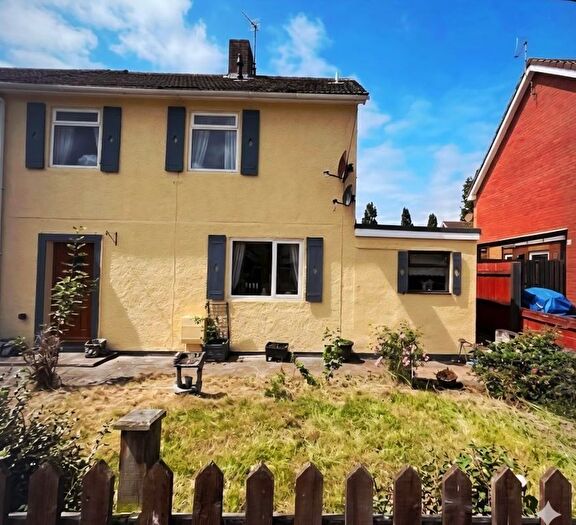
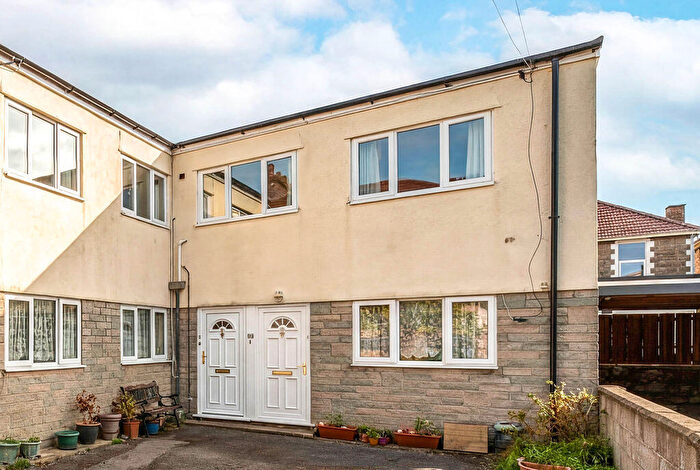
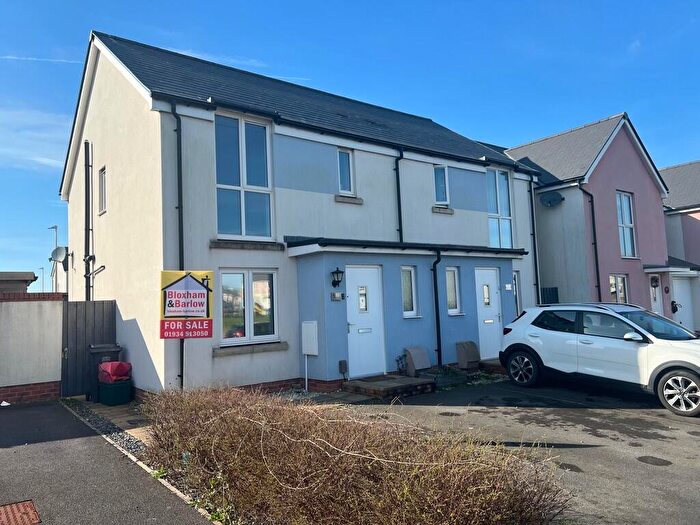
Properties for sale in Weston-super-mare South
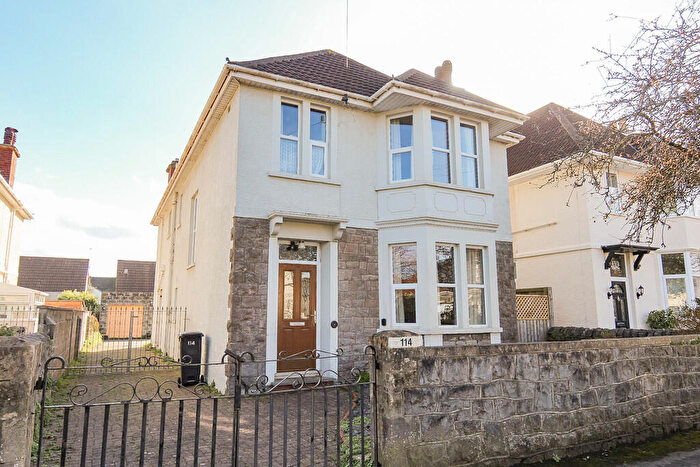
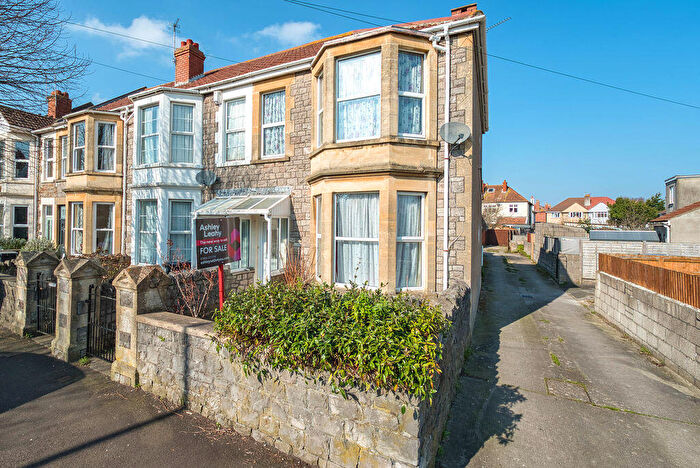
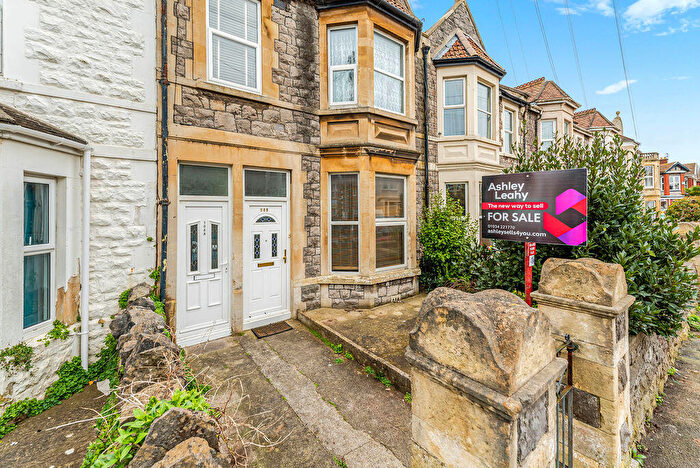
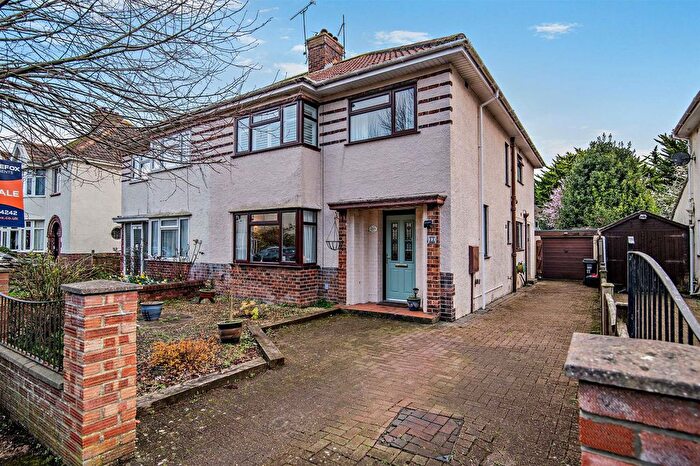
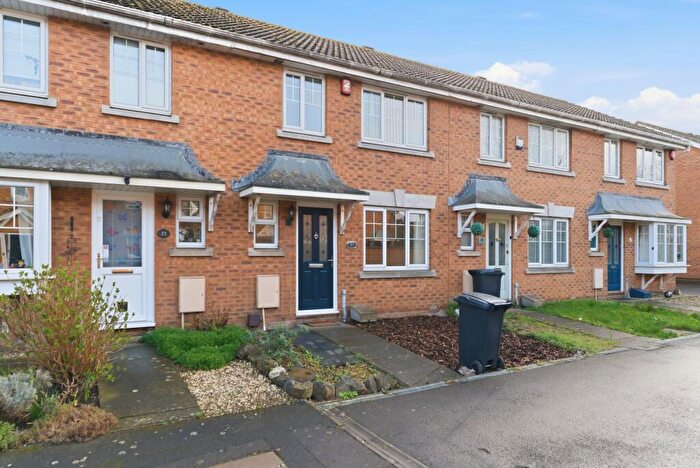
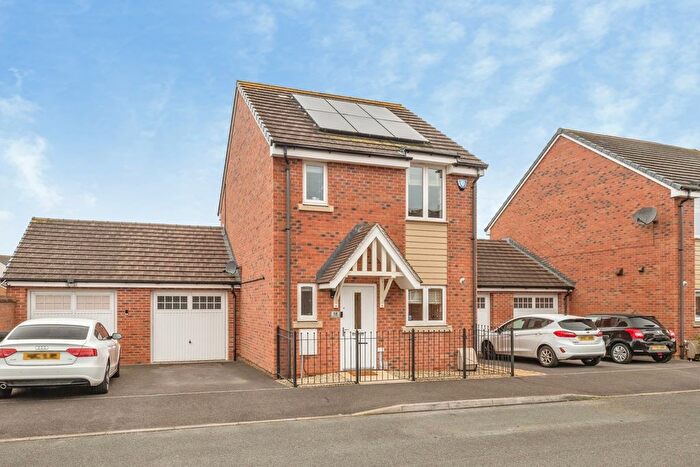
![]()
If you are looking to sell your house, let it out, or receive a property valuation, an expert can help you.
Click the button below to get started.


Roads and Postcodes in Weston-super-mare South
Navigate through our locations to find the location of your next house in Weston-super-mare South, Weston-super-mare for sale or to rent.
Transport near Weston-super-mare South

- FAQ
- Price Paid By Year
- Property Type Price
Frequently asked questions about Weston-super-mare South
What is the average price for a property for sale in Weston-super-mare South?
The average price for a property for sale in Weston-super-mare South is £196,332. This amount is 26% lower than the average price in Weston-super-mare. There are 1,562 property listings for sale in Weston-super-mare South.
What streets have the most expensive properties for sale in Weston-super-mare South?
The streets with the most expensive properties for sale in Weston-super-mare South are Addicott Road at an average of £370,000, Walnut Close at an average of £320,400 and Rectors Way at an average of £269,000.
What streets have the most affordable properties for sale in Weston-super-mare South?
The streets with the most affordable properties for sale in Weston-super-mare South are Newland Road at an average of £78,000, Wood View Terrace at an average of £104,870 and Grasmere Drive at an average of £106,000.
Which train stations are available in or near Weston-super-mare South?
Some of the train stations available in or near Weston-super-mare South are Weston-Super-Mare, Weston Milton and Worle.
Property Price Paid in Weston-super-mare South by Year
The average sold property price by year was:
| Year | Average Sold Price | Price Change |
Sold Properties
|
|---|---|---|---|
| 2025 | £197,884 | -0,5% |
88 Properties |
| 2024 | £198,775 | 3% |
87 Properties |
| 2023 | £192,176 | -4% |
84 Properties |
| 2022 | £200,306 | 10% |
130 Properties |
| 2021 | £181,253 | 8% |
158 Properties |
| 2020 | £166,127 | 6% |
82 Properties |
| 2019 | £156,457 | 3% |
124 Properties |
| 2018 | £152,428 | -2% |
128 Properties |
| 2017 | £155,895 | 10% |
102 Properties |
| 2016 | £140,006 | 7% |
116 Properties |
| 2015 | £130,704 | -1% |
119 Properties |
| 2014 | £132,200 | 11% |
110 Properties |
| 2013 | £117,499 | 9% |
80 Properties |
| 2012 | £107,394 | -11% |
59 Properties |
| 2011 | £119,236 | -4% |
69 Properties |
| 2010 | £124,493 | 3% |
58 Properties |
| 2009 | £120,507 | -7% |
40 Properties |
| 2008 | £129,015 | -3% |
70 Properties |
| 2007 | £133,008 | 5% |
232 Properties |
| 2006 | £126,502 | 7% |
242 Properties |
| 2005 | £118,267 | 10% |
200 Properties |
| 2004 | £106,529 | 14% |
143 Properties |
| 2003 | £91,994 | 16% |
156 Properties |
| 2002 | £77,383 | 17% |
167 Properties |
| 2001 | £64,498 | 10% |
145 Properties |
| 2000 | £58,050 | 12% |
116 Properties |
| 1999 | £50,982 | 10% |
112 Properties |
| 1998 | £45,735 | 3% |
116 Properties |
| 1997 | £44,512 | 5% |
95 Properties |
| 1996 | £42,159 | 3% |
99 Properties |
| 1995 | £40,938 | - |
102 Properties |
Property Price per Property Type in Weston-super-mare South
Here you can find historic sold price data in order to help with your property search.
The average Property Paid Price for specific property types in the last three years are:
| Property Type | Average Sold Price | Sold Properties |
|---|---|---|
| Flat | £133,893.00 | 67 Flats |
| Semi Detached House | £216,707.00 | 76 Semi Detached Houses |
| Terraced House | £216,473.00 | 112 Terraced Houses |
| Detached House | £291,125.00 | 4 Detached Houses |