
Houses for sale & to rent in NE12 9EE, Amble Place, Benton, Newcastle Upon Tyne
House Prices in NE12 9EE, Amble Place, Benton
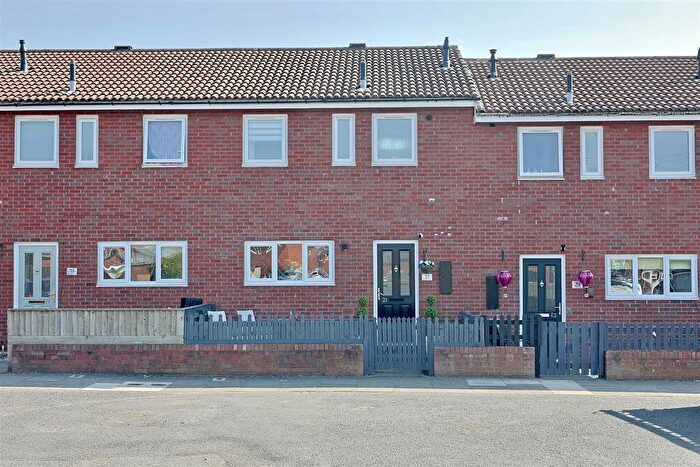
Properties in NE12 9EE have no sales history available within the last 3 years. NE12 9EE is a postcode in Amble Place located in Benton, an area in Newcastle Upon Tyne, North Tyneside, with 10 households².
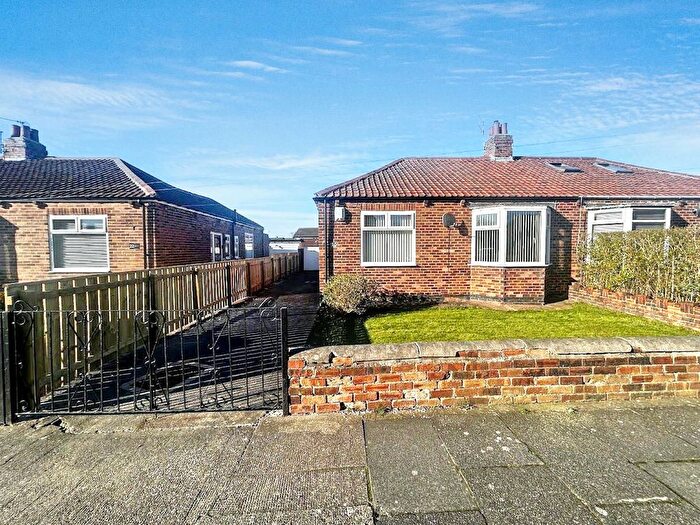
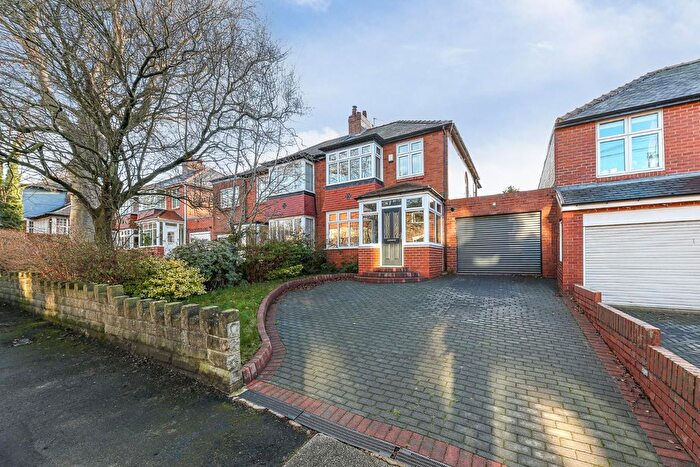
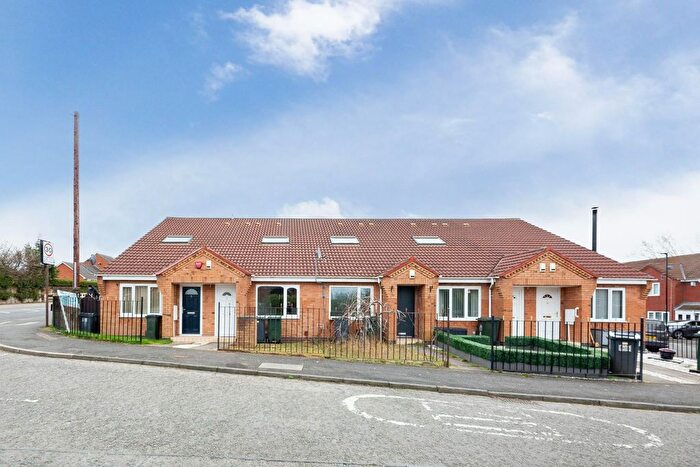
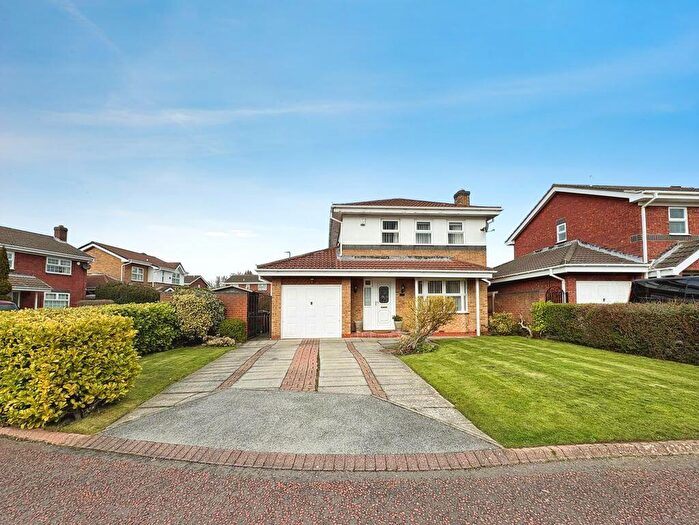
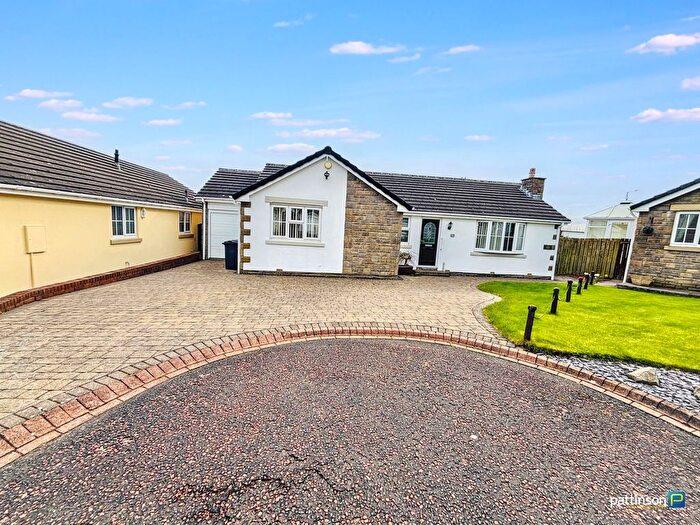
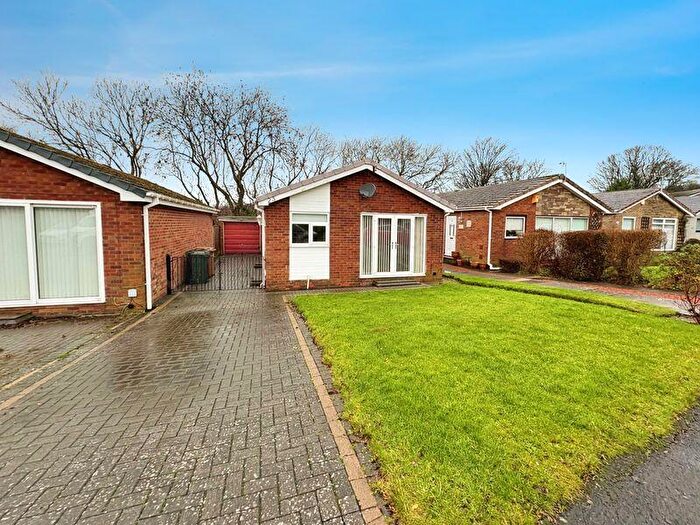
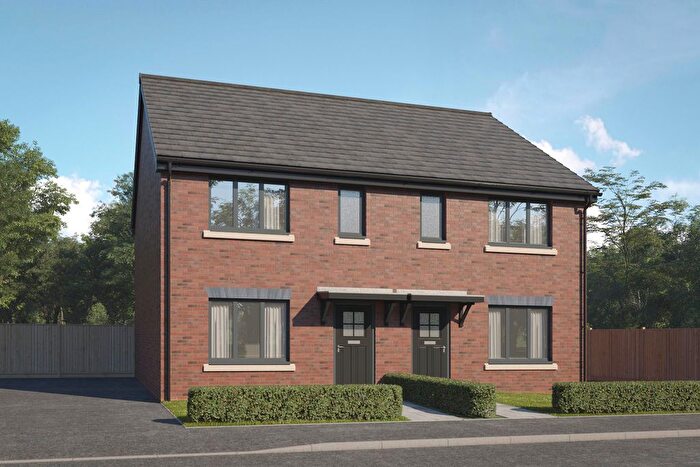
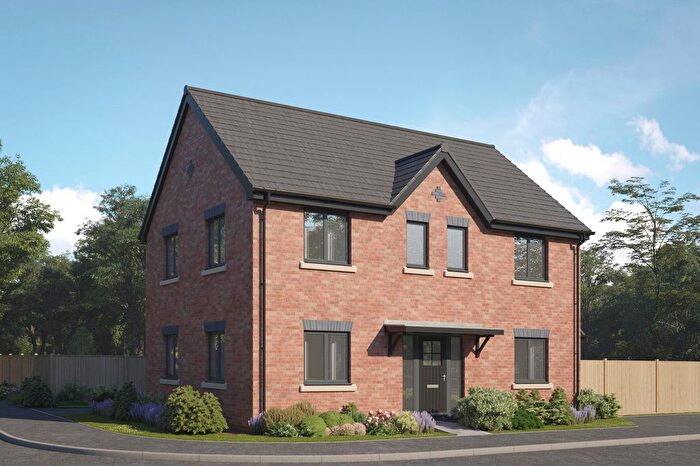
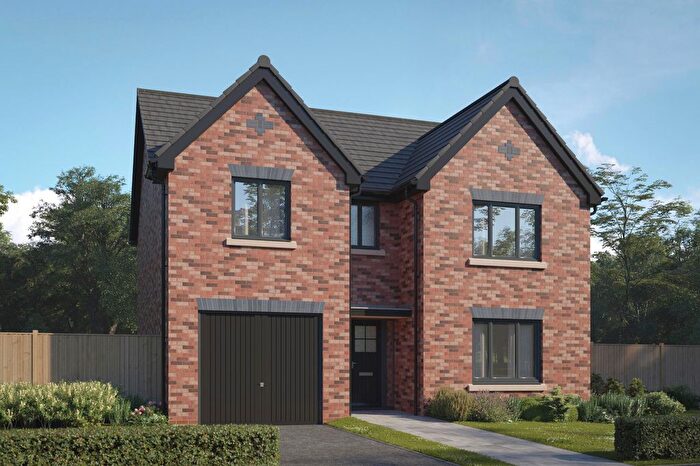
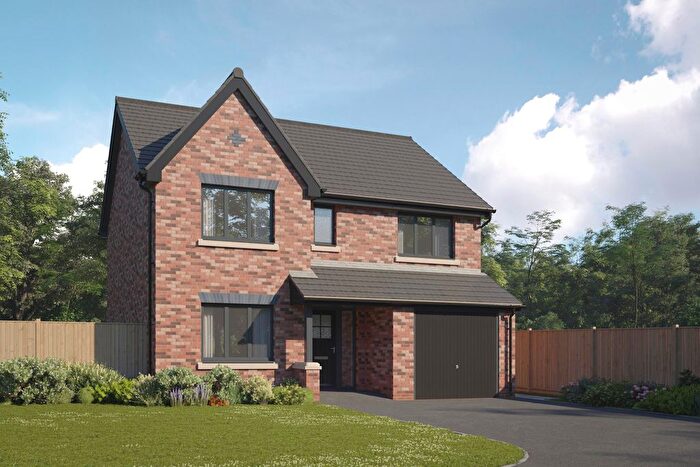
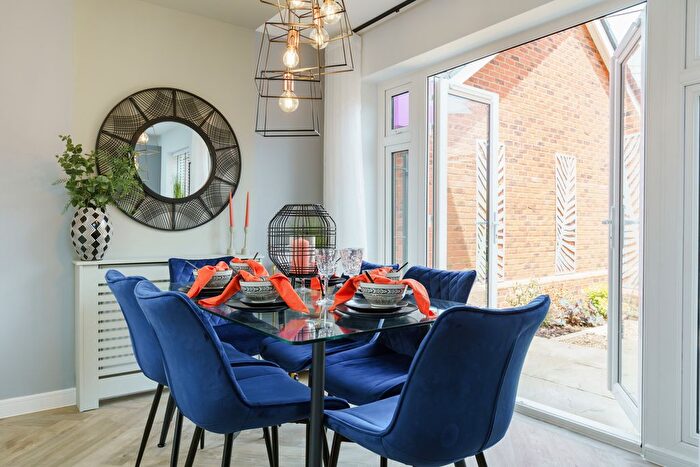
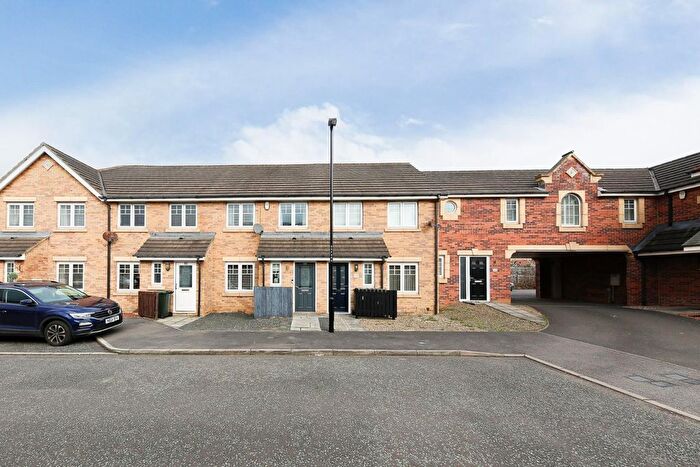
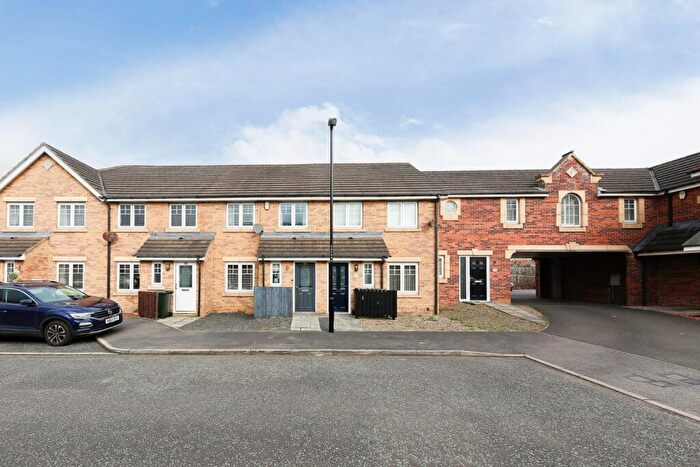
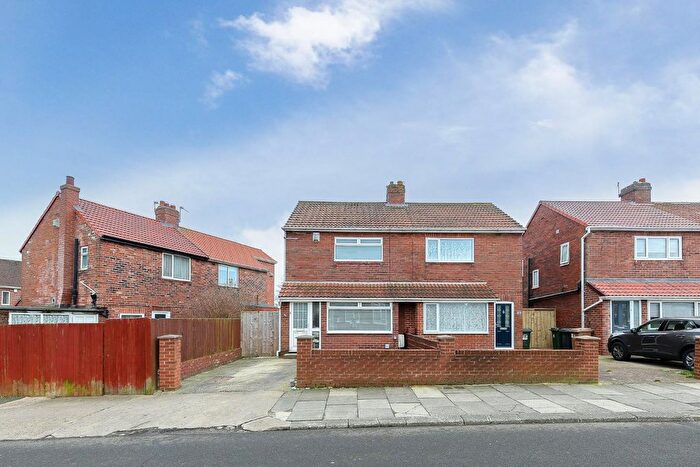
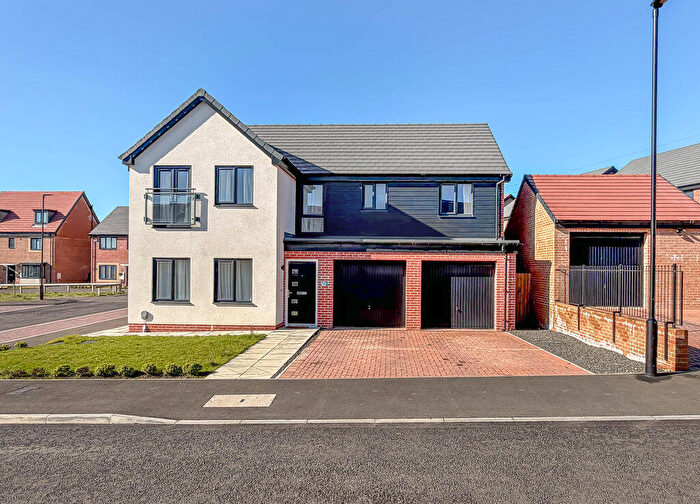
Properties for sale near NE12 9EE, Amble Place

![]()
If you are looking to sell your house, let it out, or receive a property valuation, an expert can help you.
Click the button below to get started.


Price Paid in Amble Place, NE12 9EE, Benton
8 Amble Place, NE12 9EE, Benton Newcastle Upon Tyne
Property 8 has been sold 3 times. The last time it was sold was in 19/02/2019 and the sold price was £140,000.00.
This semi detached house, sold as a freehold on 19/02/2019, is a 83 sqm semi-detached house with an EPC rating of D.
| Date | Price | Property Type | Tenure | Classification |
|---|---|---|---|---|
| 19/02/2019 | £140,000.00 | Semi Detached House | freehold | Established Building |
| 20/03/2017 | £99,000.00 | Semi Detached House | freehold | Established Building |
| 30/06/2005 | £120,000.00 | Semi Detached House | freehold | Established Building |
3 Amble Place, NE12 9EE, Benton Newcastle Upon Tyne
Property 3 has been sold 1 time. The last time it was sold was in 29/06/2018 and the sold price was £127,000.00.
This semi detached house, sold as a freehold on 29/06/2018, is a 81 sqm semi-detached house with an EPC rating of E.
| Date | Price | Property Type | Tenure | Classification |
|---|---|---|---|---|
| 29/06/2018 | £127,000.00 | Semi Detached House | freehold | Established Building |
7 Amble Place, NE12 9EE, Benton Newcastle Upon Tyne
Property 7 has been sold 1 time. The last time it was sold was in 26/08/2011 and the sold price was £93,500.00.
This semi detached house, sold as a freehold on 26/08/2011, is a 82 sqm semi-detached house with an EPC rating of D.
| Date | Price | Property Type | Tenure | Classification |
|---|---|---|---|---|
| 26/08/2011 | £93,500.00 | Semi Detached House | freehold | Established Building |
10 Amble Place, NE12 9EE, Benton Newcastle Upon Tyne
This is a 70 square meter Semi-detached House with an EPC rating of D. Currently, there is no transaction history available for this property.
Transport near NE12 9EE, Amble Place

House price paid reports for NE12 9EE, Amble Place
Click on the buttons below to see price paid reports by year or property price:
- Price Paid By Year
Property Price Paid in NE12 9EE, Amble Place by Year
The average sold property price by year was:
| Year | Average Sold Price | Price Change |
Sold Properties
|
|---|---|---|---|
| 2019 | £140,000 | 9% |
1 Property |
| 2018 | £127,000 | 22% |
1 Property |
| 2017 | £99,000 | 6% |
1 Property |
| 2011 | £93,500 | -28% |
1 Property |
| 2005 | £120,000 | - |
1 Property |