
Houses for sale & to rent in NE12 6DE, Hadrian Court, Killingworth, Newcastle Upon Tyne
House Prices in NE12 6DE, Hadrian Court, Killingworth
Properties in NE12 6DE have no sales history available within the last 3 years. NE12 6DE is a postcode in Hadrian Court located in Killingworth, an area in Newcastle Upon Tyne, North Tyneside, with 35 households².
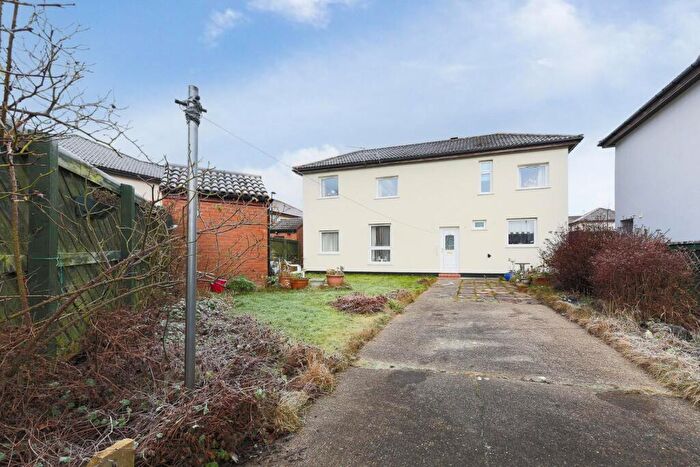
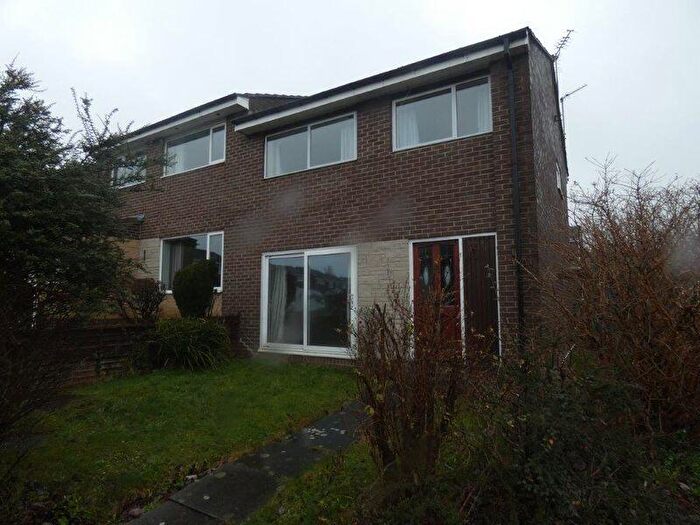
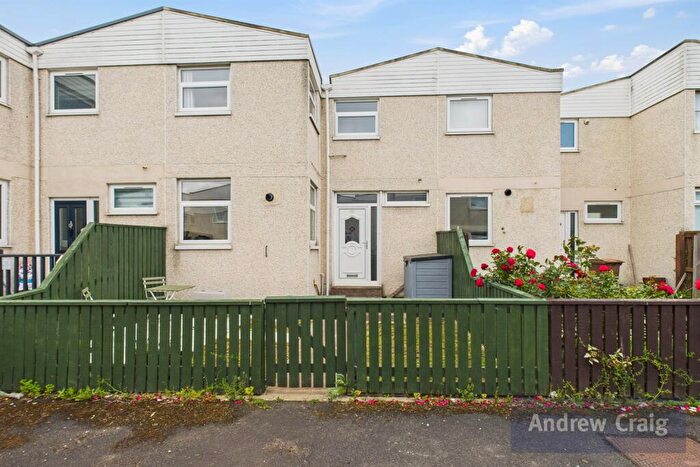
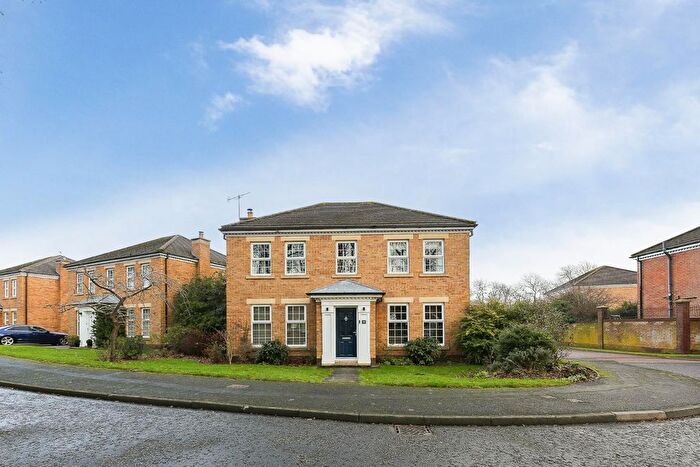
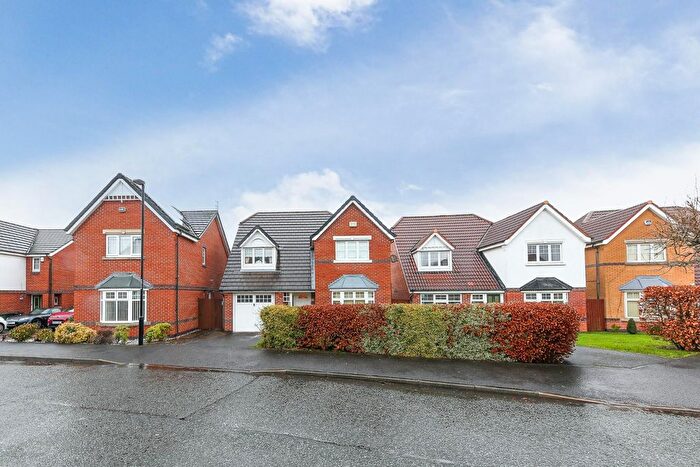
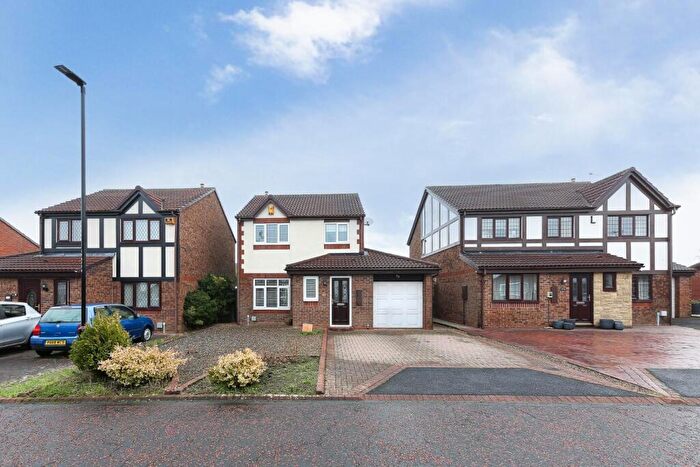
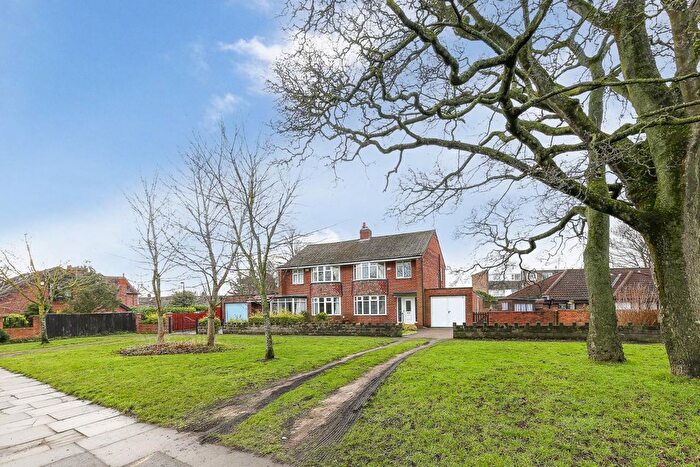
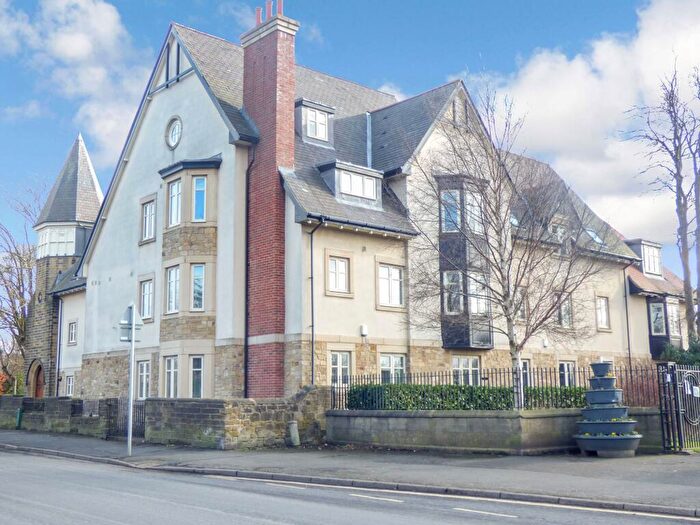
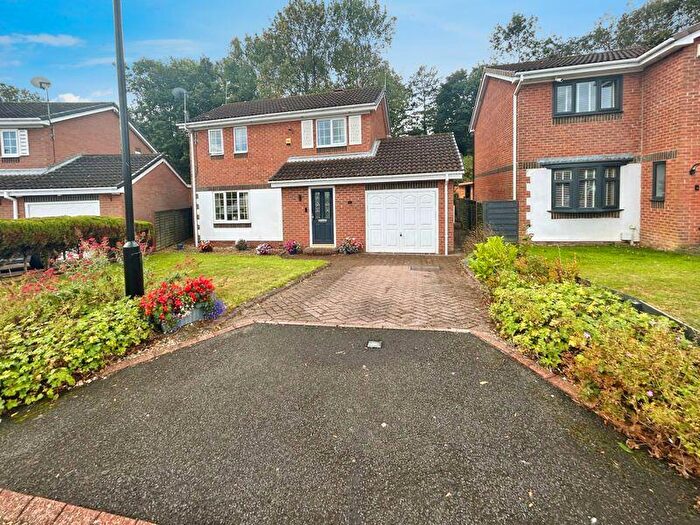
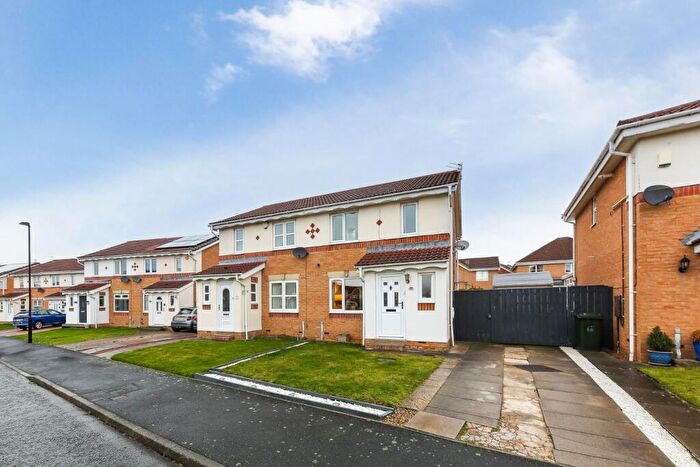
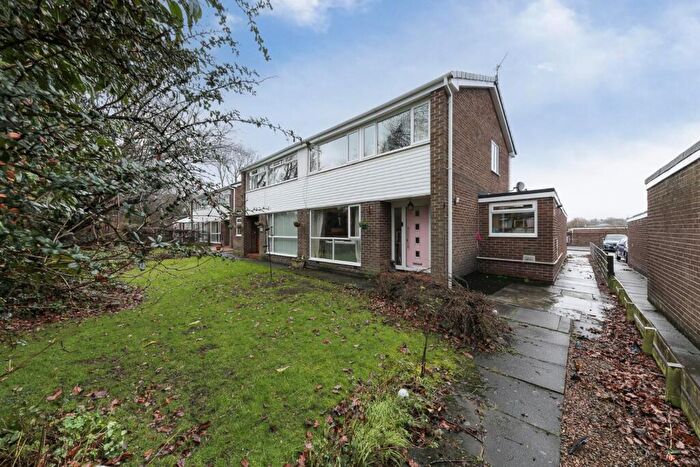
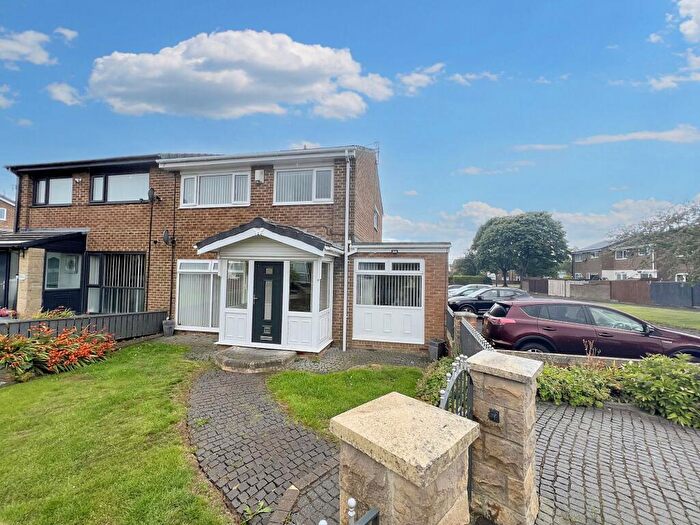
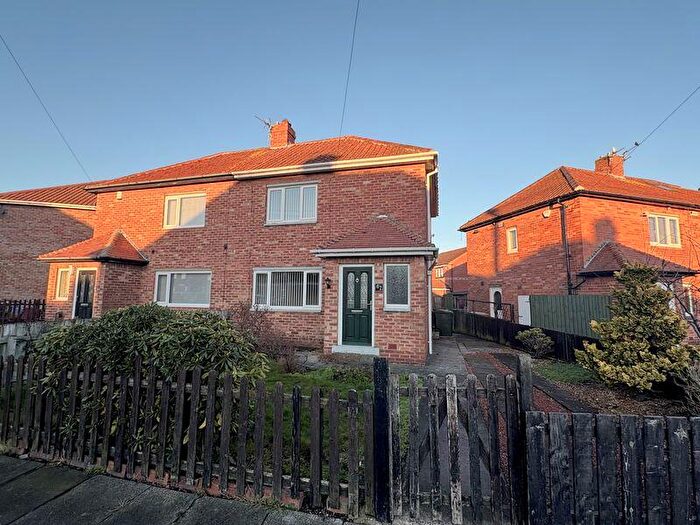
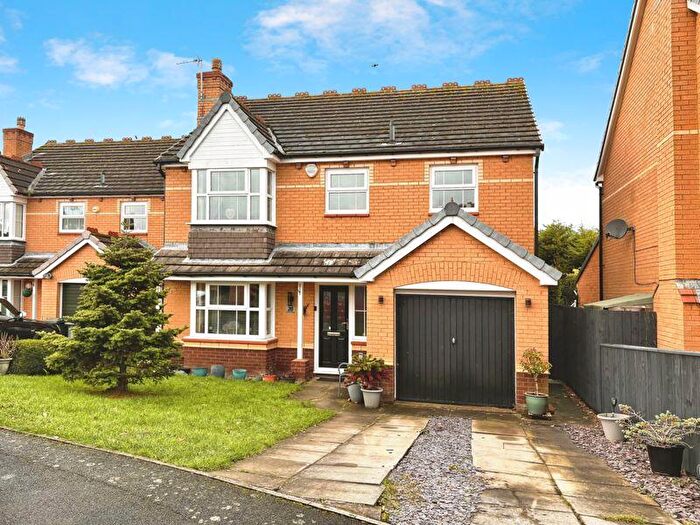
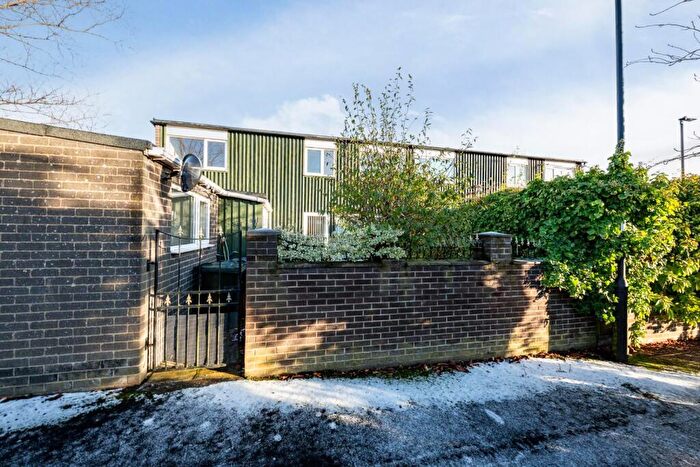
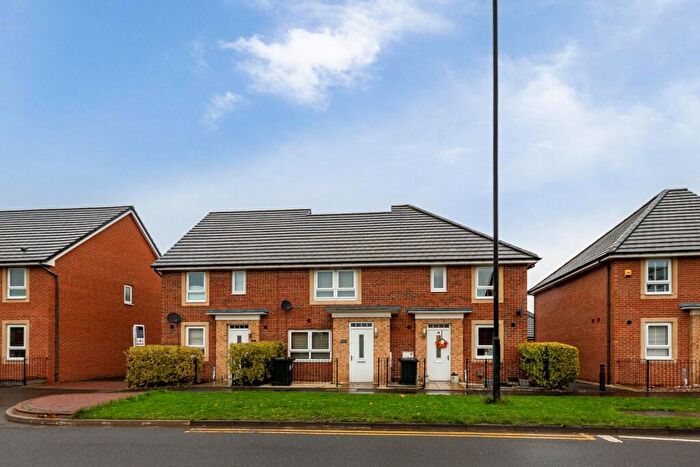
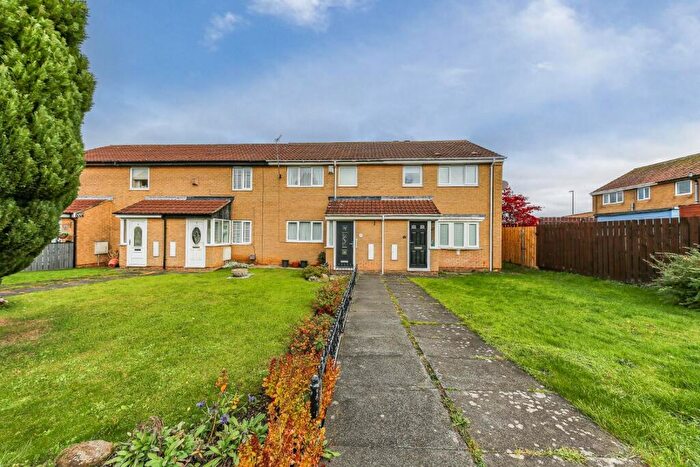
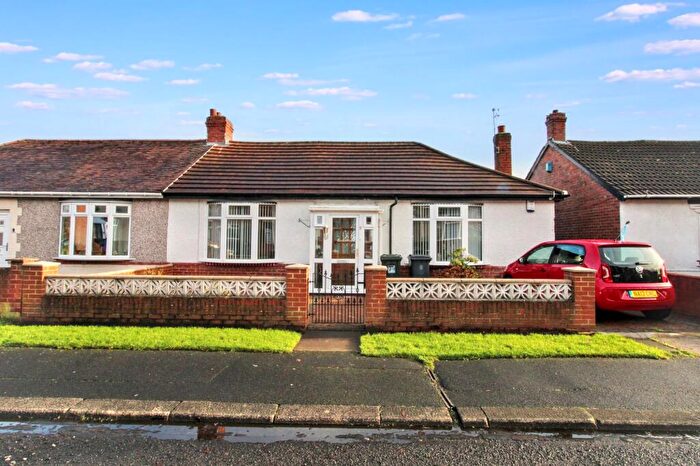
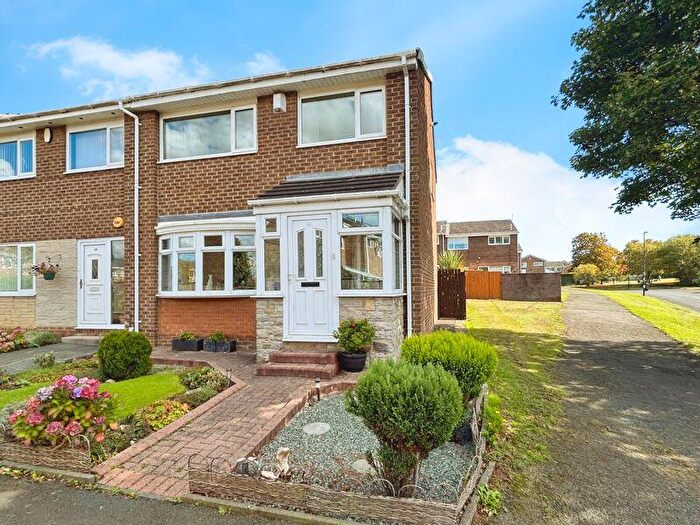
Properties for sale near NE12 6DE, Hadrian Court


![]()
If you are looking to sell your house, let it out, or receive a property valuation, an expert can help you.
Click the button below to get started.


Price Paid in Hadrian Court, NE12 6DE, Killingworth
152 Hadrian Court, NE12 6DE, Killingworth Newcastle Upon Tyne
Property 152 has been sold 3 times. The last time it was sold was in 06/09/2018 and the sold price was £62,500.00.
This flat, sold as a leasehold on 06/09/2018, is a 69 sqm mid-floor flat with an EPC rating of E.
| Date | Price | Property Type | Tenure | Classification |
|---|---|---|---|---|
| 06/09/2018 | £62,500.00 | Flat | leasehold | Established Building |
| 30/06/2017 | £44,000.00 | Flat | leasehold | Established Building |
| 11/03/2005 | £69,000.00 | Flat | leasehold | Established Building |
145 Hadrian Court, NE12 6DE, Killingworth Newcastle Upon Tyne
Property 145 has been sold 2 times. The last time it was sold was in 13/07/2012 and the sold price was £50,000.00.
This flat, sold as a leasehold on 13/07/2012, is a 69 sqm mid-floor flat with an EPC rating of E.
| Date | Price | Property Type | Tenure | Classification |
|---|---|---|---|---|
| 13/07/2012 | £50,000.00 | Flat | leasehold | Established Building |
| 05/05/2000 | £25,500.00 | Flat | leasehold | Established Building |
154 Hadrian Court Garth Thirtythree, NE12 6DE, Killingworth Newcastle Upon Tyne
This is a 58 square meter Mid-floor Flat with an EPC rating of C. Currently, there is no transaction history available for this property.
169 HADRIAN COURT KILLINGWORTH, NE12 6DE, Killingworth Newcastle Upon Tyne
This is a 69 square meter Top-floor Flat with an EPC rating of E. Currently, there is no transaction history available for this property.
137 HADRIAN COURT KILLINGWORTH, NE12 6DE, Killingworth Newcastle Upon Tyne
This is a 69 square meter Mid-floor Flat with an EPC rating of E. Currently, there is no transaction history available for this property.
150 HADRIAN COURT KILLINGWORTH, NE12 6DE, Killingworth Newcastle Upon Tyne
This is a 58 square meter Mid-floor Flat with an EPC rating of E. Currently, there is no transaction history available for this property.
142 HADRIAN COURT KILLINGWORTH, NE12 6DE, Killingworth Newcastle Upon Tyne
This is a 58 square meter Mid-floor Flat with an EPC rating of F. Currently, there is no transaction history available for this property.
163 Hadrian Court Garth Thirtythree, NE12 6DE, Killingworth Newcastle Upon Tyne
This is a 58 square meter Top-floor Flat with an EPC rating of E. Currently, there is no transaction history available for this property.
161 Hadrian Court Garth Thirtythree, NE12 6DE, Killingworth Newcastle Upon Tyne
This is a 69 square meter Mid-floor Flat with an EPC rating of C. Currently, there is no transaction history available for this property.
167 Hadrian Court Garth Thirtythree, NE12 6DE, Killingworth Newcastle Upon Tyne
This is a 58 square meter Top-floor Flat with an EPC rating of E. Currently, there is no transaction history available for this property.
156 Hadrian Court Garth Thirtythree, NE12 6DE, Killingworth Newcastle Upon Tyne
This is a 69 square meter Mid-floor Flat with an EPC rating of C. Currently, there is no transaction history available for this property.
153 Hadrian Court Garth Thirtythree, NE12 6DE, Killingworth Newcastle Upon Tyne
This is a 69 square meter Mid-floor Flat with an EPC rating of C. Currently, there is no transaction history available for this property.
148 HADRIAN COURT KILLINGWORTH, NE12 6DE, Killingworth Newcastle Upon Tyne
This is a 69 square meter Mid-floor Flat with an EPC rating of E. Currently, there is no transaction history available for this property.
143 HADRIAN COURT KILLINGWORTH, NE12 6DE, Killingworth Newcastle Upon Tyne
This is a 69 square meter Mid-floor Flat with an EPC rating of E. Currently, there is no transaction history available for this property.
141 HADRIAN COURT KILLINGWORTH, NE12 6DE, Killingworth Newcastle Upon Tyne
This is a 69 square meter Mid-floor Flat with an EPC rating of E. Currently, there is no transaction history available for this property.
162 Hadrian Court Garth Thirtythree, NE12 6DE, Killingworth Newcastle Upon Tyne
This is a 58 square meter Mid-floor Flat with an EPC rating of D. Currently, there is no transaction history available for this property.
160 Hadrian Court Garth Thirtythree, NE12 6DE, Killingworth Newcastle Upon Tyne
This is a 69 square meter Mid-floor Flat with an EPC rating of C. Currently, there is no transaction history available for this property.
149 HADRIAN COURT KILLINGWORTH, NE12 6DE, Killingworth Newcastle Upon Tyne
This is a 69 square meter Mid-floor Flat with an EPC rating of E. Currently, there is no transaction history available for this property.
139 HADRIAN COURT KILLINGWORTH, NE12 6DE, Killingworth Newcastle Upon Tyne
This is a 69 square meter Mid-floor Flat with an EPC rating of E. Currently, there is no transaction history available for this property.
147 HADRIAN COURT KILLINGWORTH, NE12 6DE, Killingworth Newcastle Upon Tyne
This is a 69 square meter Mid-floor Flat with an EPC rating of E. Currently, there is no transaction history available for this property.
146 HADRIAN COURT KILLINGWORTH, NE12 6DE, Killingworth Newcastle Upon Tyne
This is a 58 square meter Mid-floor Flat with an EPC rating of E. Currently, there is no transaction history available for this property.
135 HADRIAN COURT KILLINGWORTH, NE12 6DE, Killingworth Newcastle Upon Tyne
This is a 69 square meter Mid-floor Flat with an EPC rating of E. Currently, there is no transaction history available for this property.
138 HADRIAN COURT KILLINGWORTH, NE12 6DE, Killingworth Newcastle Upon Tyne
This is a 58 square meter Mid-floor Flat with an EPC rating of F. Currently, there is no transaction history available for this property.
140 HADRIAN COURT KILLINGWORTH, NE12 6DE, Killingworth Newcastle Upon Tyne
This is a 69 square meter Mid-floor Flat with an EPC rating of E. Currently, there is no transaction history available for this property.
144 HADRIAN COURT KILLINGWORTH, NE12 6DE, Killingworth Newcastle Upon Tyne
This is a 69 square meter Mid-floor Flat with an EPC rating of E. Currently, there is no transaction history available for this property.
166 Hadrian Court Garth Thirtythree, NE12 6DE, Killingworth Newcastle Upon Tyne
This is a 58 square meter Top-floor Flat with an EPC rating of E. Currently, there is no transaction history available for this property.
158 Hadrian Court Garth Thirtythree, NE12 6DE, Killingworth Newcastle Upon Tyne
This is a 58 square meter Mid-floor Flat with an EPC rating of D. Currently, there is no transaction history available for this property.
155 Hadrian Court Garth Thirtythree, NE12 6DE, Killingworth Newcastle Upon Tyne
This is a 58 square meter Mid-floor Flat with an EPC rating of C. Currently, there is no transaction history available for this property.
165 Hadrian Court Garth Thirtythree, NE12 6DE, Killingworth Newcastle Upon Tyne
This is a 69 square meter Top-floor Flat with an EPC rating of E. Currently, there is no transaction history available for this property.
170 Hadrian Court Garth Thirtythree, NE12 6DE, Killingworth Newcastle Upon Tyne
This is a 58 square meter Top-floor Flat with an EPC rating of E. Currently, there is no transaction history available for this property.
151 Hadrian Court Garth Thirtythree, NE12 6DE, Killingworth Newcastle Upon Tyne
This is a 58 square meter Mid-floor Flat with an EPC rating of D. Currently, there is no transaction history available for this property.
136 HADRIAN COURT KILLINGWORTH, NE12 6DE, Killingworth Newcastle Upon Tyne
This is a 69 square meter Mid-floor Flat with an EPC rating of E. Currently, there is no transaction history available for this property.
157 Hadrian Court Garth Thirtythree, NE12 6DE, Killingworth Newcastle Upon Tyne
This is a 69 square meter Mid-floor Flat with an EPC rating of C. Currently, there is no transaction history available for this property.
164 Hadrian Court Garth Thirtythree, NE12 6DE, Killingworth Newcastle Upon Tyne
This is a 69 square meter Top-floor Flat with an EPC rating of E. Currently, there is no transaction history available for this property.
168 Hadrian Court Garth Thirtythree, NE12 6DE, Killingworth Newcastle Upon Tyne
This is a 69 square meter Top-floor Flat with an EPC rating of E. Currently, there is no transaction history available for this property.
159 Hadrian Court Garth Thirtythree, NE12 6DE, Killingworth Newcastle Upon Tyne
This is a 58 square meter Mid-floor Flat with an EPC rating of D. Currently, there is no transaction history available for this property.
Postcodes in Hadrian Court, Killingworth
Navigate through other locations in Hadrian Court, Killingworth, Newcastle Upon Tyne to see more property listings for sale or to rent.
Transport near NE12 6DE, Hadrian Court
-
 Cramlington Station
 -
Manors Station
-
Newcastle Station
-
Heworth Station
-
MetroCentre Station
-
Dunston Station
-
Blaydon Station
House price paid reports for NE12 6DE, Hadrian Court
Click on the buttons below to see price paid reports by year or property price:
- Price Paid By Year
Property Price Paid in NE12 6DE, Hadrian Court by Year
The average sold property price by year was:
| Year | Average Sold Price | Price Change |
Sold Properties
|
|---|---|---|---|
| 2018 | £62,500 | 30% |
1 Property |
| 2017 | £44,000 | -14% |
1 Property |
| 2012 | £50,000 | -38% |
1 Property |
| 2005 | £69,000 | 63% |
1 Property |
| 2000 | £25,500 | - |
1 Property |