
Houses for sale & to rent in NE29 7DN, Craster Road, Chirton, North Shields
House Prices in NE29 7DN, Craster Road, Chirton
Properties in NE29 7DN have no sales history available within the last 3 years. NE29 7DN is a postcode in Craster Road located in Chirton, an area in North Shields, North Tyneside, with 5 households².
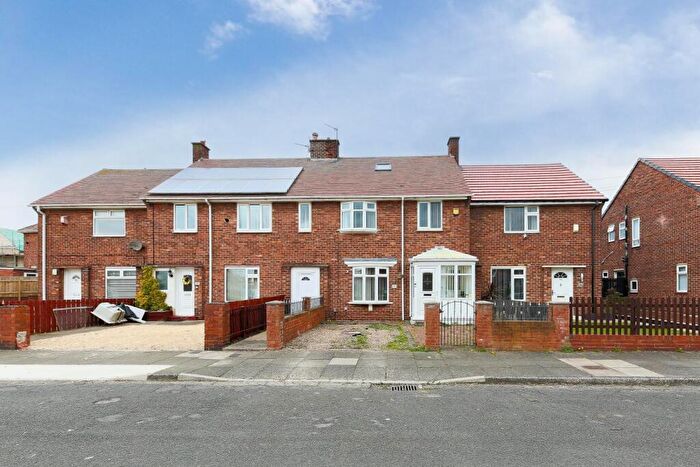
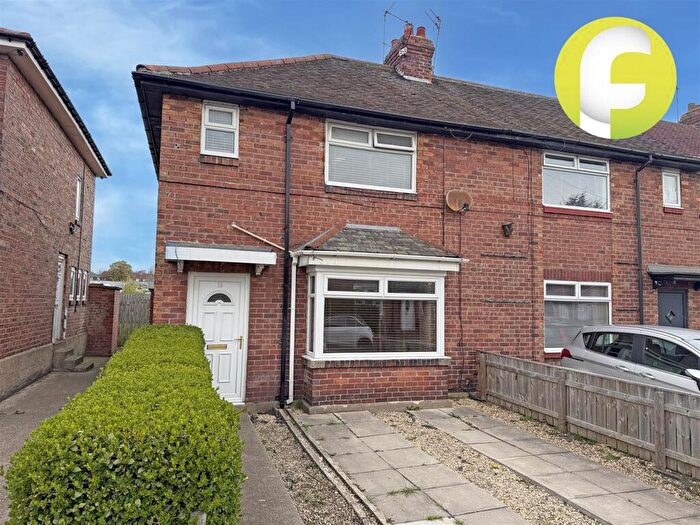
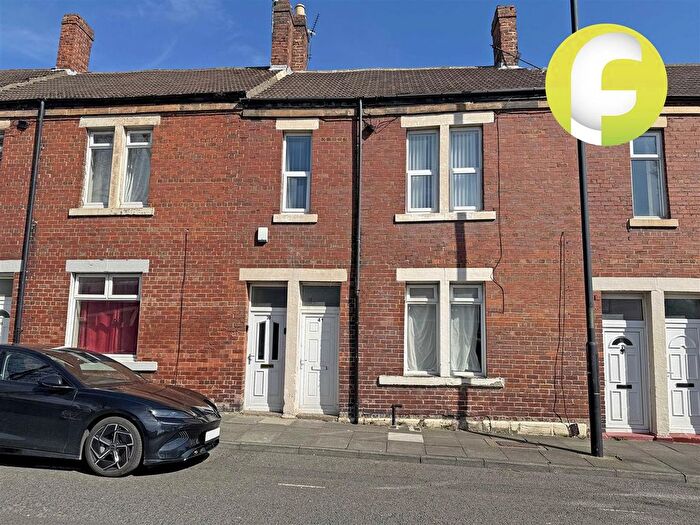
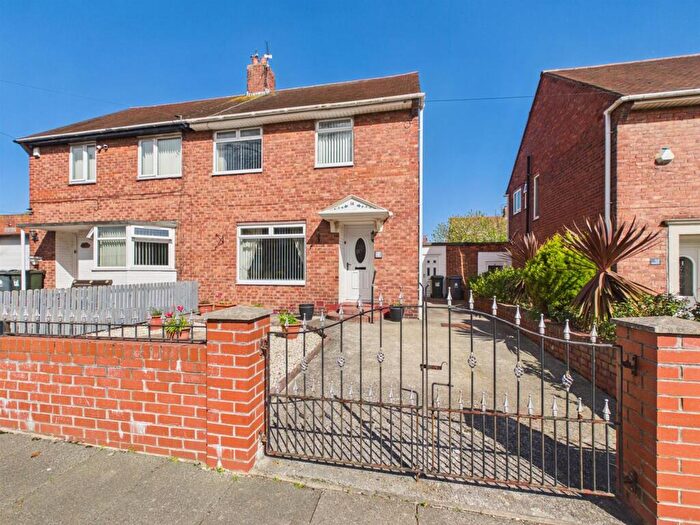
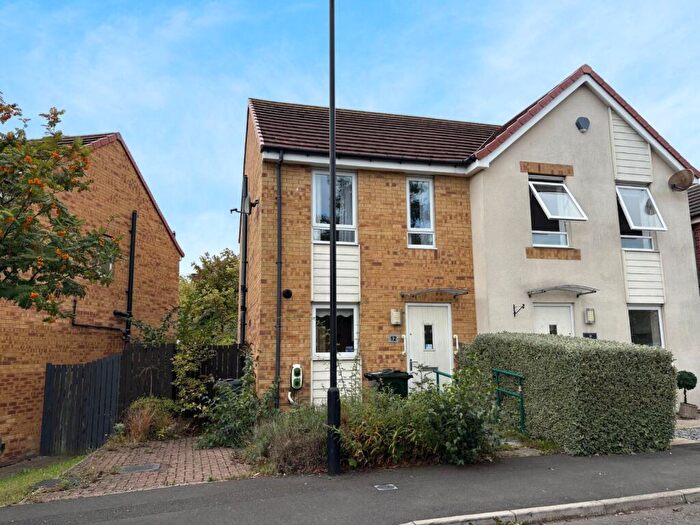
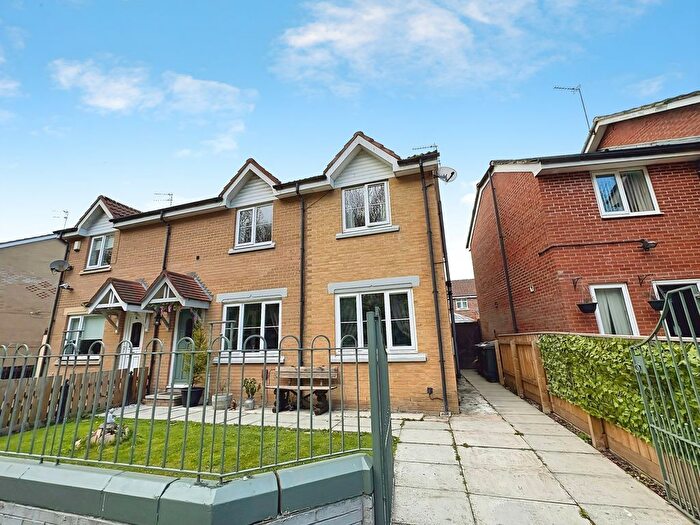
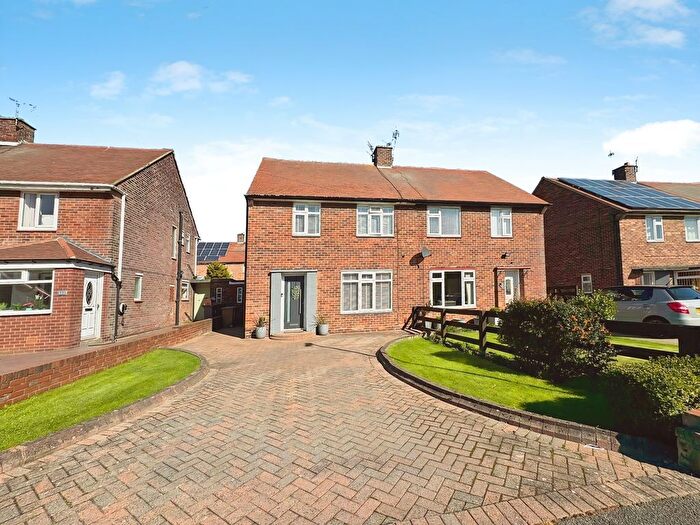
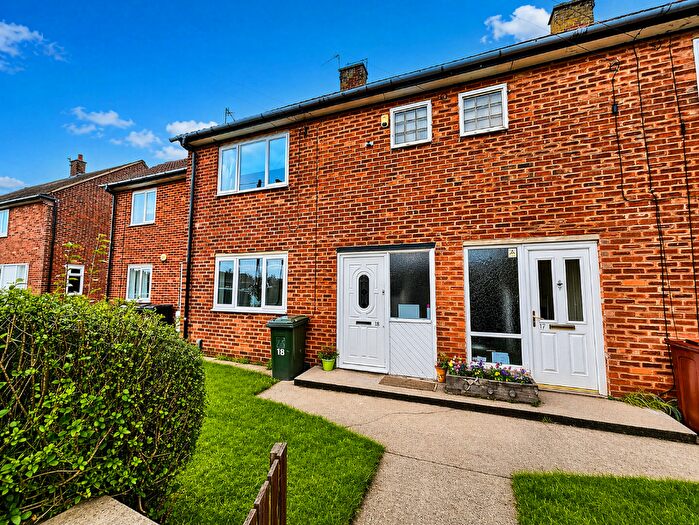
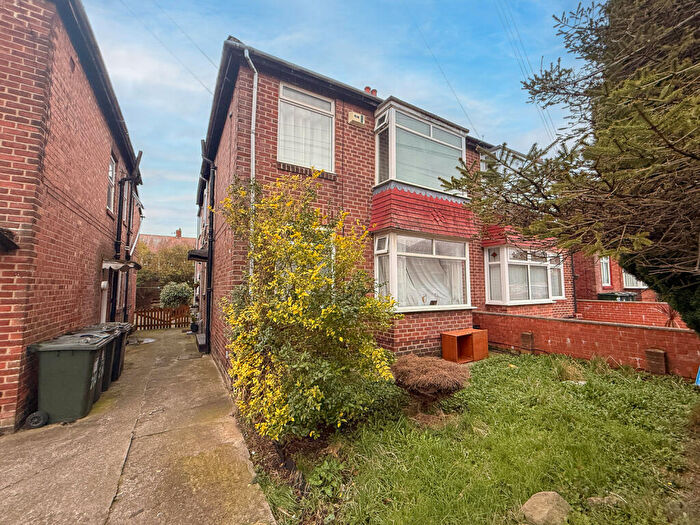
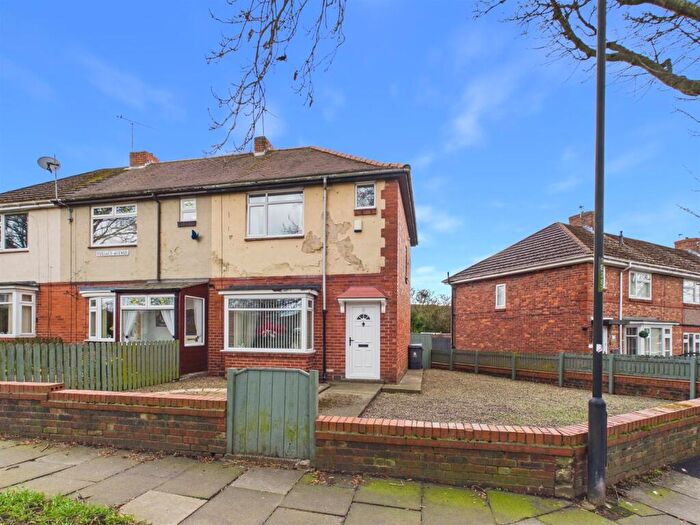
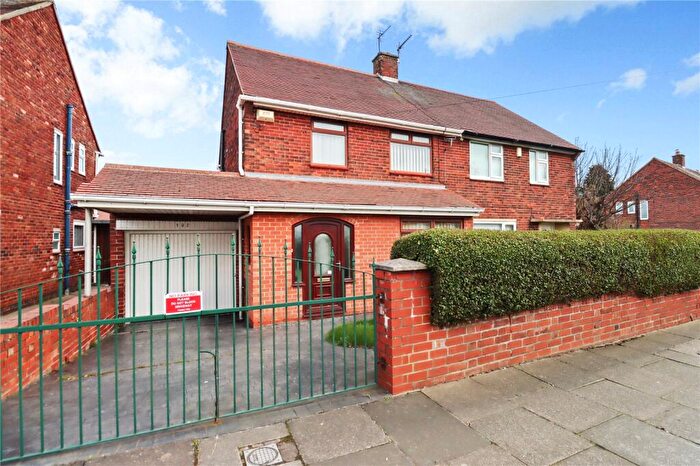
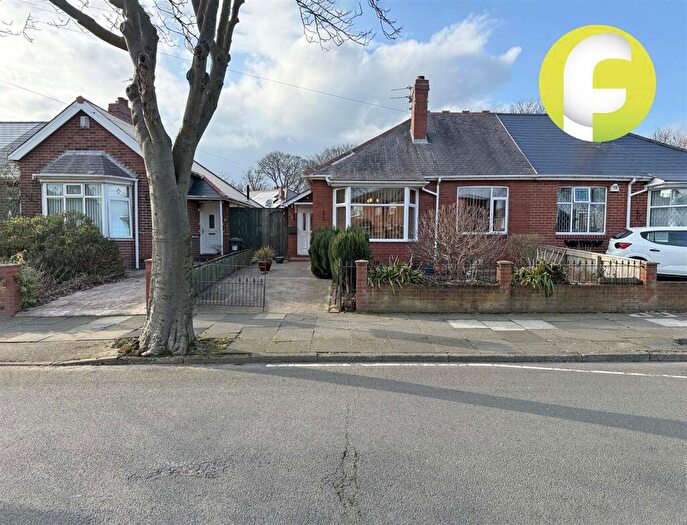
Properties for sale near NE29 7DN, Craster Road

![]()
If you are looking to sell your house, let it out, or receive a property valuation, an expert can help you.
Click the button below to get started.


Price Paid in Craster Road, NE29 7DN, Chirton
3 Craster Road, NE29 7DN, Chirton North Shields
Property 3 has been sold 4 times. The last time it was sold was in 19/12/2022 and the sold price was £95,000.00.
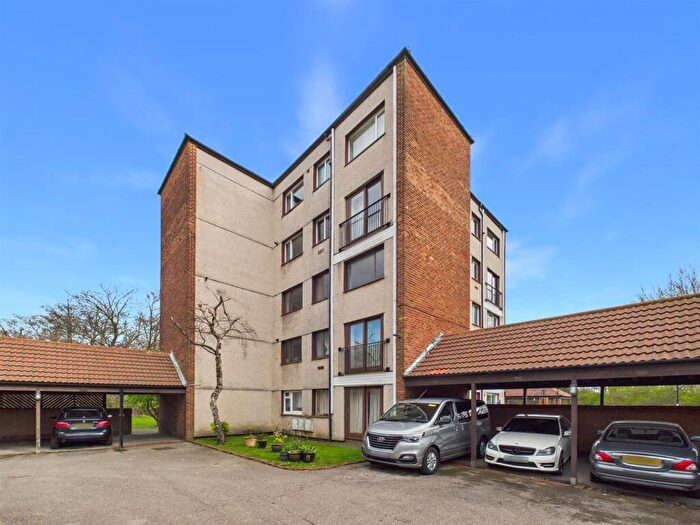
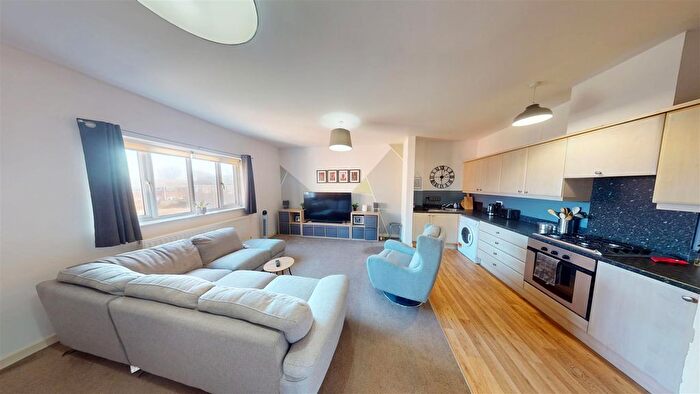
This flat, sold as a leasehold on 19/12/2022, is a 67 sqm ground-floor flat with an EPC rating of C.
| Date | Price | Property Type | Tenure | Classification |
|---|---|---|---|---|
| 19/12/2022 | £95,000.00 | Flat | leasehold | Established Building |
| 14/12/2012 | £77,500.00 | Flat | leasehold | Established Building |
| 17/11/2009 | £68,000.00 | Flat | leasehold | Established Building |
| 26/09/1997 | £25,000.00 | Flat | leasehold | Established Building |
1 Craster Road, NE29 7DN, Chirton North Shields
Property 1 has been sold 1 time. The last time it was sold was in 17/11/2009 and the sold price was £68,000.00.
This is a Flat which was sold as a freehold in 17/11/2009
| Date | Price | Property Type | Tenure | Classification |
|---|---|---|---|---|
| 17/11/2009 | £68,000.00 | Flat | freehold | Established Building |
2 Craster Road, NE29 7DN, Chirton North Shields
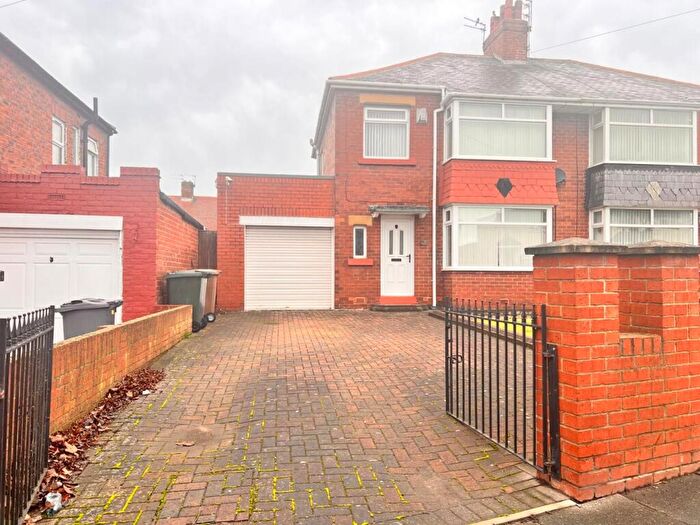
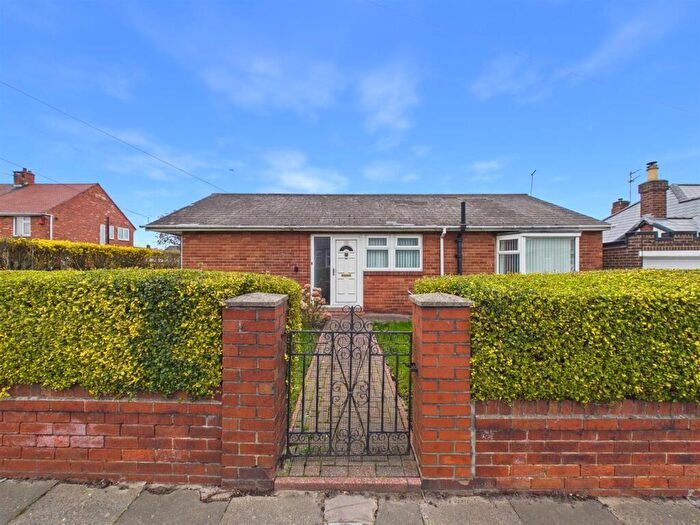
This is a 82 square meter Semi-detached House with an EPC rating of C. Currently, there is no transaction history available for this property.
Transport near NE29 7DN, Craster Road
-
 Heworth Station
 -
Manors Station
-
Newcastle Station
-
Cramlington Station
-
Dunston Station
-
Sunderland Station
-
MetroCentre Station
-
Blaydon Station
House price paid reports for NE29 7DN, Craster Road
Click on the buttons below to see price paid reports by year or property price:
- Price Paid By Year
Property Price Paid in NE29 7DN, Craster Road by Year
The average sold property price by year was:
| Year | Average Sold Price | Price Change |
Sold Properties
|
|---|---|---|---|
| 2022 | £95,000 | 18% |
1 Property |
| 2012 | £77,500 | 12% |
1 Property |
| 2009 | £68,000 | 63% |
2 Properties |
| 1997 | £25,000 | - |
1 Property |