
Houses for sale & to rent in NE30 4RD, Newcastle Terrace, Tynemouth, North Shields
House Prices in NE30 4RD, Newcastle Terrace, Tynemouth
Properties in NE30 4RD have no sales history available within the last 3 years. NE30 4RD is a postcode in Newcastle Terrace located in Tynemouth, an area in North Shields, North Tyneside, with 10 households².
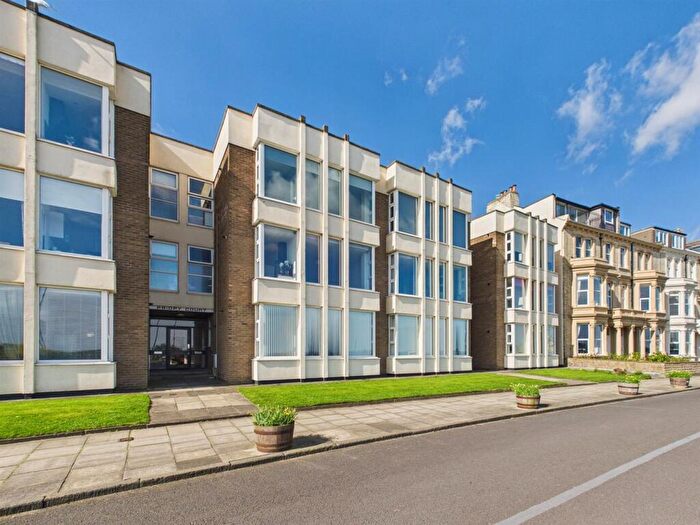
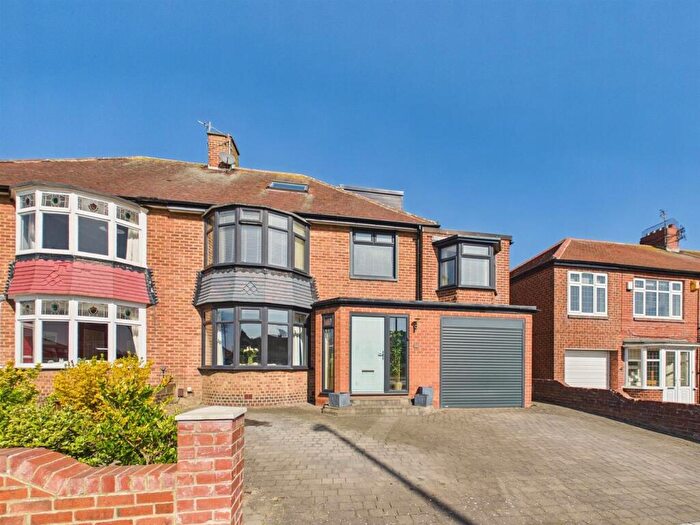
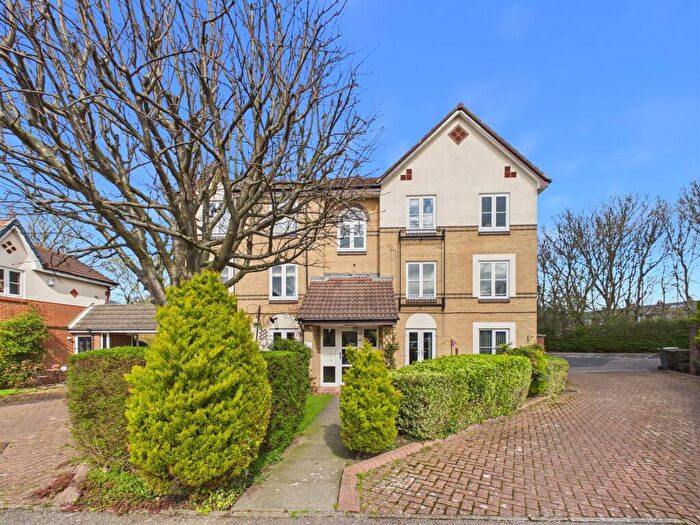
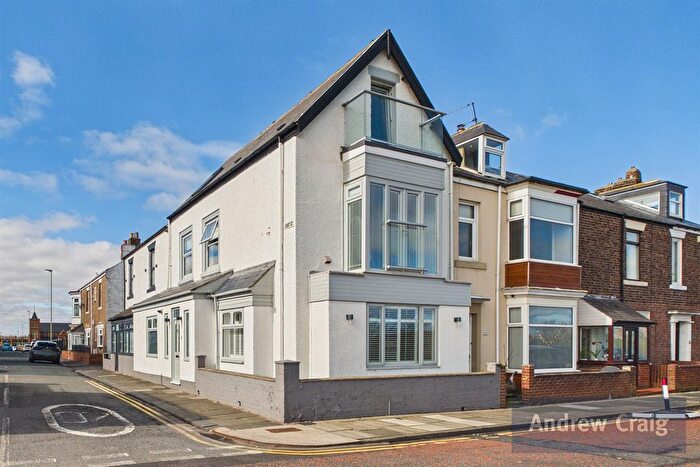
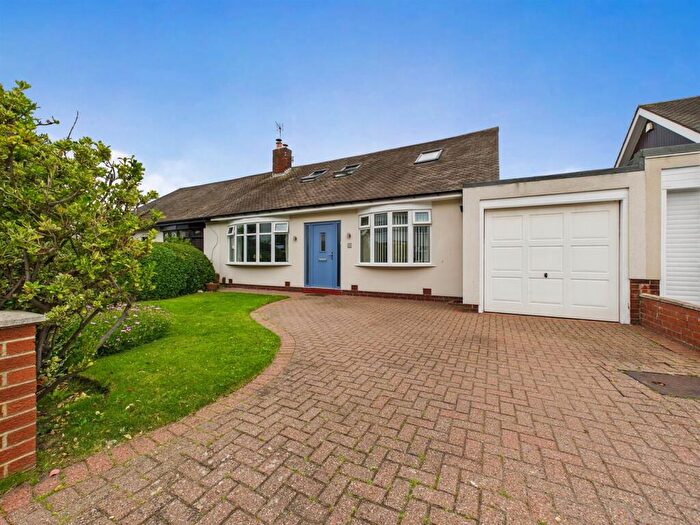
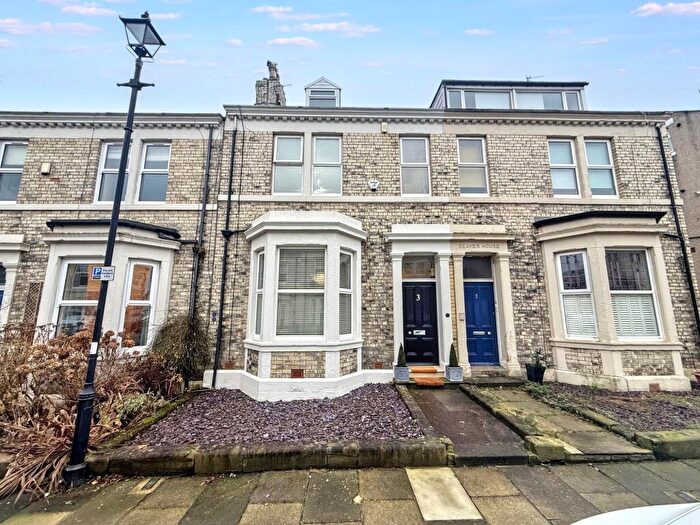
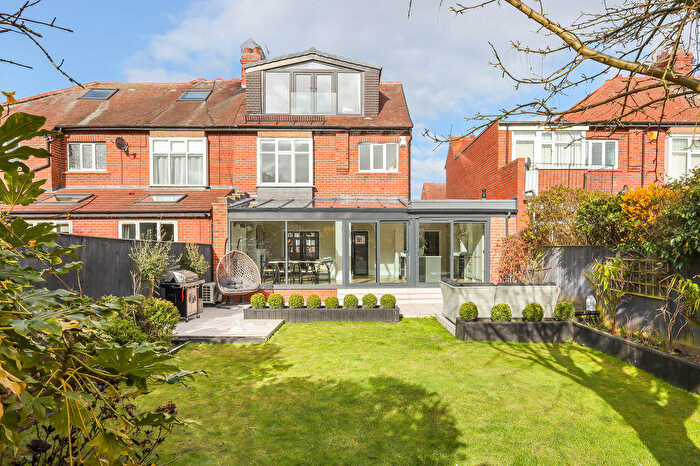
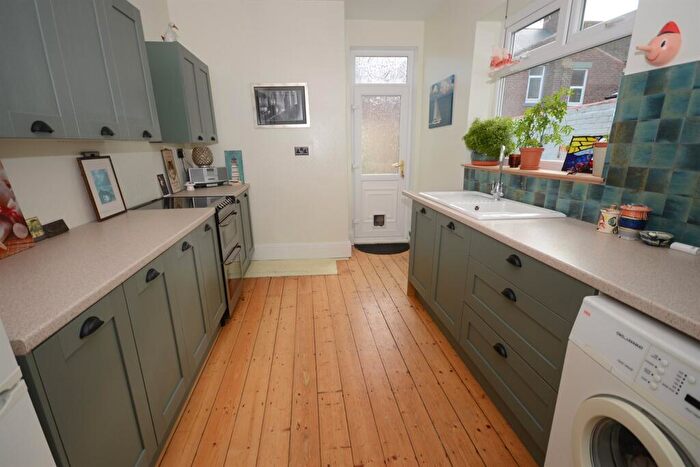
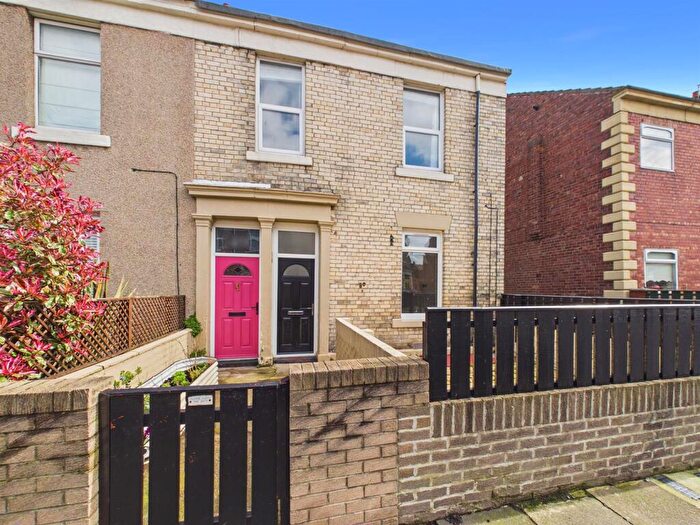
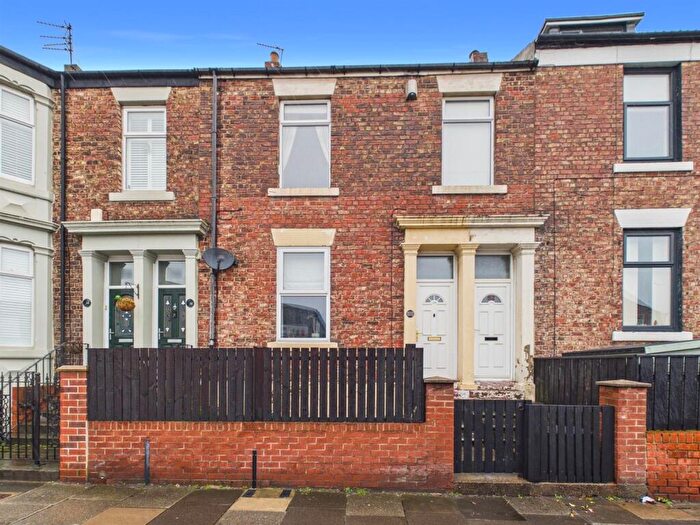
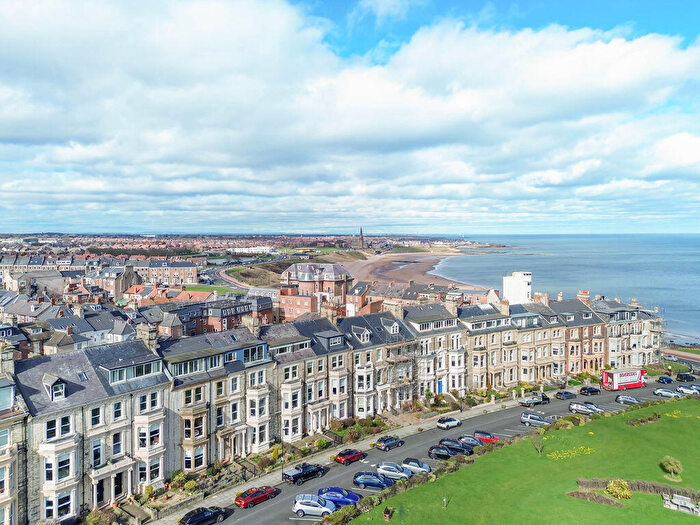
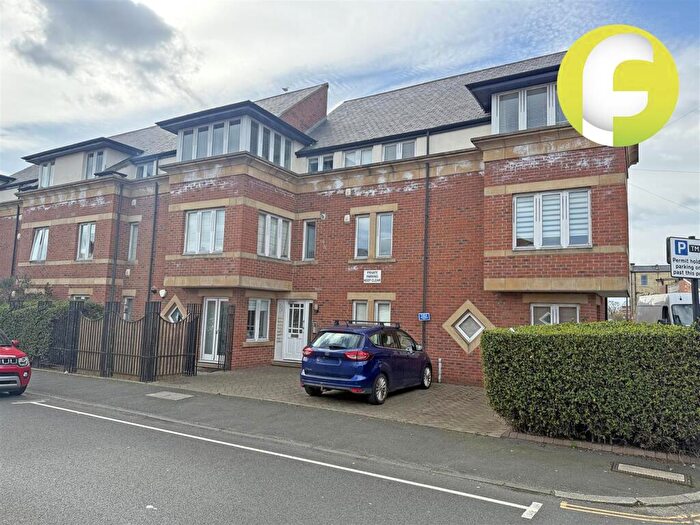
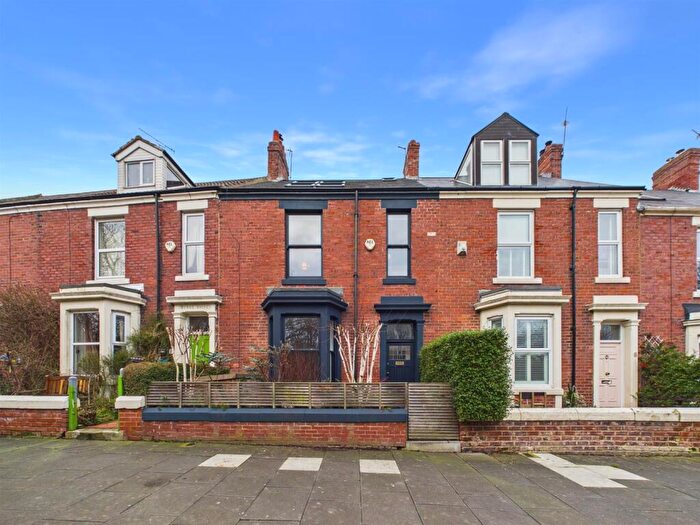
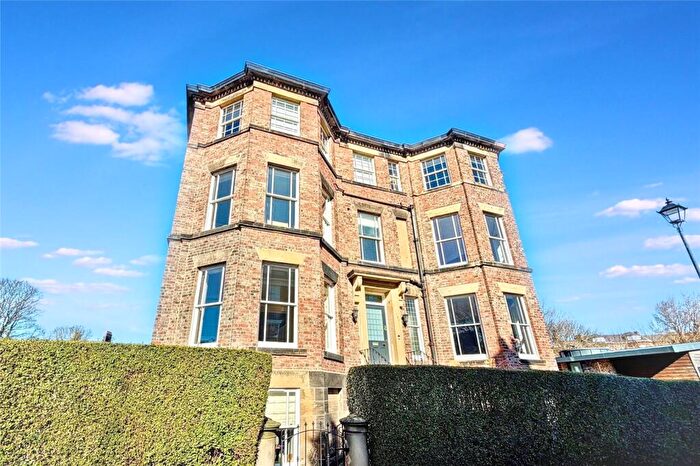
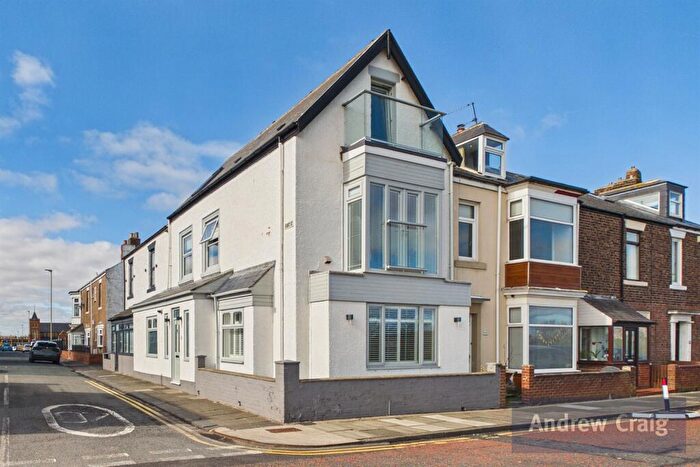
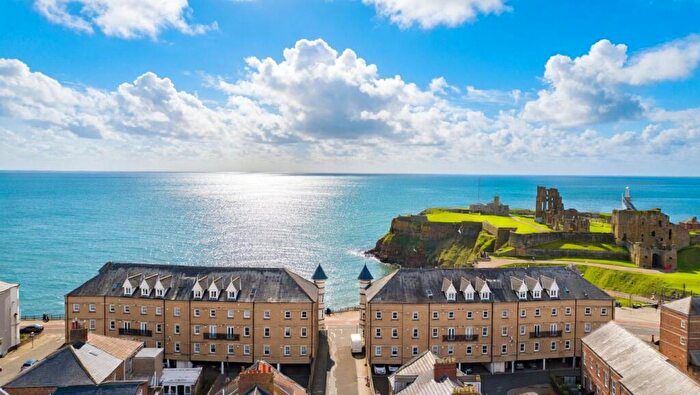
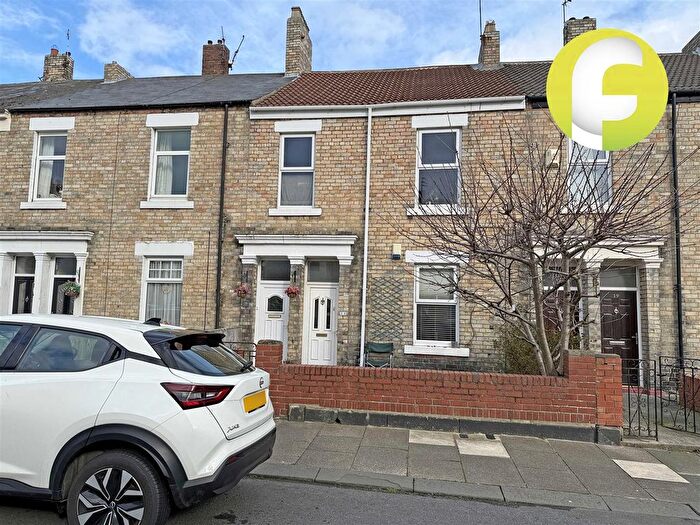
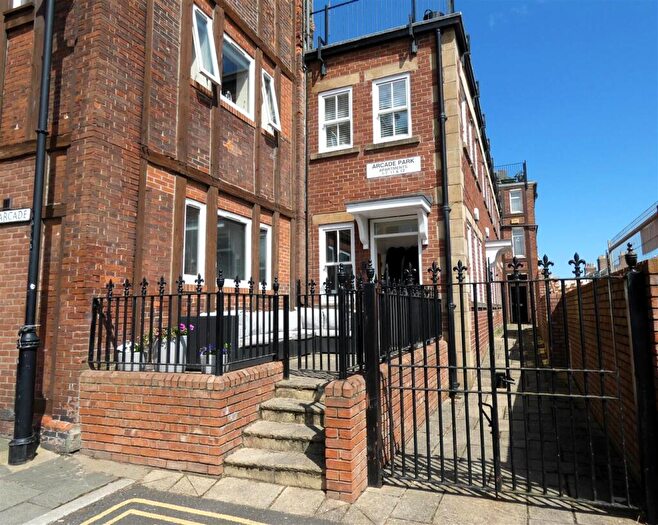
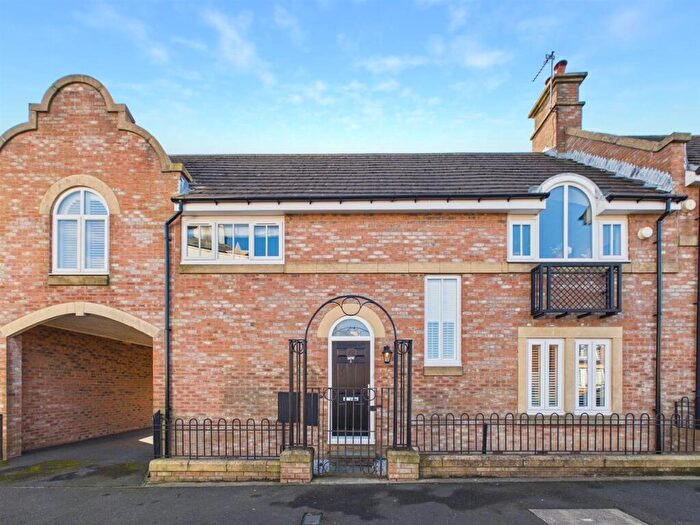
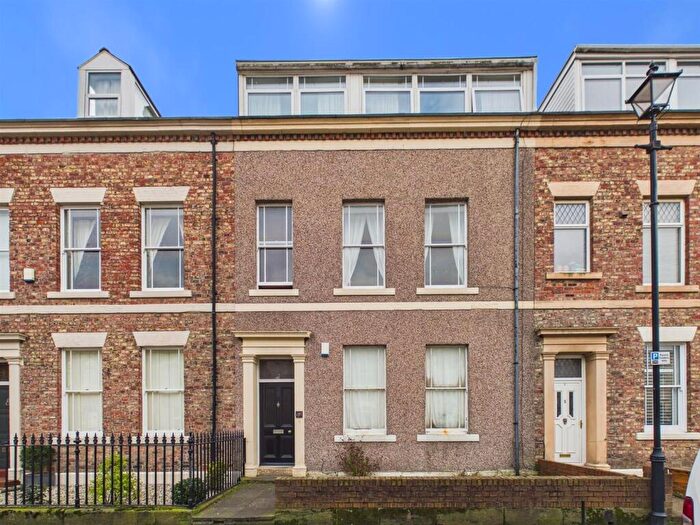
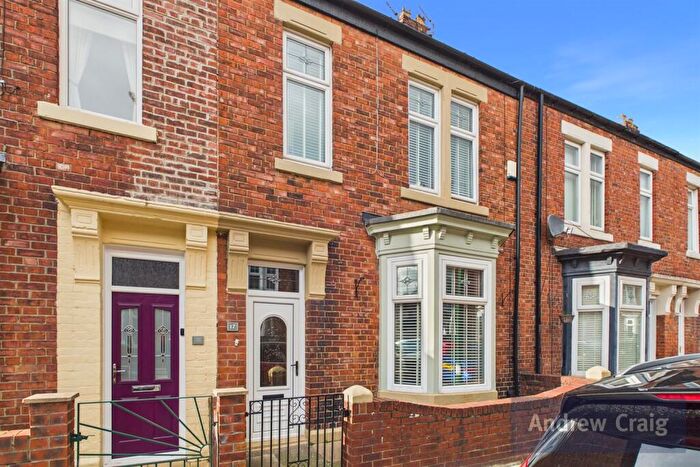
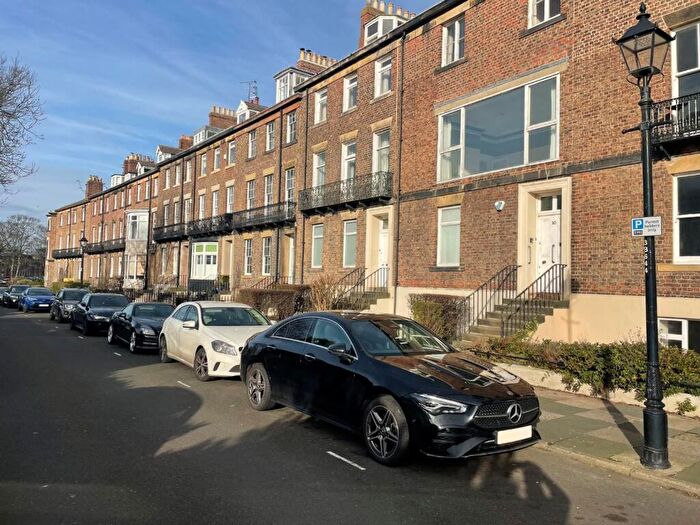
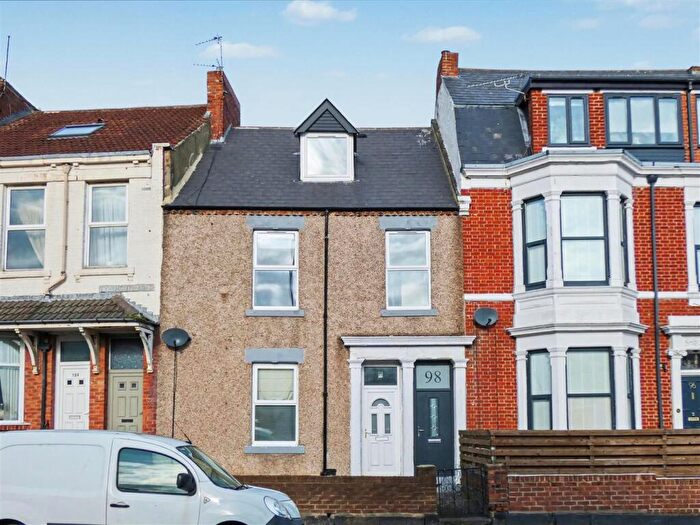
Properties for sale near NE30 4RD, Newcastle Terrace
![]()
If you are looking to sell your house, let it out, or receive a property valuation, an expert can help you.
Click the button below to get started.

Price Paid in Newcastle Terrace, NE30 4RD, Tynemouth
2 FLAT A Newcastle Terrace, NE30 4RD, Tynemouth North Shields
Property 2 FLAT A has been sold 5 times. The last time it was sold was in 04/11/2022 and the sold price was £190,000.00.
This flat, sold as a leasehold on 04/11/2022, is a 52 sqm top-floor flat with an EPC rating of E.
| Date | Price | Property Type | Tenure | Classification |
|---|---|---|---|---|
| 04/11/2022 | £190,000.00 | Flat | leasehold | Established Building |
| 07/09/2007 | £150,000.00 | Flat | leasehold | Established Building |
| 28/09/2001 | £71,000.00 | Flat | leasehold | Established Building |
| 20/10/1997 | £40,000.00 | Flat | leasehold | Established Building |
| 26/04/1995 | £36,000.00 | Flat | leasehold | Established Building |
2 FLAT D Newcastle Terrace, NE30 4RD, Tynemouth North Shields
Property 2 FLAT D has been sold 1 time. The last time it was sold was in 04/05/2018 and the sold price was £167,000.00.
This flat, sold as a leasehold on 04/05/2018, is a 52 sqm top-floor flat with an EPC rating of E.
| Date | Price | Property Type | Tenure | Classification |
|---|---|---|---|---|
| 04/05/2018 | £167,000.00 | Flat | leasehold | Established Building |
Transport near NE30 4RD, Newcastle Terrace
-
 Heworth Station
 -
Manors Station
-
Sunderland Station
-
Newcastle Station
-
Cramlington Station
-
Dunston Station
House price paid reports for NE30 4RD, Newcastle Terrace
Click on the buttons below to see price paid reports by year or property price:
- Price Paid By Year
Property Price Paid in NE30 4RD, Newcastle Terrace by Year
The average sold property price by year was:
| Year | Average Sold Price | Price Change |
Sold Properties
|
|---|---|---|---|
| 2022 | £190,000 | 12% |
1 Property |
| 2018 | £167,000 | 10% |
1 Property |
| 2007 | £150,000 | 53% |
1 Property |
| 2001 | £71,000 | 44% |
1 Property |
| 1997 | £40,000 | 10% |
1 Property |
| 1995 | £36,000 | - |
1 Property |