
Houses for sale & to rent in Hurworth, Darlington
House Prices in Hurworth
Properties in Hurworth have an average house price of £265k and had 182 Property Transactions within the last 3 years¹.
Hurworth is an area in Darlington, Darlington with 1,601 households², where the most expensive property was sold for £890k.
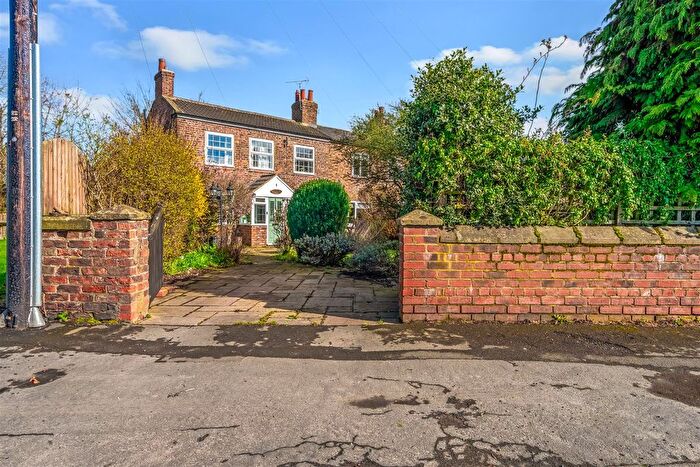
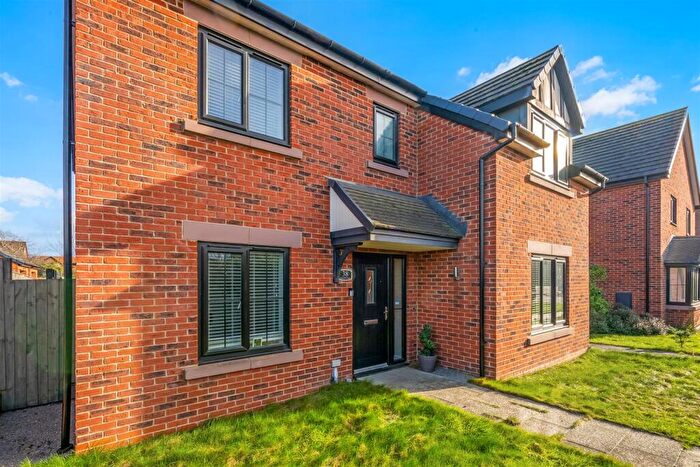
Properties for sale in Hurworth
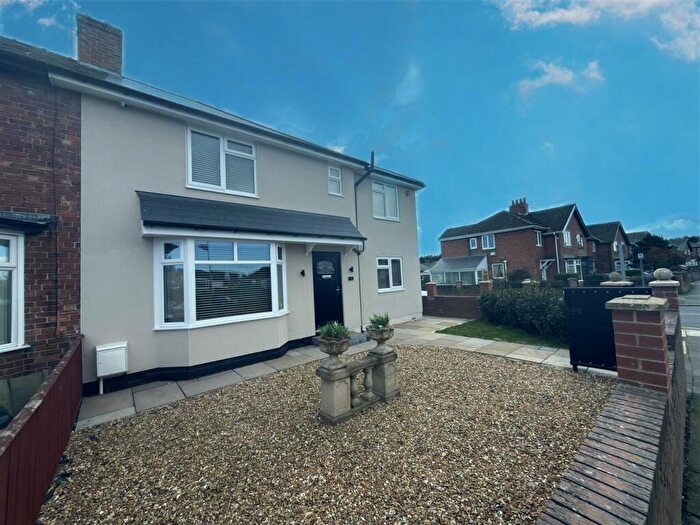
![]()
If you are looking to sell your house, let it out, or receive a property valuation, an expert can help you.
Click the button below to get started.
Roads and Postcodes in Hurworth
Navigate through our locations to find the location of your next house in Hurworth, Darlington for sale or to rent.
| Streets | Postcodes |
|---|---|
| Appletree Close | DL2 2BE |
| Ashville Drive | DL2 2JL |
| Avon Road | DL2 2HF |
| Bank Top Cottages | DL2 2DP |
| Banks Terrace | DL2 2DE |
| Baxby Terrace | DL2 2DN |
| Belgrave Terrace | DL2 2DW |
| Blackthorn Drive | DL2 2FU |
| Blind Lane | DL2 2JB |
| Bridge Road | DL3 8TJ |
| Bryan Close | DL2 2AS |
| Burma Road | DL2 1QF DL2 1PZ |
| Calder Avenue | DL2 2BY |
| Cedar Mews | DL2 2HU |
| Chase End | DL2 2JH |
| Church Row | DL2 2AQ |
| Church View | DL2 2AF DL2 2BS |
| Coach Lane | DL2 2AE |
| Collyers Close | DL2 2ES |
| Creebeck Drive | DL2 2JT |
| Croft Road | DL2 2HD DL2 2JF DL2 2SD DL2 2JE DL2 2JG DL2 2SE DL3 8TL |
| Crossfield Close | DL2 2EW |
| Dale Close | DL2 2EN |
| Dibdale Road | DL2 1PF |
| Eamont Drive | DL2 2BT |
| Eden Close | DL2 2HN |
| Elmfield Road | DL2 2JJ |
| Emerson Road | DL2 2AP DL2 2AW |
| Emery Close | DL2 2EJ |
| Evesham Grove | DL2 2YE |
| Foss Court | DL2 2BX |
| Fox Close | DL2 2HG |
| Friars Pardon | DL2 2DZ DL2 2EA |
| Grange Avenue | DL2 2HE |
| Greenfield Close | DL2 2EH |
| Greenside Court | DL2 2HS |
| Hawkswood | DL2 2HL |
| Hornby Close | DL2 2EL |
| Hunters Close | DL2 2HR |
| Hurworth Place | DL2 2DU |
| Hurworth Road | DL2 1PE DL2 1QW DL2 2BW DL2 2DA DL2 2DF DL2 2DG DL2 2BN |
| Linden Court | DL2 2DL |
| Linden Drive | DL2 2DJ |
| Lychgate | DL2 2AT |
| Malvern Close | DL2 2EU |
| Manor Road | DL2 2HH DL2 2HJ |
| Manorfields | DL2 2BG |
| Meadowbank Close | DL2 2HZ |
| Minster Walk | DL2 2AR |
| Mowbray Drive | DL2 2EZ |
| Neasham Covert | DL2 1PQ |
| Neasham Hill | DL2 1PJ DL2 1QY |
| Neasham Road | DL2 1DP DL2 1DW DL2 2BA DL2 1PY DL2 2AY DL2 2AZ |
| Nent Way | DL2 2BZ |
| New Lane | DL2 1QR |
| Paddock Lane | DL2 2BU |
| Peaceful Valley | DL2 2DB |
| Pilmore Mews | DL2 2BQ |
| Railway Cottages | DL2 1QA |
| Railway Terrace | DL2 2DD |
| Rockliffe Court | DL2 2BJ DL2 2DR DL2 2DS |
| Roundhill Close | DL2 2EB |
| Roundhill Road | DL2 2DX DL2 2DY DL2 2ED DL2 2EF |
| Sanderson Road | DL2 2AU |
| Snipe Lane | DL2 1QB DL2 2SA |
| Sockburn Lane | DL2 1PH DL2 1QX |
| Southfield Close | DL2 2ER |
| Strait Lane | DL2 1QJ DL2 2AH DL2 2AL DL2 2AN |
| Sycamore Close | DL2 2EY |
| Tees View | DL2 2DH DL2 2DQ |
| Teesway | DL2 1QP DL2 1QT DL2 1QU |
| The Birches | DL2 2BD |
| The Chase | DL2 2JQ |
| The Close | DL2 1PS |
| The Gables | DL2 2AG |
| The Green | DL2 2AA DL2 2HA DL2 2JA |
| The Lanes | DL2 2BF |
| The Oval | DL2 2AX |
| The Wayside | DL2 2EE |
| Timmys Lane | DL2 2AJ |
| West End | DL2 2HB DL2 2JD |
| Westfield Drive | DL2 2EP DL2 2EQ DL2 2ET DL2 2AD DL2 2EX |
| Woodlands Way | DL2 2HP DL2 2HQ DL2 2HW |
| Yew Tree Close | DL2 2HX |
| DL2 1QD DL2 1QG DL2 1QH DL2 1QL DL2 2JN DL2 1DN DL2 1PG DL2 1QE DL2 1QN DL2 1QQ DL2 1QS DL2 2EG DL2 2JU DL2 2SB |
Transport near Hurworth

- FAQ
- Price Paid By Year
- Property Type Price
Frequently asked questions about Hurworth
What is the average price for a property for sale in Hurworth?
The average price for a property for sale in Hurworth is £265,344. This amount is 62% higher than the average price in Darlington. There are 1,565 property listings for sale in Hurworth.
What streets have the most expensive properties for sale in Hurworth?
The streets with the most expensive properties for sale in Hurworth are West End at an average of £528,750, New Lane at an average of £468,333 and The Wayside at an average of £404,166.
What streets have the most affordable properties for sale in Hurworth?
The streets with the most affordable properties for sale in Hurworth are Foss Court at an average of £111,900, The Lanes at an average of £145,324 and Calder Avenue at an average of £146,666.
Which train stations are available in or near Hurworth?
Some of the train stations available in or near Hurworth are Darlington, Dinsdale and North Road.
Property Price Paid in Hurworth by Year
The average sold property price by year was:
| Year | Average Sold Price | Price Change |
Sold Properties
|
|---|---|---|---|
| 2026 | £141,000 | -98% |
1 Property |
| 2025 | £279,046 | 8% |
65 Properties |
| 2024 | £257,771 | -1% |
49 Properties |
| 2023 | £259,445 | -24% |
67 Properties |
| 2022 | £321,419 | 6% |
110 Properties |
| 2021 | £301,189 | 0,4% |
120 Properties |
| 2020 | £299,879 | 14% |
93 Properties |
| 2019 | £258,602 | 20% |
84 Properties |
| 2018 | £206,905 | -10% |
50 Properties |
| 2017 | £227,955 | 3% |
59 Properties |
| 2016 | £220,998 | 10% |
58 Properties |
| 2015 | £198,365 | -13% |
41 Properties |
| 2014 | £224,867 | 18% |
81 Properties |
| 2013 | £183,999 | 7% |
51 Properties |
| 2012 | £172,014 | -9% |
62 Properties |
| 2011 | £187,582 | 5% |
54 Properties |
| 2010 | £178,309 | 0,3% |
66 Properties |
| 2009 | £177,849 | -8% |
45 Properties |
| 2008 | £192,267 | -4% |
47 Properties |
| 2007 | £199,157 | 7% |
66 Properties |
| 2006 | £184,806 | -9% |
68 Properties |
| 2005 | £201,647 | 5% |
40 Properties |
| 2004 | £190,785 | 26% |
54 Properties |
| 2003 | £140,839 | 9% |
66 Properties |
| 2002 | £127,597 | 29% |
86 Properties |
| 2001 | £91,225 | -15% |
53 Properties |
| 2000 | £105,221 | 15% |
58 Properties |
| 1999 | £89,112 | 5% |
60 Properties |
| 1998 | £84,588 | 6% |
47 Properties |
| 1997 | £79,417 | -2% |
64 Properties |
| 1996 | £81,331 | 16% |
55 Properties |
| 1995 | £68,459 | - |
46 Properties |
Property Price per Property Type in Hurworth
Here you can find historic sold price data in order to help with your property search.
The average Property Paid Price for specific property types in the last three years are:
| Property Type | Average Sold Price | Sold Properties |
|---|---|---|
| Semi Detached House | £216,929.00 | 71 Semi Detached Houses |
| Detached House | £339,397.00 | 70 Detached Houses |
| Terraced House | £222,751.00 | 41 Terraced Houses |