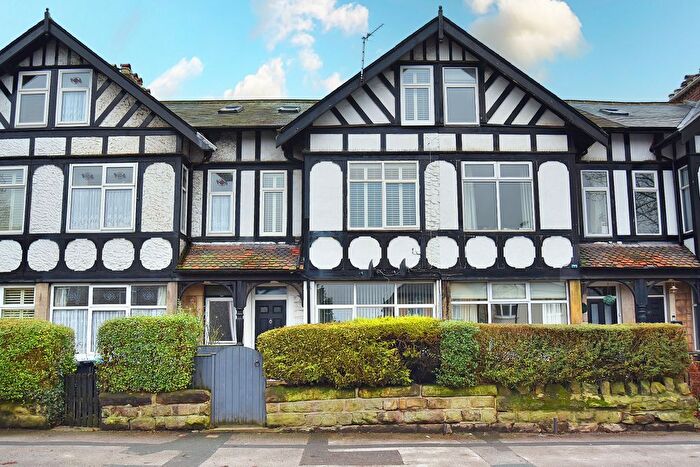
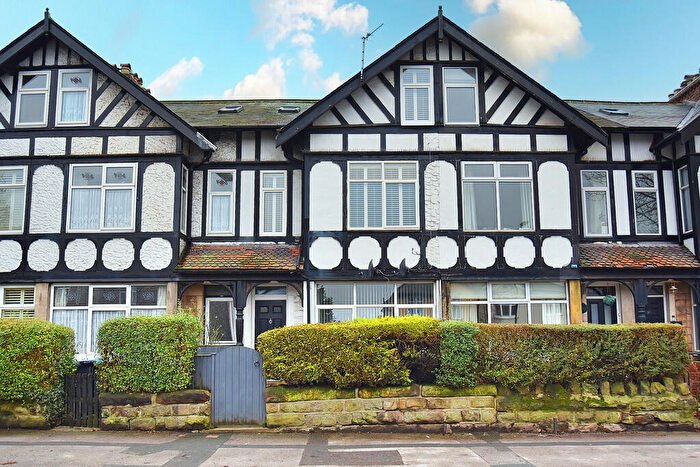
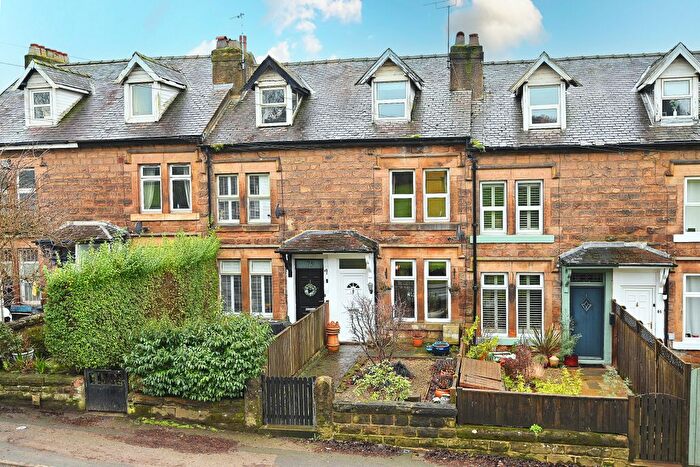
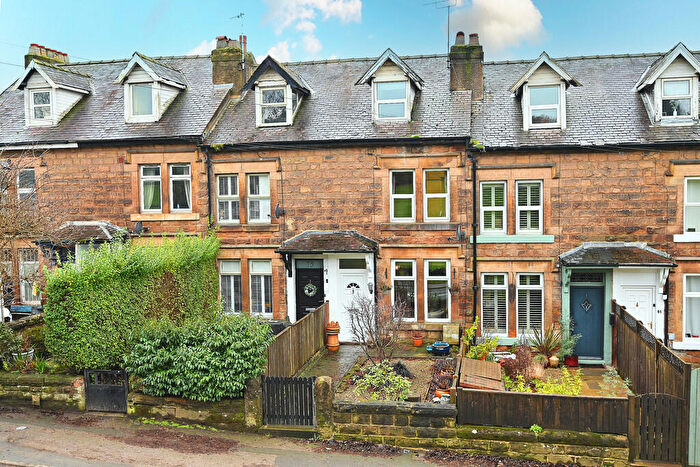
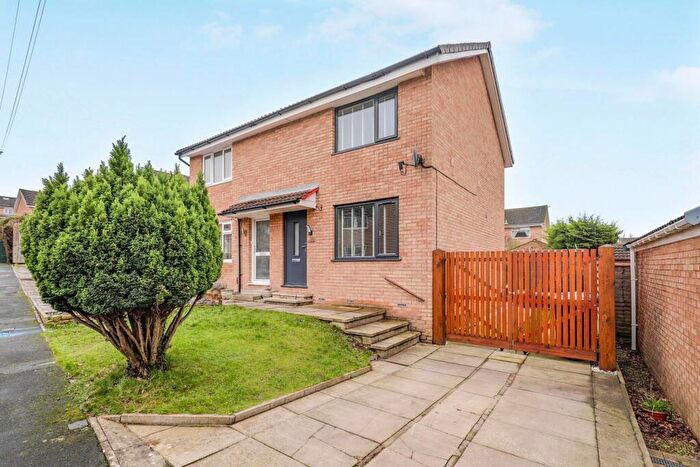
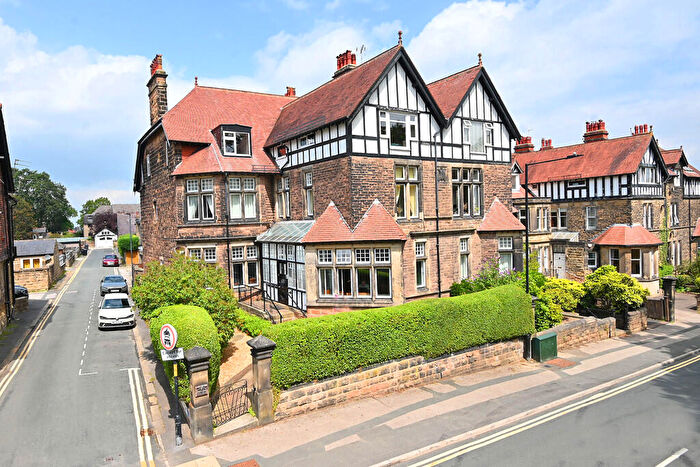
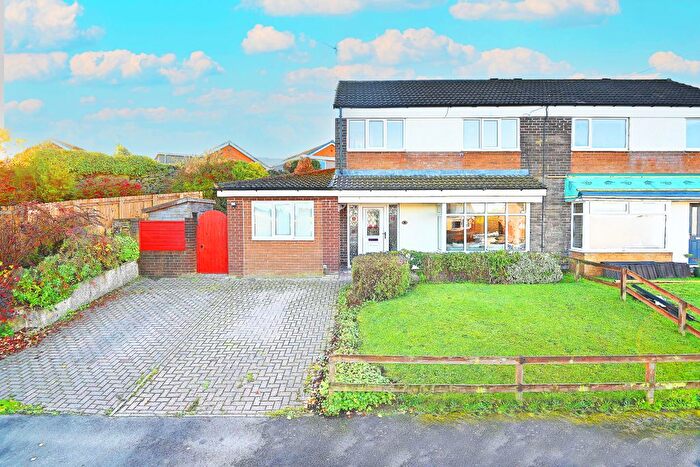
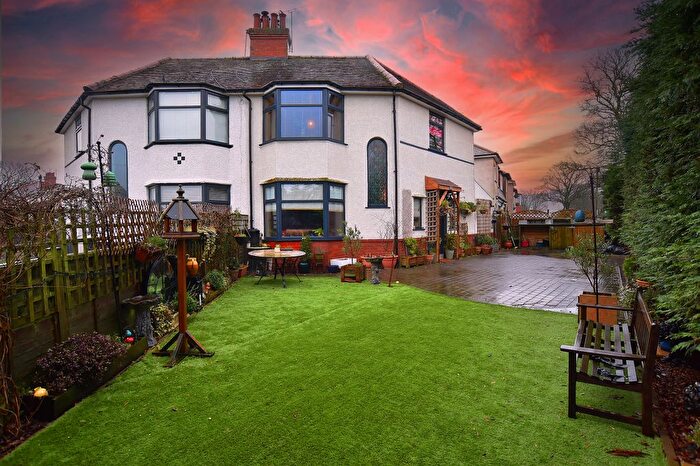
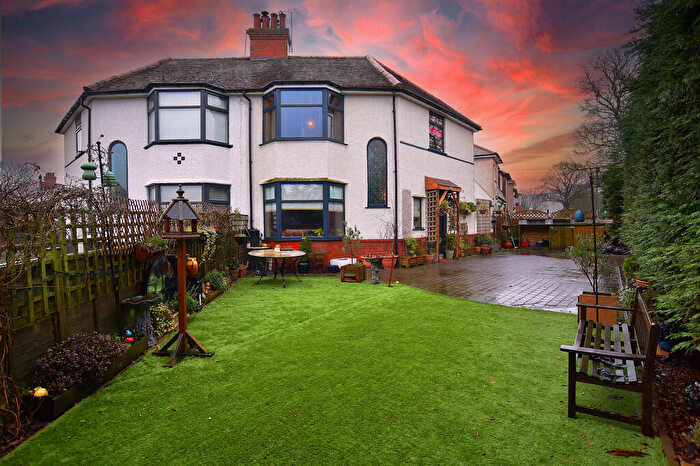
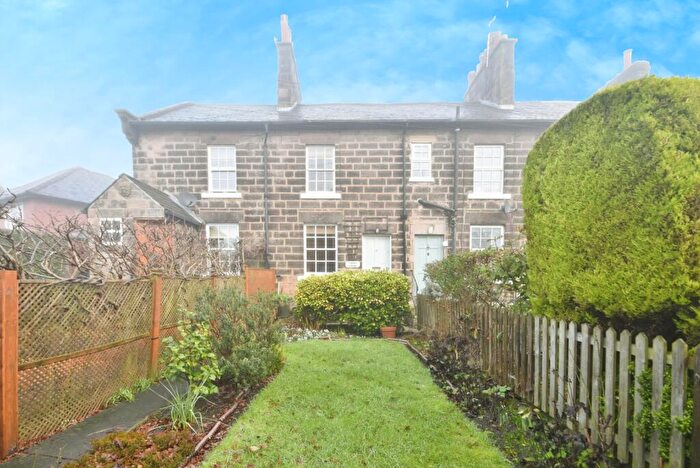
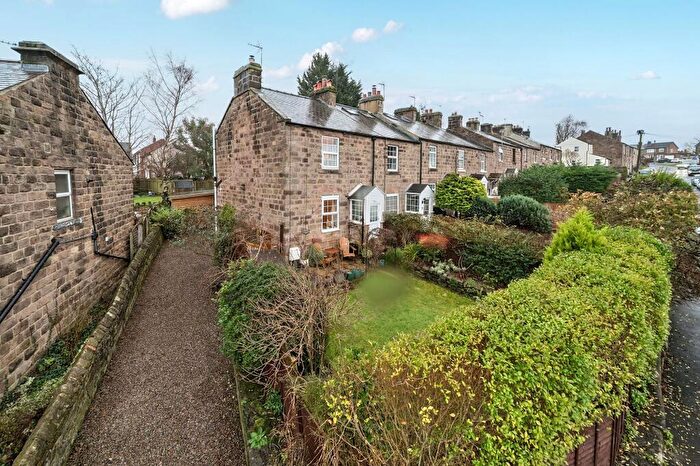
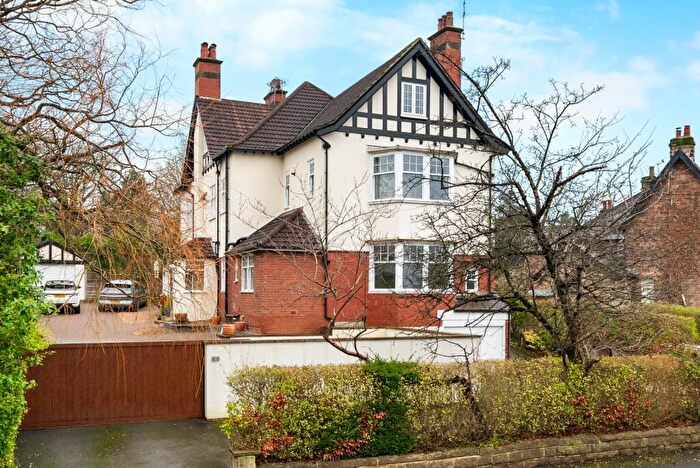
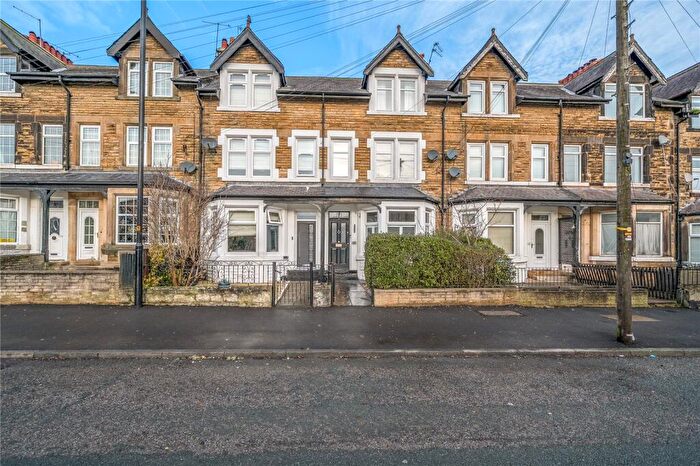
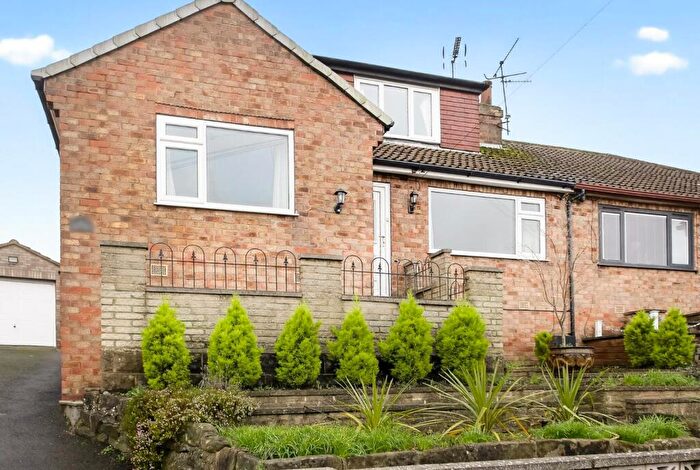
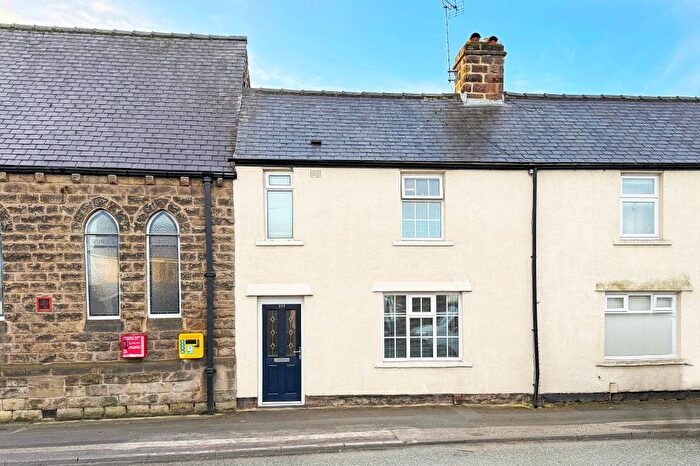
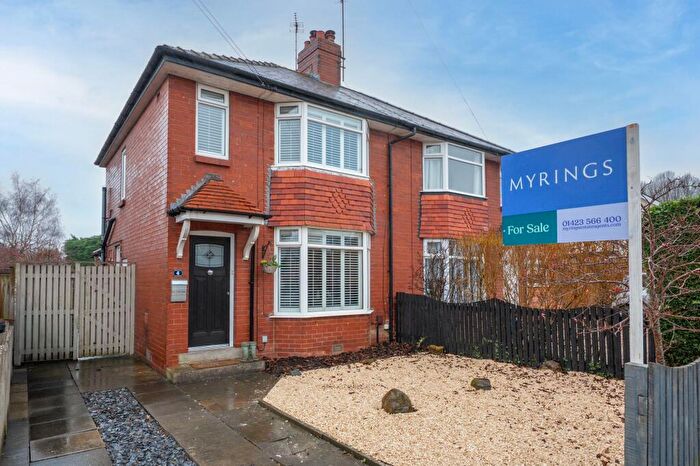
Houses for sale & to rent in New Park, Harrogate
House Prices in New Park
Properties in New Park have an average house price of £248,179.00 and had 275 Property Transactions within the last 3 years¹.
New Park is an area in Harrogate, North Yorkshire with 2,423 households², where the most expensive property was sold for £720,000.00.
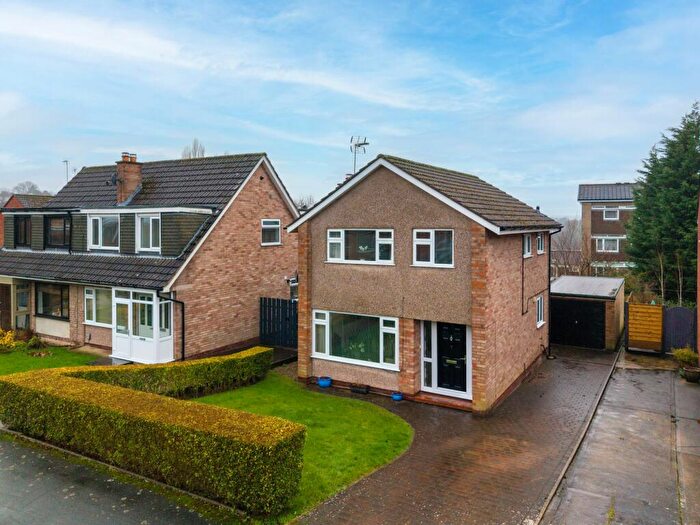
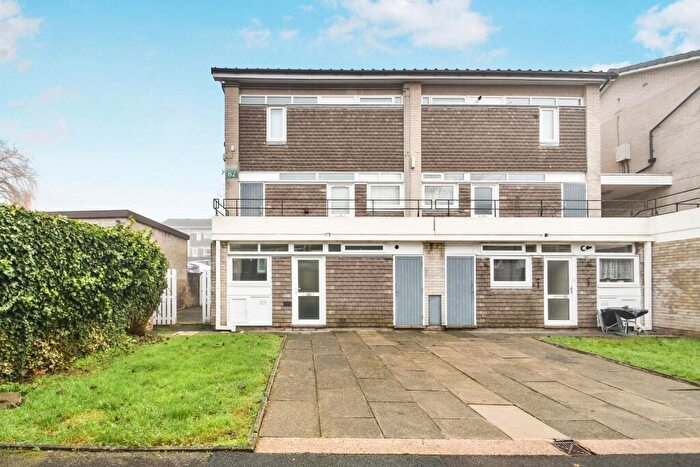
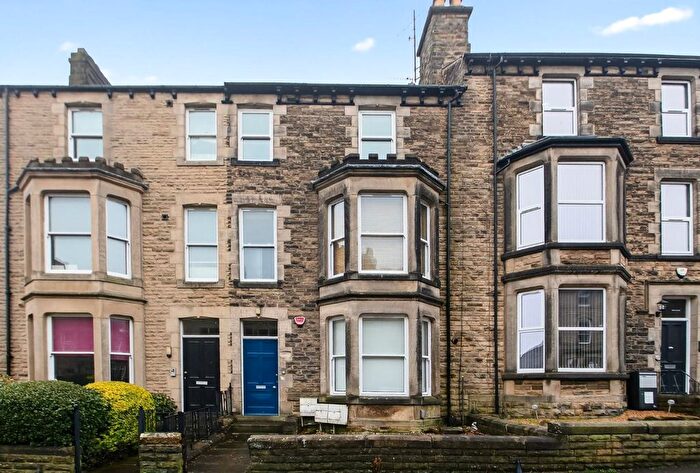
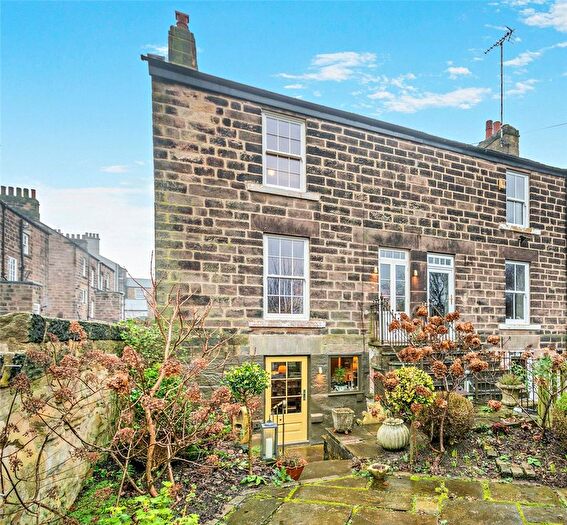
Properties for sale in New Park
Roads and Postcodes in New Park
Navigate through our locations to find the location of your next house in New Park, Harrogate for sale or to rent.
| Streets | Postcodes |
|---|---|
| Archie Street | HG1 2DD |
| Back Chatsworth Grove | HG1 2AF |
| Back Dawson Terrace | HG1 2AJ |
| Back Unity Grove | HG1 2AL |
| Baldwin Street | HG1 2DE |
| Bewerley Road | HG1 2AX |
| Bilton Drive | HG1 2AH |
| Burnside Close | HG1 2BQ |
| Burnside Drive | HG1 2BH |
| Burnside Road | HG1 2BG |
| Burnside Walk | HG1 2BE |
| Chatsworth Grove | HG1 2AS HG1 2DX HG1 2DY HG1 2EB |
| Christina Street | HG1 2DF |
| Coppice Avenue | HG1 2DL |
| Coppice Close | HG1 2DW |
| Coppice Gate | HG1 2DR |
| Coppice Rise | HG1 2DP |
| Coppice View | HG1 2DZ |
| Coppice Way | HG1 2DJ HG1 2DQ |
| Dawson Terrace | HG1 2AW |
| De Ferrieres Avenue | HG1 2AR |
| Dixon Road | HG1 2EJ |
| Dixon Terrace | HG1 2AP |
| Duncan Close | HG1 2DH |
| Duncan Street | HG1 2DG |
| Eastville Terrace | HG1 3HJ HG1 3HL |
| Electric Avenue | HG1 2BB |
| Euclid Avenue | HG1 2BD |
| Fewston Crescent | HG1 2BP |
| Glendowne Terrace | HG1 3HG |
| Grange Avenue | HG1 2AG |
| Hampsthwaite Road | HG1 2DS HG1 2DT HG1 2DU HG1 2JH |
| Kings Road | HG1 5HP HG1 5HZ HG1 5JQ |
| Knapping Hill | HG1 2DN |
| Knox Avenue | HG1 3HY HG1 3JB HG1 3JF |
| Knox Chase | HG1 3HZ |
| Knox Drive | HG1 3JJ |
| Knox Gardens | HG1 3AU |
| Knox Grove | HG1 3JH |
| Knox Lane | HG1 3AR HG1 3AW |
| Knox Mill Lane | HG3 2AE |
| Knox Rise | HG1 3JA |
| Knox Way | HG1 3JL |
| Nesfield Close | HG1 2BL |
| North Lodge Avenue | HG1 3HX |
| Oak Bank | HG1 2JT |
| Oakdale Avenue | HG1 2JN HG1 2JP |
| Oakdale Rise | HG1 2JW |
| Omega Street | HG1 2BZ |
| Osborne Close | HG1 2EF |
| Osborne Gardens | HG1 2EE |
| Osborne Road | HG1 2EA |
| Osborne Walk | HG1 2ED |
| Park House Green | HG1 3HW |
| Quarry Lane | HG1 3HR |
| Quarry Oval | HG1 3LA |
| Redhill Road | HG1 3JQ |
| Ripley Drive | HG1 3JD |
| Ripley Way | HG1 3JE |
| Ripon Road | HG1 2BY HG1 3JR |
| Scargill Road | HG1 2JR |
| Skipton Crescent | HG1 3HA |
| Skipton Road | HG1 3EY HG1 3HB HG1 3HD HG1 3HE HG1 3HF HG1 3HQ HG1 4LJ |
| Southville Terrace | HG1 3HH |
| Spruisty Road | HG1 2JU |
| St Johns Grove | HG1 3AH |
| St Johns Road | HG1 3AF |
| St Lukes Close | HG1 2EH |
| Stonebeck Avenue | HG1 2BN HG1 2BW |
| Sykes Grove | HG1 2DB |
| Timble Grove | HG1 2BJ |
| Unity Close | HG1 2PD |
| Unity Grove | HG1 2AQ |
| West Grove Road | HG1 2AD |
| West View | HG1 3HS |
| Westville Oval | HG1 3JN HG1 3JW |
Transport near New Park
- FAQ
- Price Paid By Year
- Property Type Price
Frequently asked questions about New Park
What is the average price for a property for sale in New Park?
The average price for a property for sale in New Park is £248,179. This amount is 38% lower than the average price in Harrogate. There are 2,580 property listings for sale in New Park.
What streets have the most expensive properties for sale in New Park?
The streets with the most expensive properties for sale in New Park are Burnside Drive at an average of £436,000, West Grove Road at an average of £412,500 and De Ferrieres Avenue at an average of £405,000.
What streets have the most affordable properties for sale in New Park?
The streets with the most affordable properties for sale in New Park are Hampsthwaite Road at an average of £140,008, Back Dawson Terrace at an average of £155,000 and Burnside Close at an average of £180,000.
Which train stations are available in or near New Park?
Some of the train stations available in or near New Park are Harrogate, Starbeck and Hornbeam Park.
Property Price Paid in New Park by Year
The average sold property price by year was:
| Year | Average Sold Price | Price Change |
Sold Properties
|
|---|---|---|---|
| 2025 | £245,603 | -5% |
77 Properties |
| 2024 | £258,196 | 8% |
106 Properties |
| 2023 | £238,794 | -11% |
92 Properties |
| 2022 | £264,096 | 12% |
115 Properties |
| 2021 | £231,607 | 8% |
165 Properties |
| 2020 | £212,880 | 2% |
98 Properties |
| 2019 | £209,376 | -3% |
99 Properties |
| 2018 | £216,351 | -1% |
144 Properties |
| 2017 | £218,527 | 10% |
125 Properties |
| 2016 | £196,870 | -5% |
117 Properties |
| 2015 | £207,426 | 11% |
110 Properties |
| 2014 | £184,568 | 5% |
149 Properties |
| 2013 | £175,997 | 2% |
113 Properties |
| 2012 | £173,108 | -1% |
95 Properties |
| 2011 | £174,728 | -2% |
66 Properties |
| 2010 | £178,767 | 10% |
73 Properties |
| 2009 | £161,691 | -5% |
89 Properties |
| 2008 | £170,161 | -8% |
64 Properties |
| 2007 | £184,078 | 10% |
163 Properties |
| 2006 | £164,792 | 2% |
208 Properties |
| 2005 | £160,799 | 11% |
127 Properties |
| 2004 | £143,039 | 12% |
158 Properties |
| 2003 | £126,298 | 14% |
149 Properties |
| 2002 | £108,552 | 21% |
174 Properties |
| 2001 | £86,275 | 14% |
165 Properties |
| 2000 | £74,072 | 18% |
126 Properties |
| 1999 | £60,464 | 8% |
143 Properties |
| 1998 | £55,702 | 0,2% |
103 Properties |
| 1997 | £55,580 | 13% |
189 Properties |
| 1996 | £48,192 | -9% |
125 Properties |
| 1995 | £52,347 | - |
102 Properties |
Property Price per Property Type in New Park
Here you can find historic sold price data in order to help with your property search.
The average Property Paid Price for specific property types in the last three years are:
| Property Type | Average Sold Price | Sold Properties |
|---|---|---|
| Semi Detached House | £266,951.00 | 105 Semi Detached Houses |
| Detached House | £321,183.00 | 34 Detached Houses |
| Terraced House | £240,892.00 | 95 Terraced Houses |
| Flat | £156,448.00 | 41 Flats |

