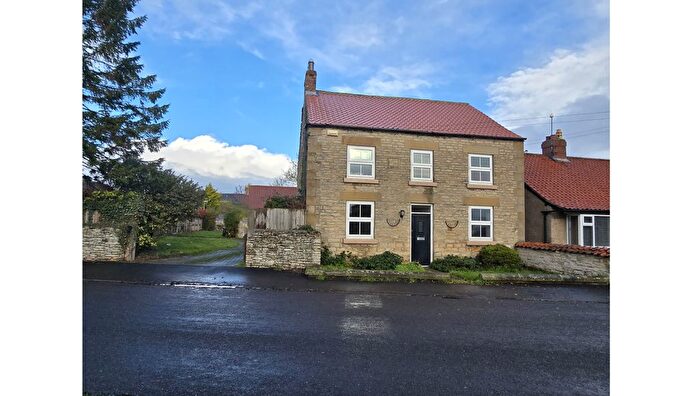
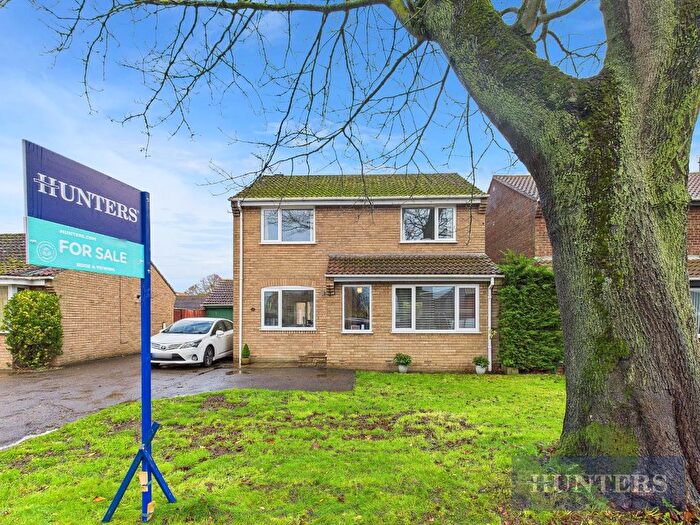
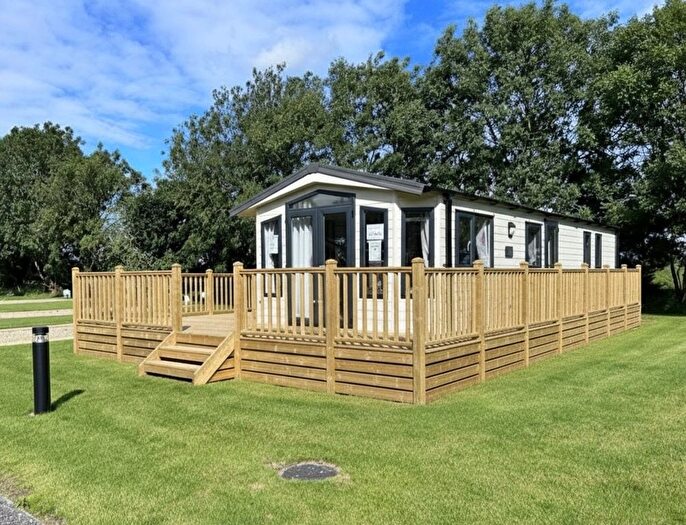
Houses for sale & to rent in Thornton Dale, Pickering
House Prices in Thornton Dale
Properties in Thornton Dale have an average house price of £398,381.00 and had 136 Property Transactions within the last 3 years¹.
Thornton Dale is an area in Pickering, North Yorkshire with 1,123 households², where the most expensive property was sold for £1,340,000.00.
Properties for sale in Thornton Dale
Previously listed properties in Thornton Dale
Roads and Postcodes in Thornton Dale
Navigate through our locations to find the location of your next house in Thornton Dale, Pickering for sale or to rent.
| Streets | Postcodes |
|---|---|
| Archway Lane | YO18 7ST |
| Aunums Close | YO18 7TP |
| Aunums Field | YO18 7AR |
| Back Lane | YO18 7PA |
| Barnes Yard | YO18 7SB |
| Beck Isle | YO18 7RS |
| Brook Lane | YO18 7RZ |
| Brookfield Gardens | YO18 7SU |
| Castle Close | YO18 7TW |
| Castle Road | YO18 7TR |
| Castlegarth | YO18 7SY YO18 7SZ |
| Chapel Lane | YO18 7RL |
| Chestnut Avenue | YO18 7RW YO18 7RP YO18 7RR |
| Church Hill | YO18 7QH |
| Church Lane | YO18 7PP YO18 7QL |
| Church View | YO18 7PX |
| Coulby Lane | YO18 7LY |
| Dale View | YO18 7LJ |
| Dog Kennel Lane | YO18 7QJ |
| East Kingthorpe | YO18 7LN |
| Farmanby Close | YO18 7TB YO18 7TD YO18 7TE |
| Farwath Road | YO18 8JU |
| Gladstone Terrace | YO18 7SS |
| Green Gate Lane | YO18 7LX |
| Hallgarth Lane | YO18 7BJ |
| Heron Close | YO18 7SN |
| High Street | YO18 7QW |
| Hudgin Lane | YO18 7QA |
| Hurrell Lane | YO18 7QR |
| Jessamine Villas | YO18 7TH |
| Levisham Station | YO18 7NN |
| Lodge Gardens | YO18 7TA |
| Low Mill Court | YO18 7SP |
| Main Street | YO18 7NL YO18 7PG |
| Maltongate | YO18 7RJ YO18 7SA YO18 7SD YO18 7SE |
| Manor Close | YO18 7PS |
| Mistle Corner | YO18 7LZ |
| Overscar Lane | YO18 7LW |
| Peaslands Lane | YO18 7QX |
| Pickering Road | YO18 7LH YO18 7LG |
| Priestmans Lane | YO18 7RT YO18 7RU |
| Prospect Place | YO18 7LQ |
| Rectory Lane | YO18 7QG |
| Roxby Gardens | YO18 7SR |
| Roxby Garth | YO18 7TL |
| Roxby Road | YO18 7SX YO18 7TJ YO18 7TQ |
| Roxby Terrace | YO18 7TN |
| Saltersgate | YO18 7NS YO18 7NR |
| South Lane | YO18 7QU |
| South Terrace | YO18 7LD |
| Station Road | YO18 7SF |
| The Close | YO18 7SH |
| The Court | YO18 7PR |
| The Crescent | YO18 7TT |
| The Mount | YO18 7TF |
| The Rise | YO18 7TG |
| The Square | YO18 7RN YO18 7LF |
| The Terrace | YO18 7JZ |
| The View | YO18 7BH |
| Thornton Heights | YO18 7QZ |
| Thornton View | YO18 7BG |
| Thornton-le-dale | YO18 7RA YO18 7QY YO18 7RB YO18 7RX |
| Toc Lane | YO18 7PH |
| Westfield Lane | YO18 7SJ |
| Westfield Terrace | YO18 7SQ |
| Westgate | YO18 7SG |
| Whitbygate | YO18 7RY |
| Willow Garth | YO18 7SW |
| Wilton Road | YO18 7QP |
| Wold View | YO18 7QN |
| Woodlands View | YO18 7SL |
| YO18 7JY YO18 7LB YO18 7LE YO18 7LL YO18 7LP YO18 7LT YO18 7NG YO18 7NH YO18 7NJ YO18 7NQ YO18 7NU YO18 7PF YO18 7PJ YO18 7PW YO18 7PY YO18 7PZ YO18 7QB YO18 7LA YO18 7LR YO18 7LU YO18 7NT YO18 7NW YO18 7PL YO18 7PN YO18 7PQ |
Transport near Thornton Dale
-
Malton Station
-
Seamer Station
-
Scarborough Station
-
Grosmont Station
-
Egton Station
-
Glaisdale Station
-
Sleights Station
- FAQ
- Price Paid By Year
- Property Type Price
Frequently asked questions about Thornton Dale
What is the average price for a property for sale in Thornton Dale?
The average price for a property for sale in Thornton Dale is £398,381. This amount is 28% higher than the average price in Pickering. There are 447 property listings for sale in Thornton Dale.
What streets have the most expensive properties for sale in Thornton Dale?
The streets with the most expensive properties for sale in Thornton Dale are Brook Lane at an average of £895,000, Westgate at an average of £716,000 and Dale View at an average of £675,000.
What streets have the most affordable properties for sale in Thornton Dale?
The streets with the most affordable properties for sale in Thornton Dale are Thornton Heights at an average of £74,000, Aunums Field at an average of £85,000 and Barnes Yard at an average of £114,444.
Which train stations are available in or near Thornton Dale?
Some of the train stations available in or near Thornton Dale are Malton, Seamer and Scarborough.
Property Price Paid in Thornton Dale by Year
The average sold property price by year was:
| Year | Average Sold Price | Price Change |
Sold Properties
|
|---|---|---|---|
| 2025 | £364,361 | -10% |
36 Properties |
| 2024 | £400,320 | -5% |
48 Properties |
| 2023 | £420,144 | 7% |
52 Properties |
| 2022 | £391,729 | 24% |
37 Properties |
| 2021 | £299,014 | 4% |
72 Properties |
| 2020 | £286,956 | 1% |
53 Properties |
| 2019 | £285,017 | -7% |
62 Properties |
| 2018 | £305,027 | 7% |
59 Properties |
| 2017 | £283,797 | 1% |
53 Properties |
| 2016 | £281,247 | 5% |
63 Properties |
| 2015 | £267,040 | 19% |
35 Properties |
| 2014 | £215,034 | -10% |
43 Properties |
| 2013 | £237,455 | -2% |
50 Properties |
| 2012 | £241,544 | -19% |
35 Properties |
| 2011 | £287,977 | 6% |
35 Properties |
| 2010 | £270,765 | 7% |
32 Properties |
| 2009 | £251,917 | -11% |
40 Properties |
| 2008 | £280,616 | 2% |
28 Properties |
| 2007 | £273,814 | 7% |
63 Properties |
| 2006 | £255,129 | 7% |
61 Properties |
| 2005 | £238,473 | -1% |
41 Properties |
| 2004 | £240,877 | 18% |
37 Properties |
| 2003 | £197,454 | 23% |
54 Properties |
| 2002 | £151,619 | 20% |
59 Properties |
| 2001 | £120,620 | 12% |
55 Properties |
| 2000 | £105,977 | 9% |
62 Properties |
| 1999 | £96,964 | 14% |
50 Properties |
| 1998 | £83,751 | -9% |
44 Properties |
| 1997 | £91,702 | 11% |
54 Properties |
| 1996 | £81,371 | -9% |
51 Properties |
| 1995 | £88,598 | - |
35 Properties |
Property Price per Property Type in Thornton Dale
Here you can find historic sold price data in order to help with your property search.
The average Property Paid Price for specific property types in the last three years are:
| Property Type | Average Sold Price | Sold Properties |
|---|---|---|
| Semi Detached House | £318,597.00 | 34 Semi Detached Houses |
| Detached House | £493,742.00 | 70 Detached Houses |
| Terraced House | £287,288.00 | 30 Terraced Houses |
| Flat | £83,500.00 | 2 Flats |

