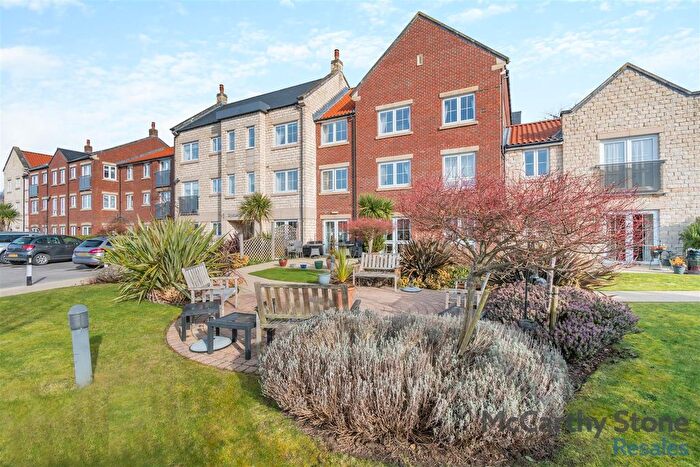
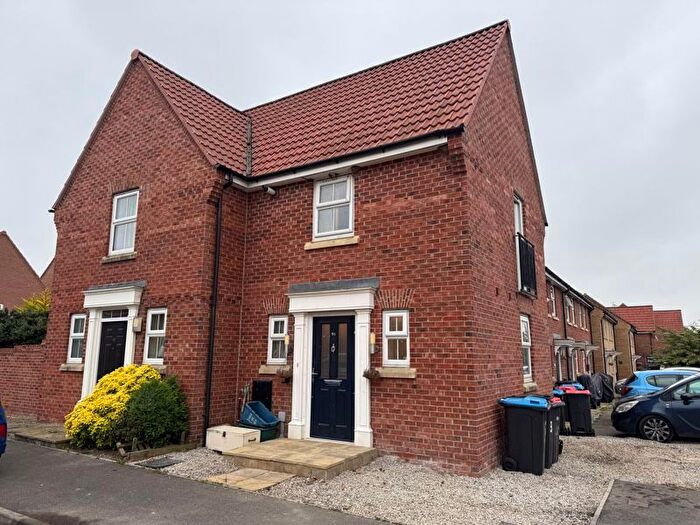
Houses for sale & to rent in Pickering East, Pickering
House Prices in Pickering East
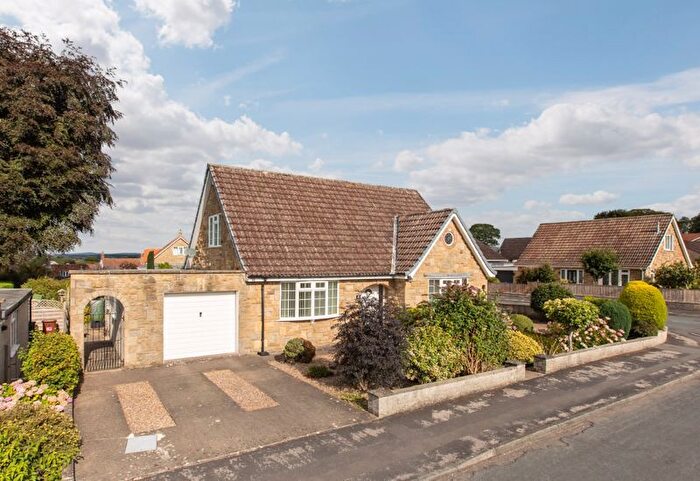
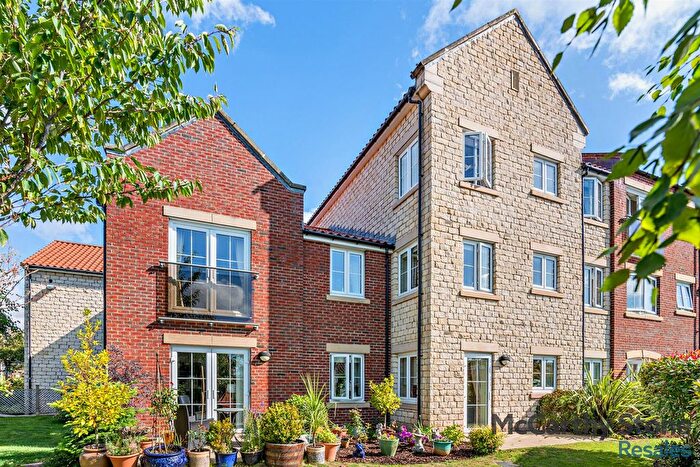
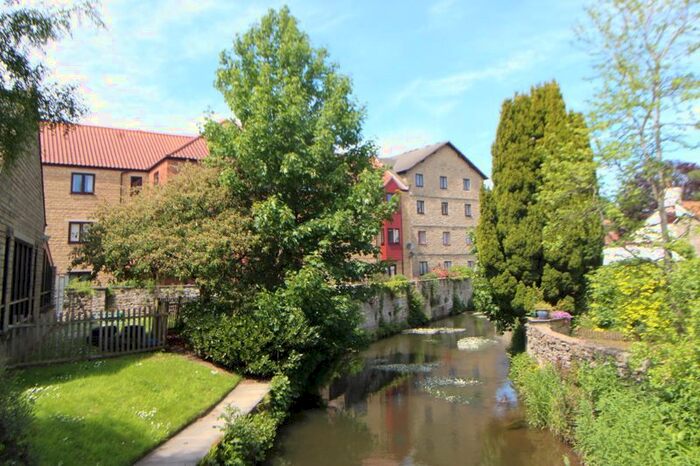
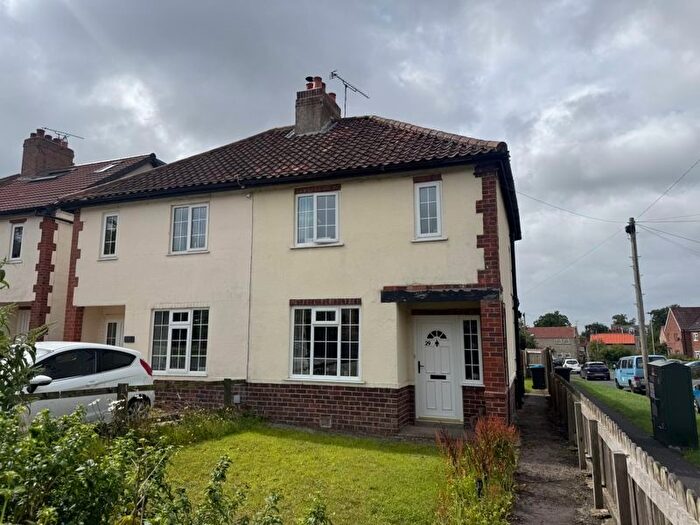
Properties in Pickering East have an average house price of £272,561.00 and had 247 Property Transactions within the last 3 years¹.
Pickering East is an area in Pickering, North Yorkshire with 1,522 households², where the most expensive property was sold for £645,000.00.
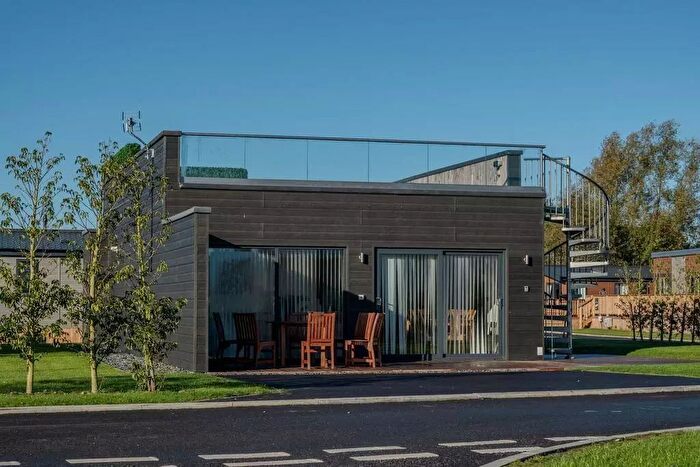
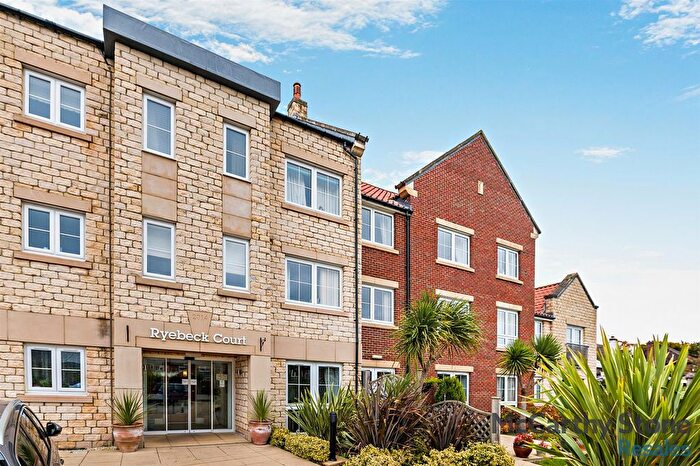
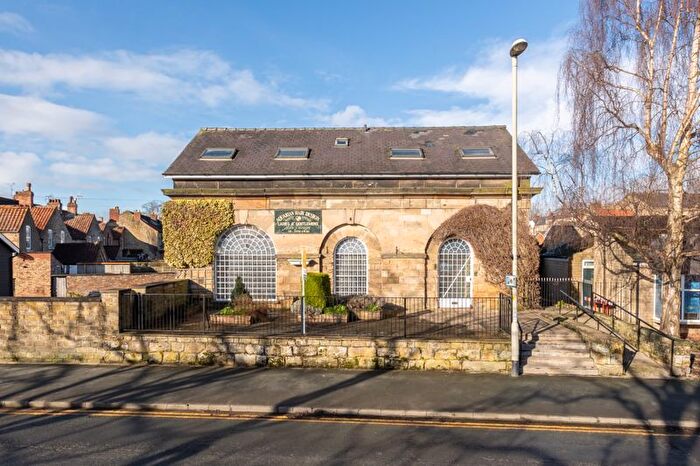
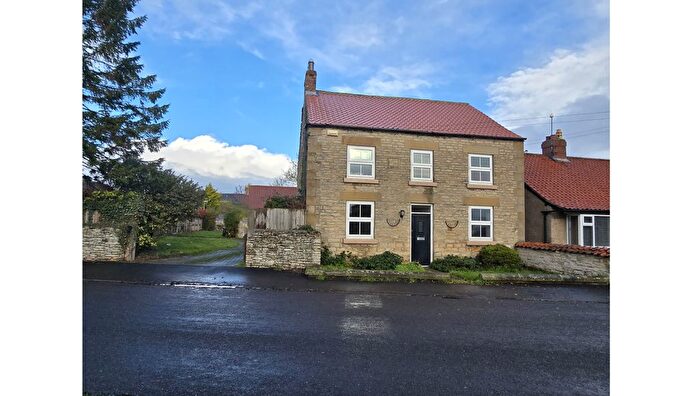
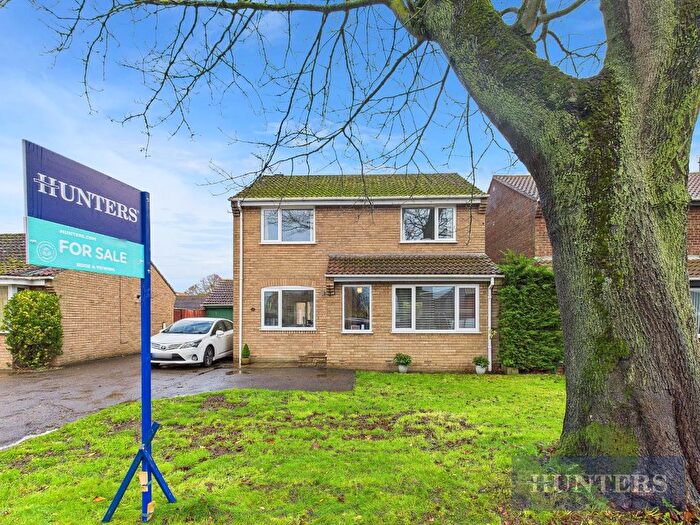
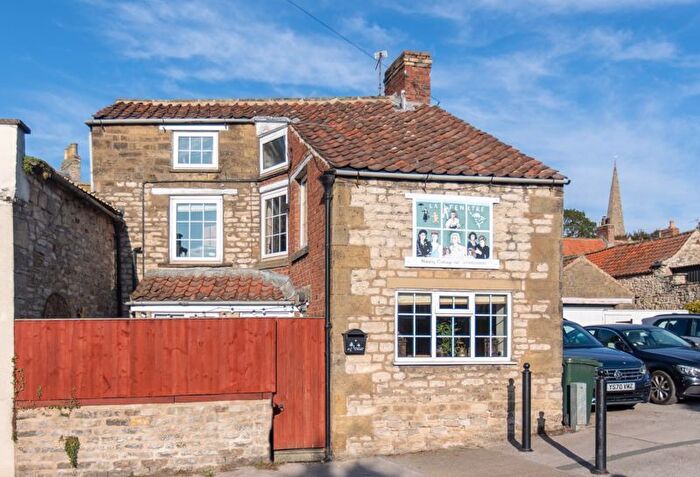
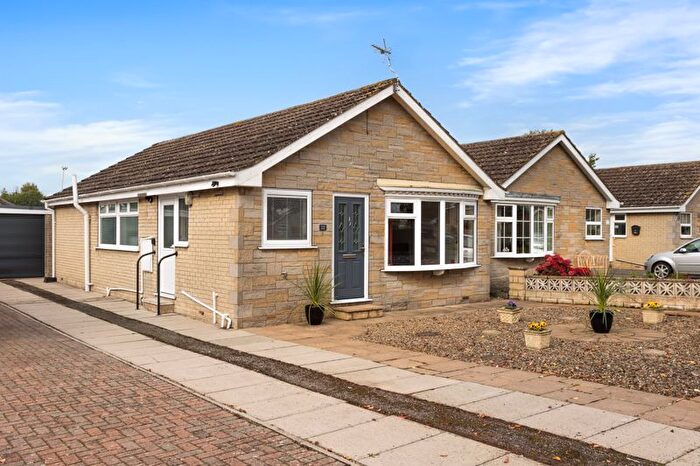
Properties for sale in Pickering East
Previously listed properties in Pickering East
Roads and Postcodes in Pickering East
Navigate through our locations to find the location of your next house in Pickering East, Pickering for sale or to rent.
| Streets | Postcodes |
|---|---|
| Alma Way | YO18 7JH |
| Ashfield Road | YO18 7JE |
| Birch View | YO18 7ED |
| Birdgate | YO18 7AL YO18 7DQ |
| Bridge Street | YO18 8DT |
| Burgate | YO18 7AU |
| Castelo Grove | YO18 7JU |
| Castle Road | YO18 7BA |
| Castlegate | YO18 7AX |
| Corbie Way | YO18 7JS |
| Crofts Avenue | YO18 7HP |
| Crossgate Lane | YO18 7EX |
| Cuddy Brown Close | YO18 7EU |
| Eastfield Road | YO18 7HU |
| Eastgate | YO18 7DU YO18 7DW YO18 7DX YO18 7DY |
| Eastgate Square | YO18 7DP |
| Elm View | YO18 7EF |
| Enterprise Way | YO18 7NA |
| Forest Road | YO18 7EB YO18 7EE |
| Green Howards Road | YO18 7JR |
| Hall Garth | YO18 7AW |
| Hatcase Lane | YO18 7JF |
| Hawthorn Close | YO18 7DR |
| Hawthorn Lane | YO18 7DT YO18 7EA YO18 7HA YO18 7HR |
| Haygate Lane | YO18 7JN |
| Herisson Close | YO18 7HB |
| Hugden Close | YO18 7ES |
| Hungate | YO18 7DG YO18 7DL |
| Keepers Gate | YO18 7EZ |
| Kirkham Lane | YO18 7AS YO18 7AT YO18 7JD |
| Langdale Villas | YO18 7AY |
| Malton Road | YO18 7JJ YO18 7JL YO18 7JW YO18 8EA YO18 8EB |
| Market Court | YO18 7DD |
| Market Place | YO18 7AA |
| Marshall Drive | YO18 7JT |
| Martins Mews | YO18 7AE |
| Maudon Avenue | YO18 7EJ |
| Mickle Hill | YO18 7NB YO18 7ND |
| Mill Lane | YO18 7DB YO18 8DJ |
| Millfield Close | YO18 8DP |
| Norman Close | YO18 7AZ |
| Oaklands | YO18 7HS |
| Orchard Close | YO18 7DZ |
| Outgang Lane | YO18 7JA |
| Outgang Road | YO18 7EL YO18 7EW |
| Park Street | YO18 7AJ |
| Pool Court | YO18 8DR |
| Recreation Road | YO18 7ET YO18 7DA |
| Rosamund Avenue | YO18 7HF |
| Ruffa Lane | YO18 7HN YO18 7HT YO18 7EG |
| Ryebeck Court | YO18 7FA |
| Shepherds Hill | YO18 7JQ |
| Smiddy Hill | YO18 7AN |
| Spire View | YO18 7DE |
| The Avenue | YO18 7EH |
| The Newlands | YO18 7EP |
| Thornton Road | YO18 7HZ YO18 7JX |
| Thornton Road Industrial Estate | YO18 7AG YO18 7JB |
| Thornton-le-dale | YO18 7WF YO18 7ZP |
| Town End Close | YO18 8JB |
| Undercliffe | YO18 7BB |
| Upper Carr Lane | YO18 7JP |
| Wandales Cottages | YO18 7HW |
| Westlands | YO18 7HJ |
| Whistler Drive | YO18 7JG |
| Whitby Road | YO18 7BD YO18 7HD YO18 7HH YO18 7HL YO18 7HQ YO18 7NE YO18 7NF |
| Whitfield Avenue | YO18 7HX YO18 7HY |
| Willow Court | YO18 7EY |
| Willowgate | YO18 7BE |
| Woodlands Park | YO18 7AH |
| YO18 7AP YO18 7GZ YO18 7UA YO18 7YB YO18 7YH YO18 9AL YO18 9AR YO18 9AT YO18 9AU |
Transport near Pickering East
- FAQ
- Price Paid By Year
- Property Type Price
Frequently asked questions about Pickering East
What is the average price for a property for sale in Pickering East?
The average price for a property for sale in Pickering East is £272,561. This amount is 12% lower than the average price in Pickering. There are 281 property listings for sale in Pickering East.
What streets have the most expensive properties for sale in Pickering East?
The streets with the most expensive properties for sale in Pickering East are Herisson Close at an average of £645,000, Rosamund Avenue at an average of £434,928 and Town End Close at an average of £380,500.
What streets have the most affordable properties for sale in Pickering East?
The streets with the most affordable properties for sale in Pickering East are Wandales Cottages at an average of £90,000, Eastgate Square at an average of £99,500 and Alma Way at an average of £133,166.
Which train stations are available in or near Pickering East?
Some of the train stations available in or near Pickering East are Malton, Egton and Grosmont.
Property Price Paid in Pickering East by Year
The average sold property price by year was:
| Year | Average Sold Price | Price Change |
Sold Properties
|
|---|---|---|---|
| 2025 | £285,256 | 2% |
58 Properties |
| 2024 | £280,022 | 8% |
95 Properties |
| 2023 | £257,186 | -8% |
94 Properties |
| 2022 | £278,136 | 7% |
108 Properties |
| 2021 | £258,939 | 3% |
118 Properties |
| 2020 | £252,363 | 21% |
99 Properties |
| 2019 | £199,963 | -9% |
112 Properties |
| 2018 | £218,054 | 7% |
103 Properties |
| 2017 | £202,361 | -12% |
121 Properties |
| 2016 | £227,339 | 19% |
113 Properties |
| 2015 | £184,265 | -6% |
131 Properties |
| 2014 | £194,492 | -7% |
91 Properties |
| 2013 | £207,424 | 3% |
91 Properties |
| 2012 | £201,924 | 10% |
78 Properties |
| 2011 | £180,941 | -3% |
47 Properties |
| 2010 | £186,788 | 7% |
45 Properties |
| 2009 | £173,538 | -13% |
54 Properties |
| 2008 | £196,672 | -9% |
36 Properties |
| 2007 | £213,520 | 2% |
84 Properties |
| 2006 | £209,973 | 13% |
74 Properties |
| 2005 | £183,458 | 4% |
65 Properties |
| 2004 | £176,046 | 20% |
71 Properties |
| 2003 | £140,857 | 22% |
78 Properties |
| 2002 | £110,503 | 19% |
79 Properties |
| 2001 | £90,029 | 12% |
74 Properties |
| 2000 | £79,314 | 8% |
84 Properties |
| 1999 | £73,041 | 3% |
81 Properties |
| 1998 | £71,212 | 14% |
61 Properties |
| 1997 | £61,474 | 8% |
73 Properties |
| 1996 | £56,811 | -15% |
76 Properties |
| 1995 | £65,542 | - |
54 Properties |
Property Price per Property Type in Pickering East
Here you can find historic sold price data in order to help with your property search.
The average Property Paid Price for specific property types in the last three years are:
| Property Type | Average Sold Price | Sold Properties |
|---|---|---|
| Semi Detached House | £238,224.00 | 46 Semi Detached Houses |
| Detached House | £344,633.00 | 84 Detached Houses |
| Terraced House | £259,890.00 | 73 Terraced Houses |
| Flat | £191,888.00 | 44 Flats |

