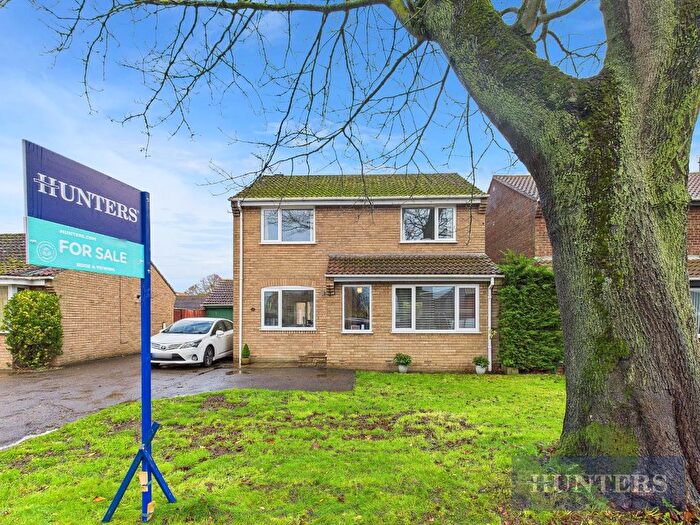
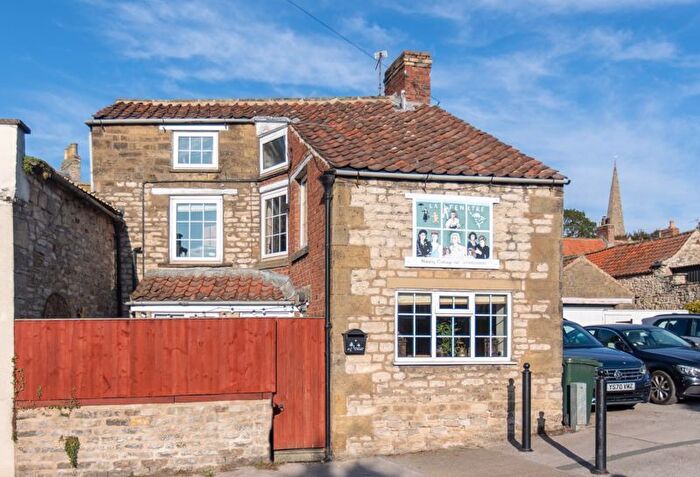
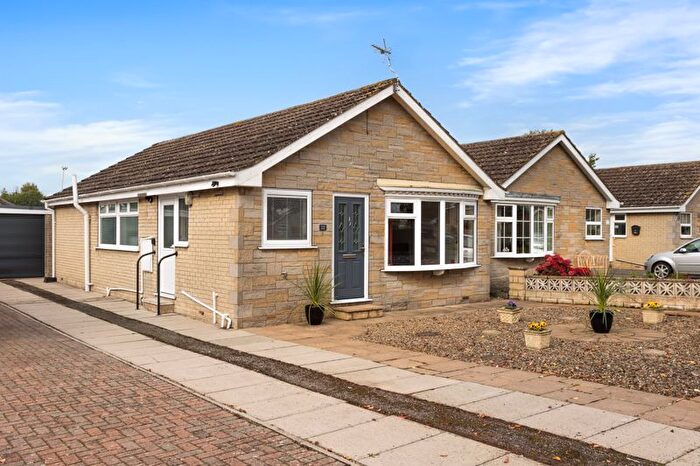
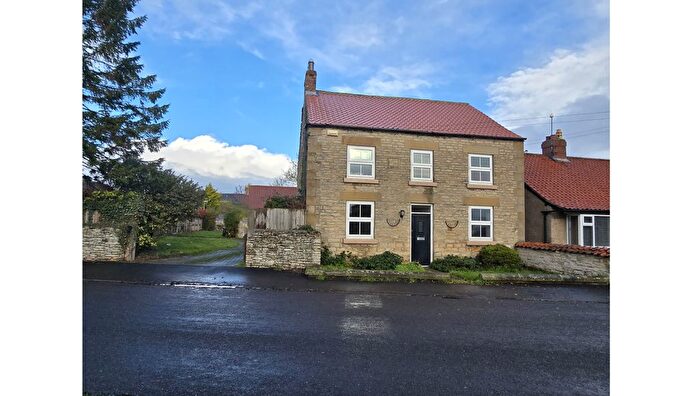
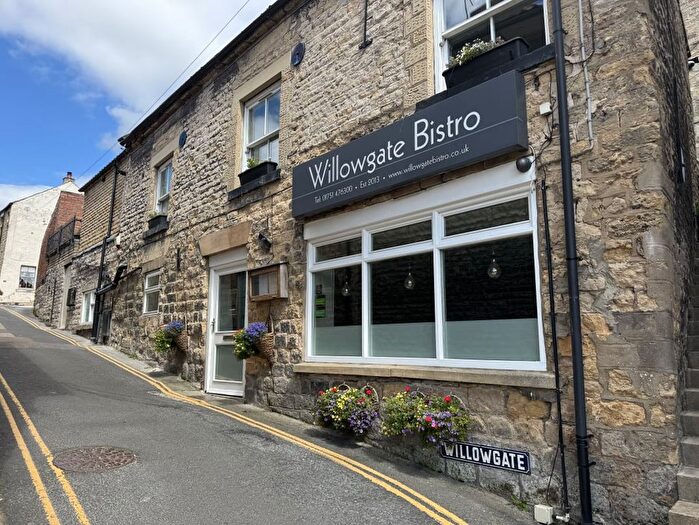
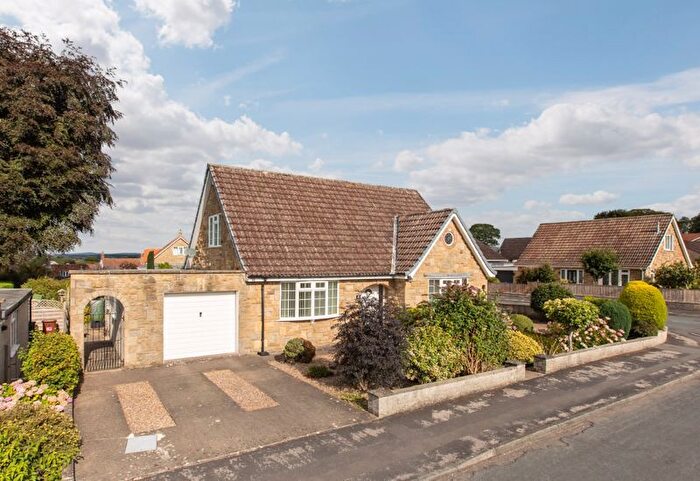
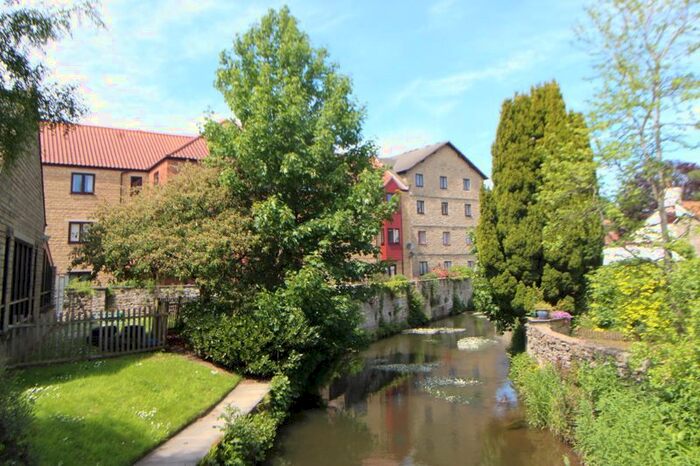
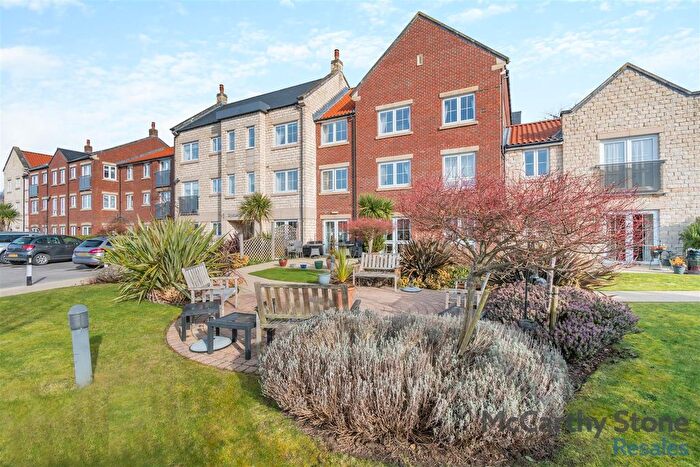
Houses for sale & to rent in Pickering West, Pickering
House Prices in Pickering West
Properties in Pickering West have an average house price of £274,404.00 and had 157 Property Transactions within the last 3 years¹.
Pickering West is an area in Pickering, North Yorkshire with 1,594 households², where the most expensive property was sold for £800,000.00.
Properties for sale in Pickering West
Previously listed properties in Pickering West
Roads and Postcodes in Pickering West
Navigate through our locations to find the location of your next house in Pickering West, Pickering for sale or to rent.
| Streets | Postcodes |
|---|---|
| Alder Court | YO18 8TN |
| Anchorite Lane | YO18 8BW |
| Aspen Close | YO18 8TJ |
| Beacon Park | YO18 8AQ |
| Beck Isle | YO18 8DU |
| Blansby Park Lane | YO18 8JZ |
| Bruce Way | YO18 8BD |
| Bursary Court | YO18 8BF |
| Carr Field Close | YO18 8EZ |
| Church Row | YO18 8JL |
| College View | YO18 8ND |
| Costa Way | YO18 8LY |
| East Brow Road | YO18 8JX YO18 8JY |
| Field Drive | YO18 8BE |
| Firthland Road | YO18 8BZ YO18 8DB |
| Garden Way | YO18 8BG |
| Goslip Terrace | YO18 8BY |
| Goslipgate | YO18 8DQ YO18 8EQ YO18 8DH |
| Grebe Way | YO18 8TL |
| Greenlands Road | YO18 8BQ |
| Herongate | YO18 8TH |
| Howardian View | YO18 8FA |
| Ings Close | YO18 8DW |
| Ings Garth | YO18 8DA |
| Keld Close | YO18 8NJ |
| Keld Head | YO18 8LH YO18 8LJ YO18 8LL |
| Keldgate Road | YO18 8JW |
| Kingfisher Drive | YO18 8TA |
| Lendales Lane | YO18 8EE YO18 8ED |
| Littledale | YO18 8PS |
| Lowther Place | YO18 8BX |
| Mallard Close | YO18 8TF |
| Manor Drive | YO18 8DD YO18 8DF |
| Mayfly Court | YO18 8TP |
| Meadow Road | YO18 8NW |
| Middleton Road | YO18 8AL YO18 8AN YO18 8AS YO18 8NH YO18 8NL YO18 8NQ YO18 8NR YO18 8AJ |
| Mole End | YO18 8TG |
| Mount Terrace | YO18 8JH |
| Northway | YO18 8NN |
| Old Farm Close | YO18 8AB |
| Otter Drive | YO18 8TQ |
| Paddock Close | YO18 8BH |
| Pike Road | YO18 8SY |
| Pipers Acre | YO18 8NZ |
| Porters Headland | YO18 8AG |
| Potter Hill | YO18 8AA YO18 8AD YO18 8AF YO18 8BJ |
| Robinson Court | YO18 8EG |
| Second Avenue | YO18 8AH |
| Southfield View | YO18 8BT |
| Southgate | YO18 8BL YO18 8BS |
| Springfield View | YO18 8AX |
| St Nicholas Way | YO18 8AY YO18 8DE |
| Standfield Drive | YO18 8EY |
| Swainsea Drive | YO18 8PR |
| Swainsea Lane | YO18 8AP YO18 8AR YO18 8NE YO18 8NF YO18 8NG YO18 8PP YO18 8PW |
| Teal Lane | YO18 8AT |
| The Ropery | YO18 8DY |
| Train Lane | YO18 8DX |
| Troutbeck Close | YO18 8TE |
| Views Terrace | YO18 8BU |
| Vivis Lane | YO18 8DL YO18 8TB YO18 8TS |
| West Dyke Road | YO18 8JQ |
| West Pasture | YO18 8SZ |
| Westbourne Grove | YO18 8AW |
| Westerdale | YO18 8DS |
| Western Way | YO18 8NP |
| Westgate | YO18 8AU YO18 8AZ YO18 8BA YO18 8BB YO18 8DN |
| Westgate Carr Road | YO18 8LX YO18 8LZ |
| Yatts Road | YO18 8JJ YO18 8JN |
| YO18 8QQ YO18 8DG YO18 8DZ YO18 8TD |
Transport near Pickering West
- FAQ
- Price Paid By Year
- Property Type Price
Frequently asked questions about Pickering West
What is the average price for a property for sale in Pickering West?
The average price for a property for sale in Pickering West is £274,404. This amount is 12% lower than the average price in Pickering. There are 325 property listings for sale in Pickering West.
What streets have the most expensive properties for sale in Pickering West?
The streets with the most expensive properties for sale in Pickering West are West Dyke Road at an average of £800,000, Porters Headland at an average of £496,250 and Beacon Park at an average of £452,283.
What streets have the most affordable properties for sale in Pickering West?
The streets with the most affordable properties for sale in Pickering West are West Pasture at an average of £125,000, Southfield View at an average of £167,000 and Herongate at an average of £170,000.
Which train stations are available in or near Pickering West?
Some of the train stations available in or near Pickering West are Malton, Egton and Grosmont.
Property Price Paid in Pickering West by Year
The average sold property price by year was:
| Year | Average Sold Price | Price Change |
Sold Properties
|
|---|---|---|---|
| 2025 | £277,336 | 3% |
59 Properties |
| 2024 | £269,367 | -3% |
59 Properties |
| 2023 | £277,588 | -1% |
39 Properties |
| 2022 | £280,616 | 15% |
59 Properties |
| 2021 | £237,833 | -3% |
59 Properties |
| 2020 | £245,101 | 19% |
83 Properties |
| 2019 | £199,716 | -7% |
73 Properties |
| 2018 | £214,607 | 8% |
64 Properties |
| 2017 | £196,887 | 0,4% |
71 Properties |
| 2016 | £196,123 | 5% |
65 Properties |
| 2015 | £185,342 | -1% |
78 Properties |
| 2014 | £186,679 | 10% |
66 Properties |
| 2013 | £167,655 | 1% |
73 Properties |
| 2012 | £165,189 | -10% |
44 Properties |
| 2011 | £182,093 | 1% |
52 Properties |
| 2010 | £179,367 | 3% |
57 Properties |
| 2009 | £173,937 | -8% |
46 Properties |
| 2008 | £187,160 | 4% |
49 Properties |
| 2007 | £179,024 | -9% |
77 Properties |
| 2006 | £194,935 | 13% |
97 Properties |
| 2005 | £169,402 | 5% |
62 Properties |
| 2004 | £160,954 | 15% |
68 Properties |
| 2003 | £137,474 | 24% |
107 Properties |
| 2002 | £104,678 | 13% |
103 Properties |
| 2001 | £90,855 | 20% |
77 Properties |
| 2000 | £72,828 | 6% |
68 Properties |
| 1999 | £68,299 | 3% |
71 Properties |
| 1998 | £66,303 | -0,3% |
78 Properties |
| 1997 | £66,499 | 14% |
86 Properties |
| 1996 | £57,150 | -12% |
68 Properties |
| 1995 | £64,044 | - |
78 Properties |
Property Price per Property Type in Pickering West
Here you can find historic sold price data in order to help with your property search.
The average Property Paid Price for specific property types in the last three years are:
| Property Type | Average Sold Price | Sold Properties |
|---|---|---|
| Semi Detached House | £245,142.00 | 40 Semi Detached Houses |
| Detached House | £353,507.00 | 60 Detached Houses |
| Terraced House | £223,418.00 | 51 Terraced Houses |
| Flat | £111,833.00 | 6 Flats |

