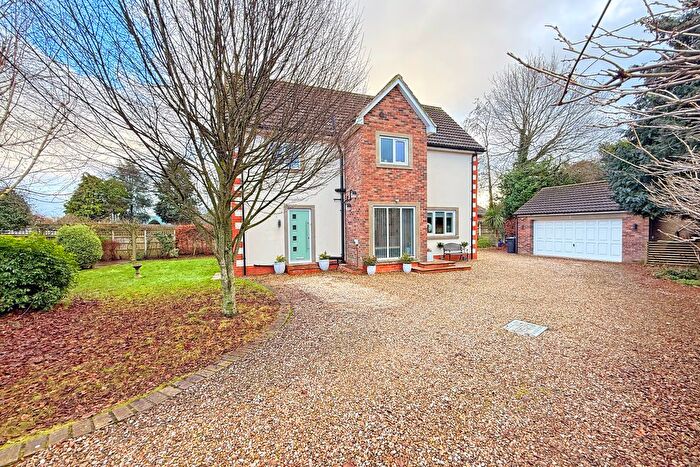
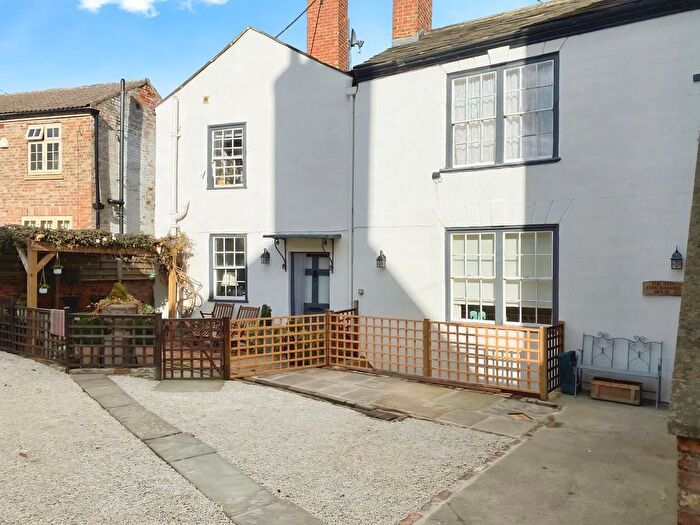
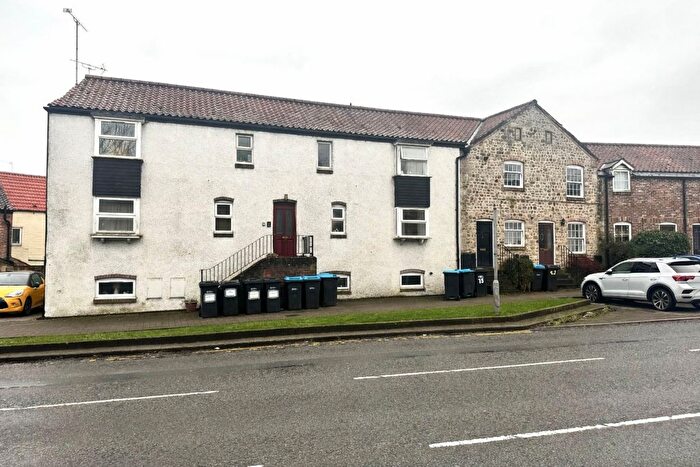
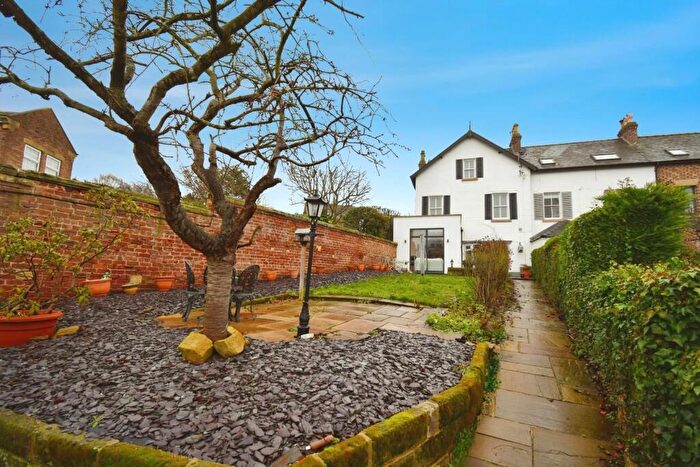
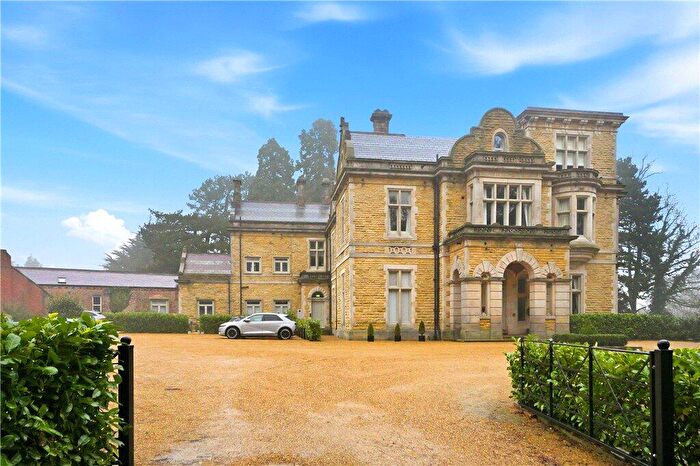
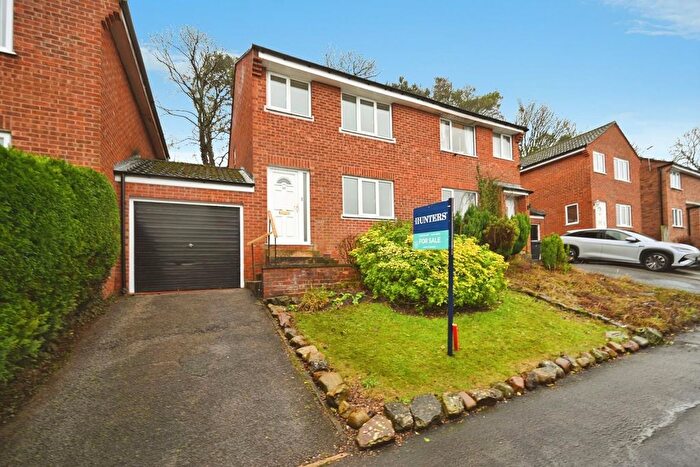
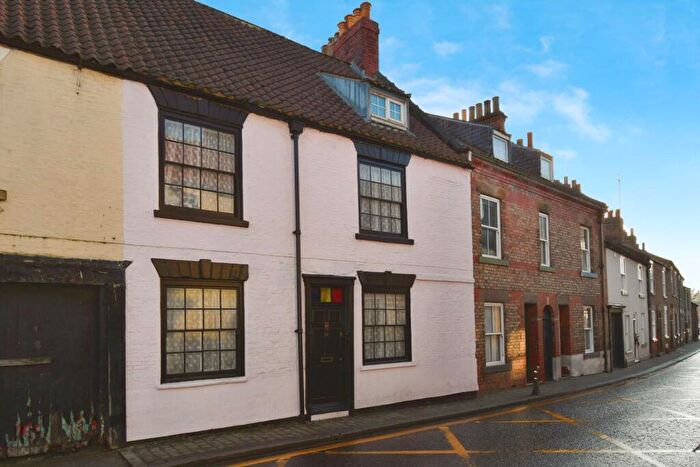
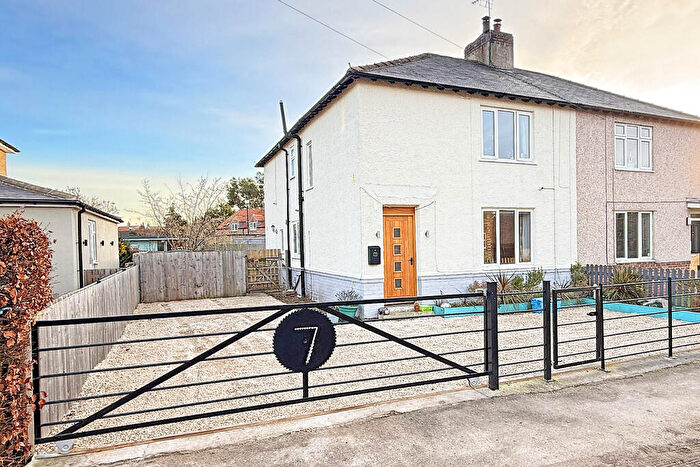
Houses for sale & to rent in Wathvale, Ripon
House Prices in Wathvale
Properties in Wathvale have an average house price of £378,576.00 and had 26 Property Transactions within the last 3 years¹.
Wathvale is an area in Ripon, North Yorkshire with 426 households², where the most expensive property was sold for £1,250,000.00.
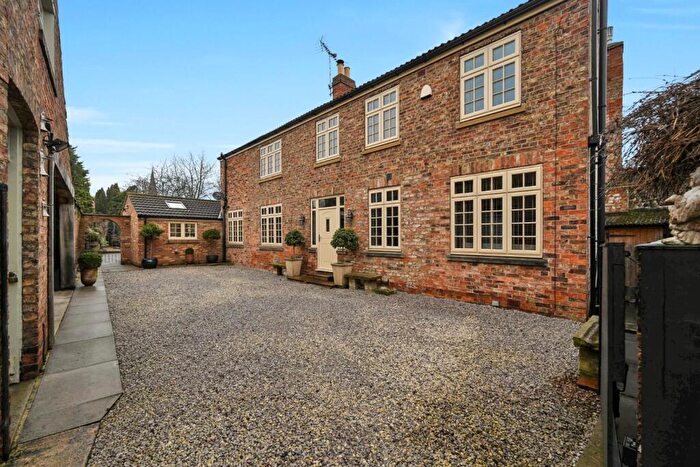
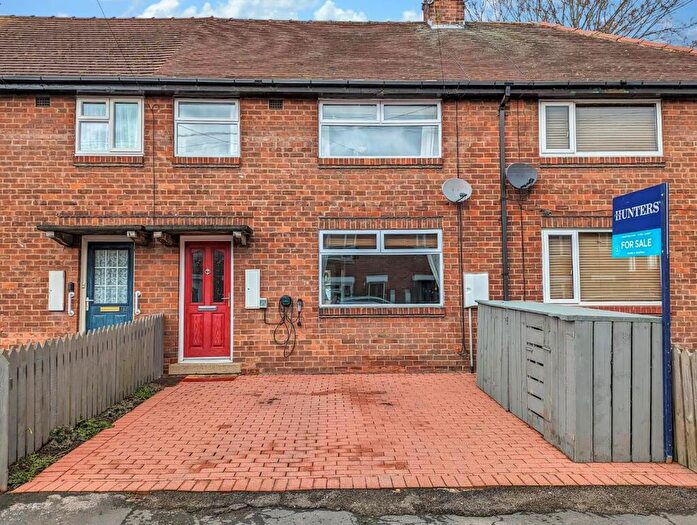
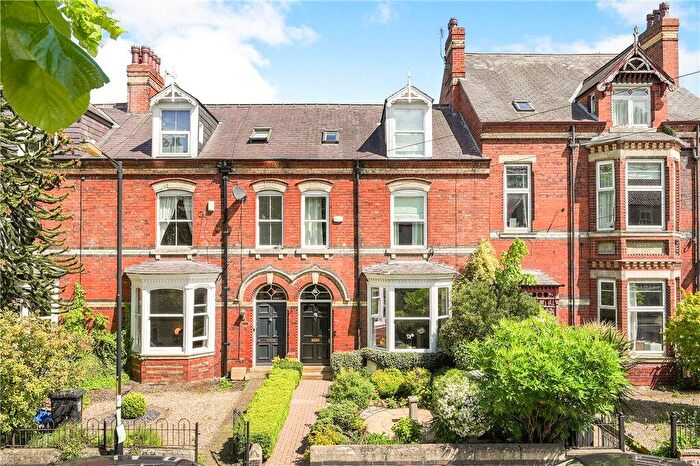
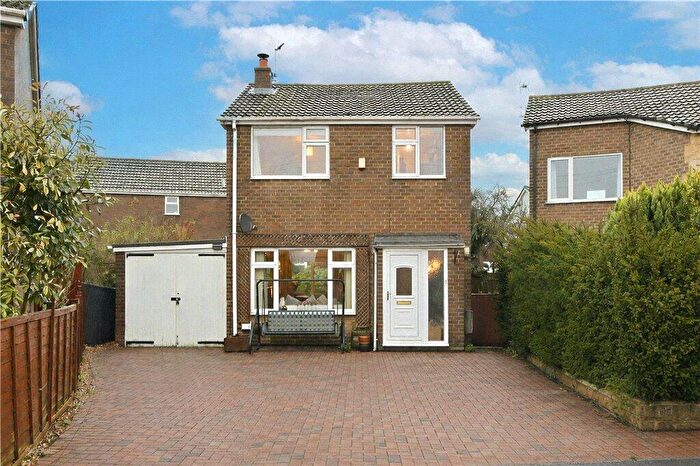
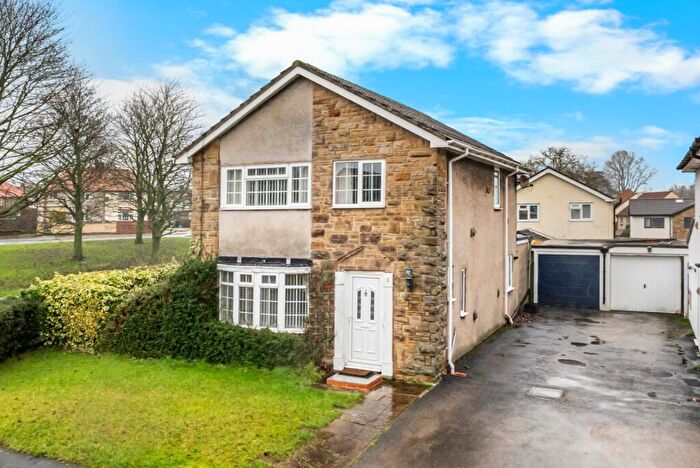
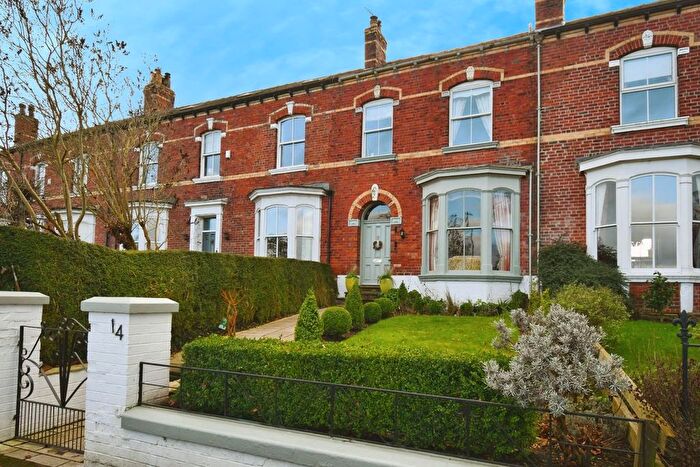
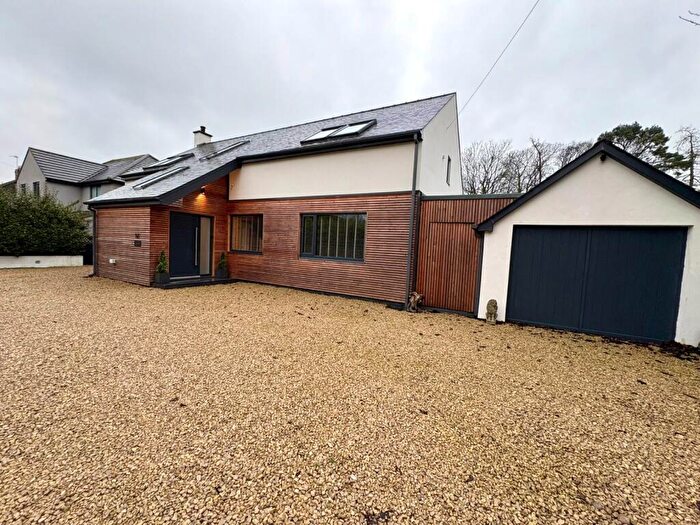
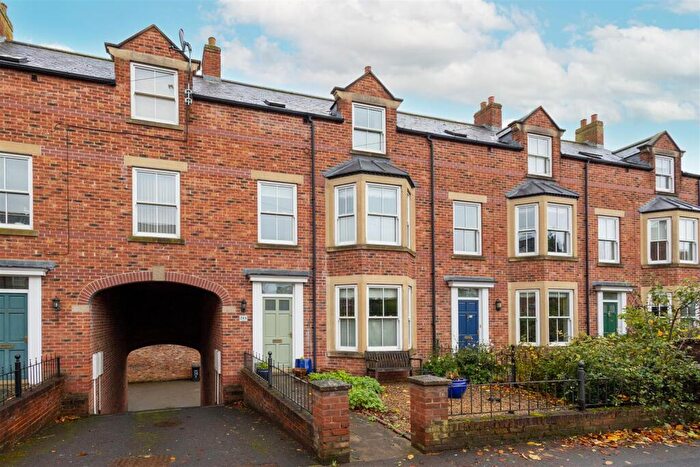
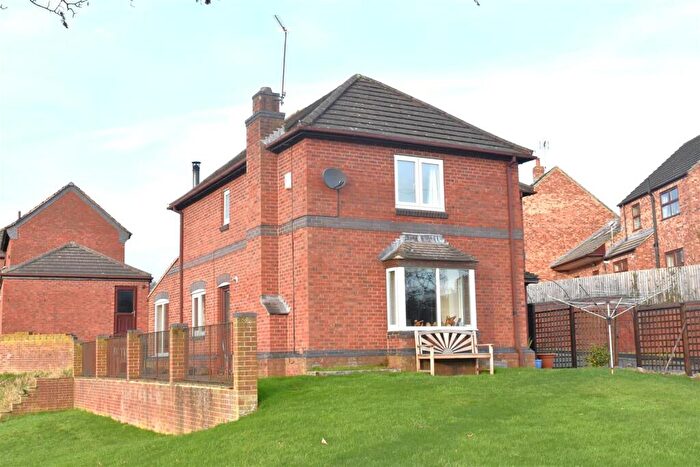
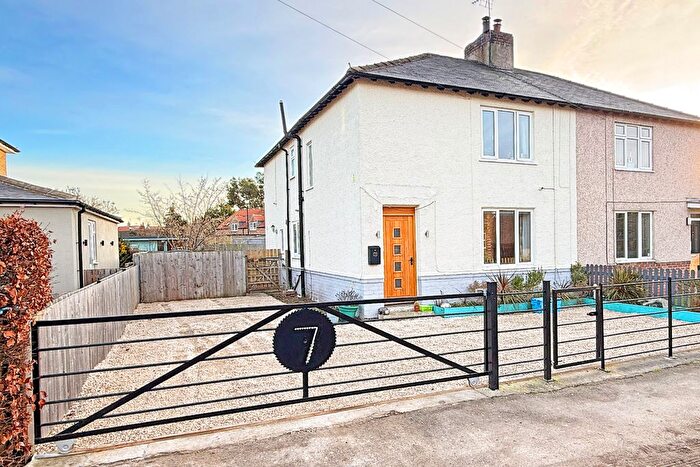
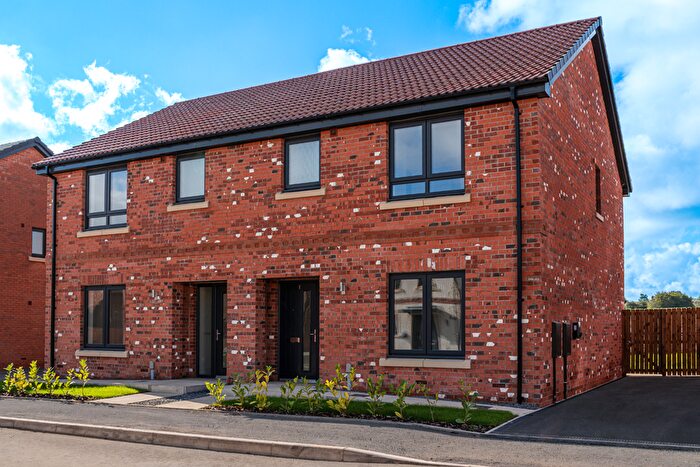
Properties for sale in Wathvale
Roads and Postcodes in Wathvale
Navigate through our locations to find the location of your next house in Wathvale, Ripon for sale or to rent.
| Streets | Postcodes |
|---|---|
| Back Lane | HG4 5HJ |
| Barker Business Park Green Road | HG4 5NB |
| Barugh Avenue | HG4 5FG HG4 5NG |
| Barugh Close | HG4 5NJ |
| Bedale Lane | HG4 5ER |
| Berrygate Lane | HG4 5DS |
| Boroughbridge Road | HG4 5AA |
| Brewery Close | HG4 5NL |
| Dale View | HG4 5EY |
| Dishforth Road | HG4 5BX |
| Haldgarth | HG4 5EE |
| Hall Garth | HG4 5HB |
| Hall Mews | HG4 5HA |
| Hallikeld Close | HG4 5GZ |
| Hallikeld View | HG4 5HN |
| Hanwell Lane | HG4 5BF |
| Honey Garth | HG4 5FA |
| Hutton Bank | HG4 5DR HG4 5DT |
| Hutton Grange Cottages | HG4 5LX |
| Keld Close | HG4 5NE |
| Kendal View | HG4 5DY |
| Kirkby Road | HG4 3JU |
| Luncarr Lane | HG4 5FE |
| Main Street | HG4 5EN HG4 5ET |
| Manor Close | HG4 5HE |
| Maple Garth | HG4 5PA |
| Maythorpe Gardens | HG4 5FB |
| Melmerby Green Lane | HG4 5HP |
| Middleton Lane | HG4 5PG |
| Norton Close | HG4 5NZ |
| Norton Cottages | HG4 5LS |
| Palace Road | HG4 3HH |
| Park Lane | HG4 3HJ |
| South View | HG4 5EU |
| South View Cottages | HG4 5HG |
| Station Cottages | HG4 5EX |
| Sutton Grange | HG4 3JP HG4 3JY |
| Tanfield Lane | HG4 5DN HG4 5JE |
| Tanfield Road | HG4 5EP |
| The Paddock | HG4 5HW |
| The Square | HG4 3JT HG4 5HF |
| West End Cottages | HG4 5HD |
| West View | HG4 5ES |
| Whitwell Drive | HG4 5HU |
| Whitwell Terrace | HG4 5HQ |
| Wobeck Lane | HG4 5EZ |
| Yoredale Bungalows | HG4 5DZ |
| Yoredale Cottages | HG4 5EA |
| HG4 5DH HG4 5DX HG4 5EB HG4 5EJ HG4 5EL HG4 5HH HG4 5HL HG4 5HR HG4 5HX HG4 5HZ HG4 5JA HG4 5LY HG4 5LZ HG4 3AU HG4 3HQ HG4 3HR HG4 3HS HG4 3JA HG4 3JB HG4 3JD HG4 3JN HG4 3JQ HG4 3JX HG4 3NB HG4 5AY HG4 5AZ HG4 5DG HG4 5DU HG4 5ED HG4 5EF HG4 5EQ HG4 5EW HG4 5FH HG4 5JB HG4 5JG HG4 5LT HG4 5NA |
Transport near Wathvale
-
Thirsk Station
-
Northallerton Station
-
Knaresborough Station
-
Starbeck Station
-
Harrogate Station
-
Hornbeam Park Station
-
Cattal Station
-
Pannal Station
- FAQ
- Price Paid By Year
- Property Type Price
Frequently asked questions about Wathvale
What is the average price for a property for sale in Wathvale?
The average price for a property for sale in Wathvale is £378,576. This amount is 12% higher than the average price in Ripon. There are 1,357 property listings for sale in Wathvale.
What streets have the most expensive properties for sale in Wathvale?
The streets with the most expensive properties for sale in Wathvale are Wobeck Lane at an average of £1,250,000, Bedale Lane at an average of £510,000 and Maple Garth at an average of £425,000.
What streets have the most affordable properties for sale in Wathvale?
The streets with the most affordable properties for sale in Wathvale are Hallikeld View at an average of £241,833, Whitwell Terrace at an average of £247,500 and Hall Garth at an average of £278,750.
Which train stations are available in or near Wathvale?
Some of the train stations available in or near Wathvale are Thirsk, Northallerton and Knaresborough.
Property Price Paid in Wathvale by Year
The average sold property price by year was:
| Year | Average Sold Price | Price Change |
Sold Properties
|
|---|---|---|---|
| 2025 | £413,750 | 2% |
6 Properties |
| 2024 | £403,500 | 18% |
10 Properties |
| 2023 | £332,550 | -0,4% |
10 Properties |
| 2022 | £333,768 | -17% |
11 Properties |
| 2021 | £389,714 | 10% |
23 Properties |
| 2020 | £351,052 | -8% |
18 Properties |
| 2019 | £379,139 | 16% |
14 Properties |
| 2018 | £319,243 | 5% |
19 Properties |
| 2017 | £302,368 | -8% |
19 Properties |
| 2016 | £325,109 | -5% |
19 Properties |
| 2015 | £339,758 | 21% |
17 Properties |
| 2014 | £267,725 | -14% |
20 Properties |
| 2013 | £304,375 | -29% |
12 Properties |
| 2012 | £392,916 | 19% |
6 Properties |
| 2011 | £318,737 | 25% |
4 Properties |
| 2010 | £239,727 | 2% |
6 Properties |
| 2009 | £233,927 | -15% |
11 Properties |
| 2008 | £268,900 | 5% |
5 Properties |
| 2007 | £255,026 | -4% |
21 Properties |
| 2006 | £264,826 | 5% |
21 Properties |
| 2005 | £251,428 | -4% |
14 Properties |
| 2004 | £261,318 | 14% |
11 Properties |
| 2003 | £225,350 | 24% |
23 Properties |
| 2002 | £171,127 | 34% |
22 Properties |
| 2001 | £113,320 | -19% |
34 Properties |
| 2000 | £134,583 | 14% |
27 Properties |
| 1999 | £115,695 | 10% |
10 Properties |
| 1998 | £103,621 | 18% |
16 Properties |
| 1997 | £85,461 | -46% |
9 Properties |
| 1996 | £124,845 | 39% |
10 Properties |
| 1995 | £76,000 | - |
8 Properties |
Property Price per Property Type in Wathvale
Here you can find historic sold price data in order to help with your property search.
The average Property Paid Price for specific property types in the last three years are:
| Property Type | Average Sold Price | Sold Properties |
|---|---|---|
| Semi Detached House | £257,625.00 | 4 Semi Detached Houses |
| Detached House | £527,083.00 | 12 Detached Houses |
| Terraced House | £234,722.00 | 9 Terraced Houses |
| Flat | £375,000.00 | 1 Flat |

