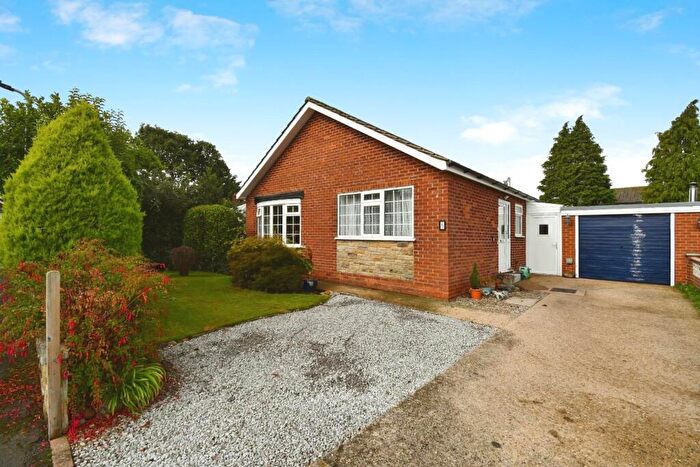
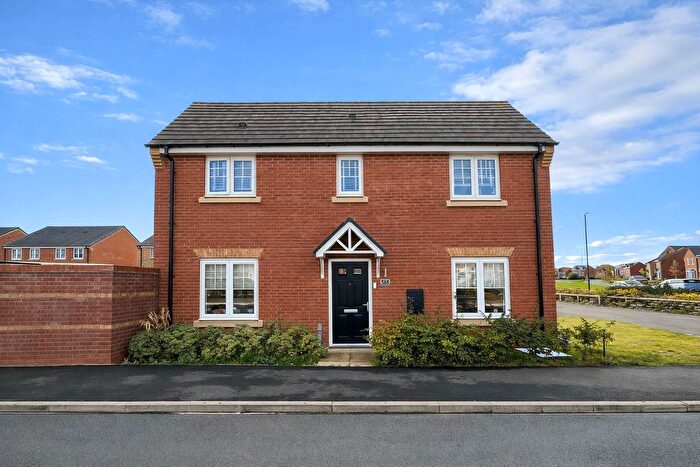
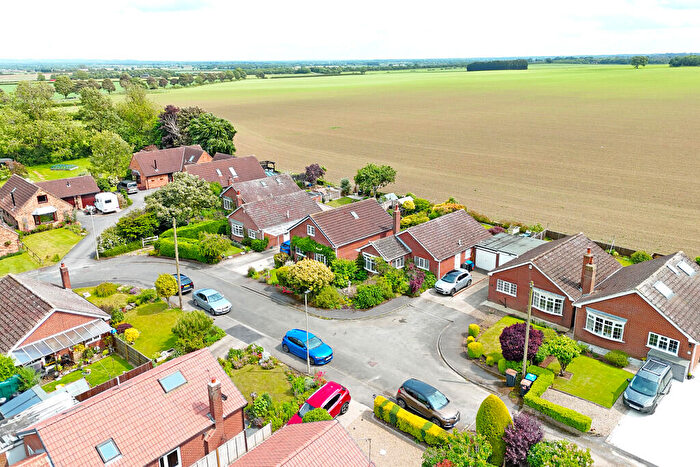
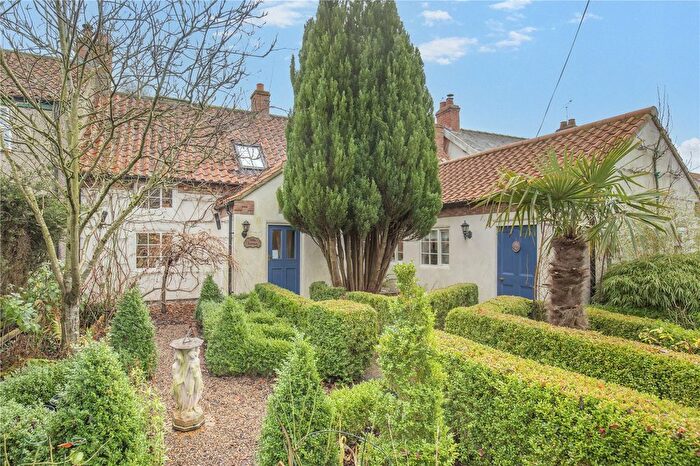
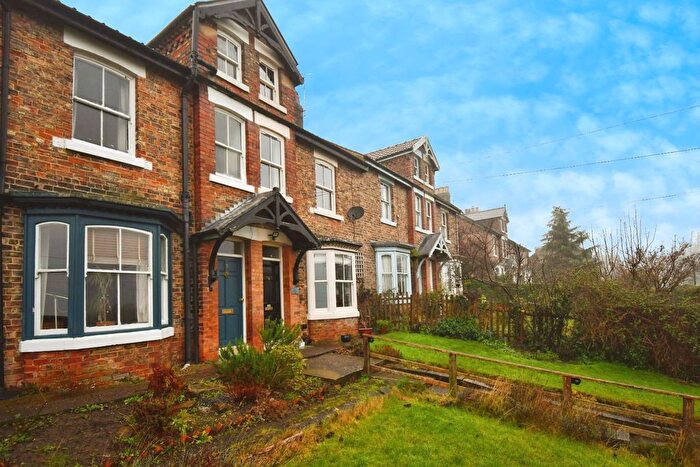
Houses for sale & to rent in Wathvale, Thirsk
House Prices in Wathvale
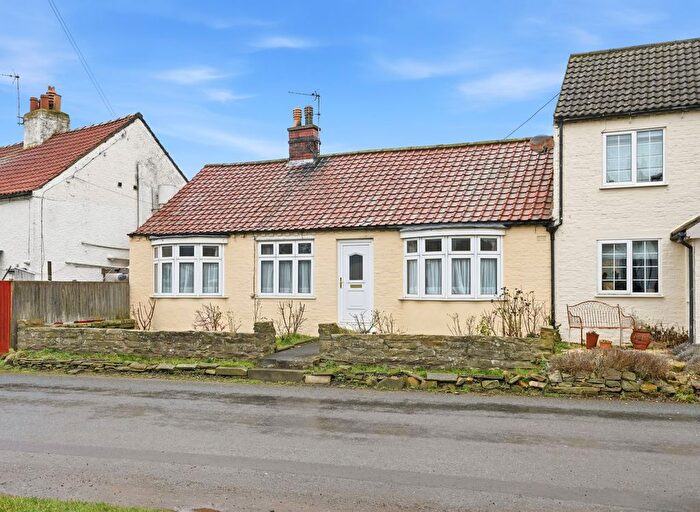
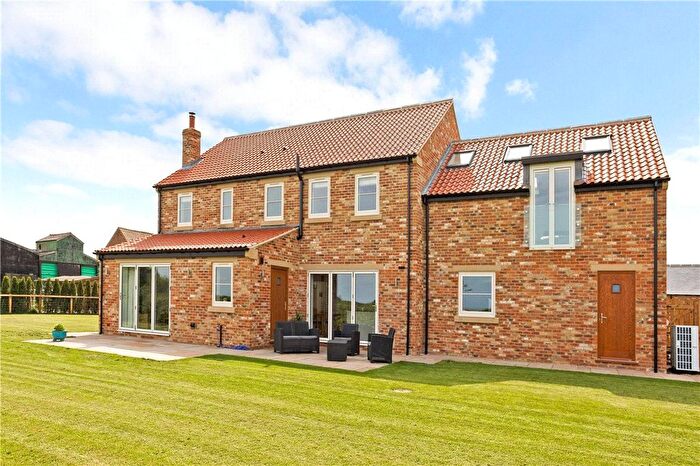
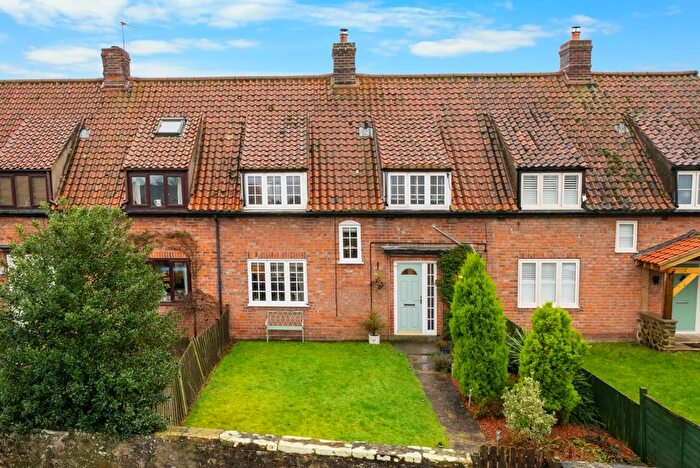
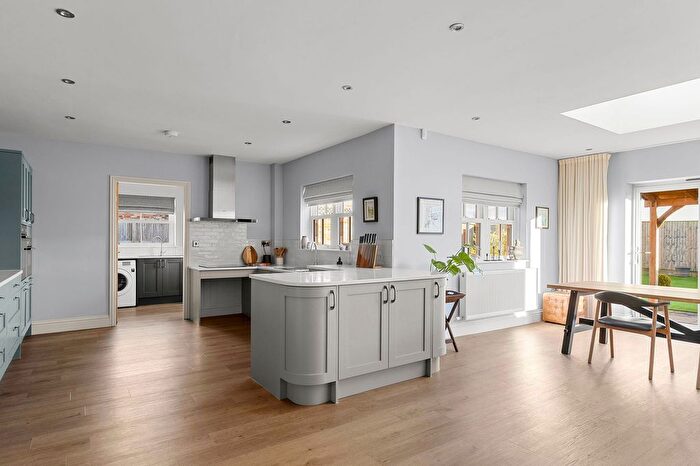
Properties in Wathvale have an average house price of £307,057.00 and had 62 Property Transactions within the last 3 years¹.
Wathvale is an area in Thirsk, North Yorkshire with 701 households², where the most expensive property was sold for £850,000.00.
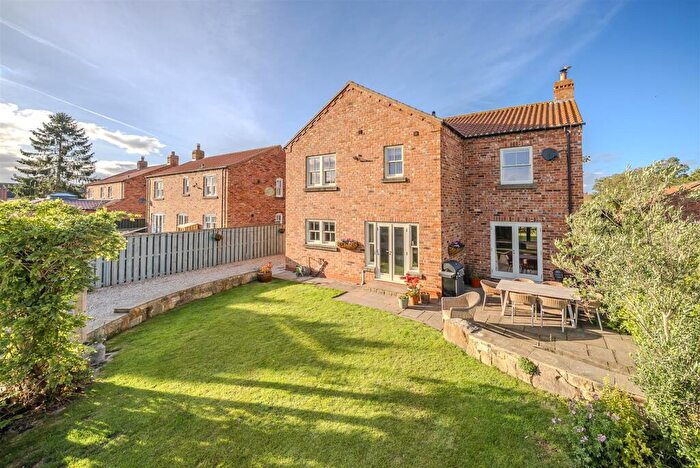
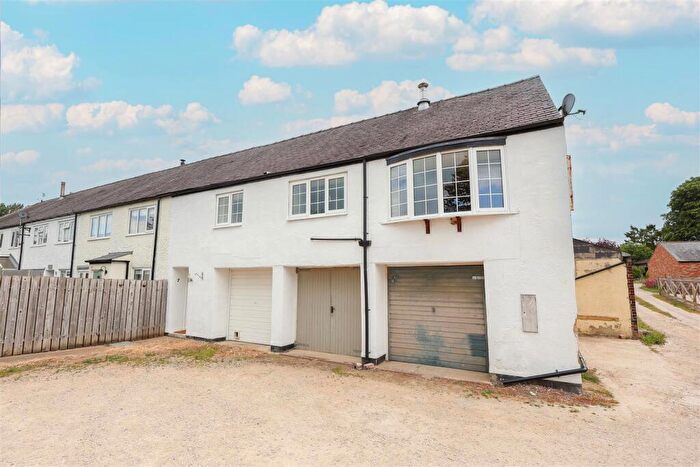
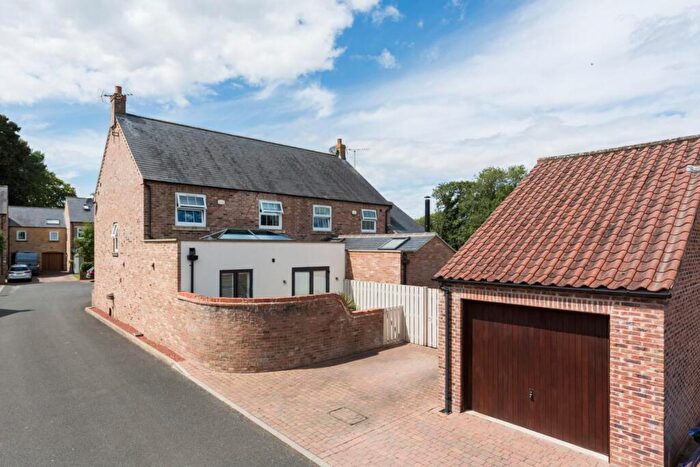
Properties for sale in Wathvale
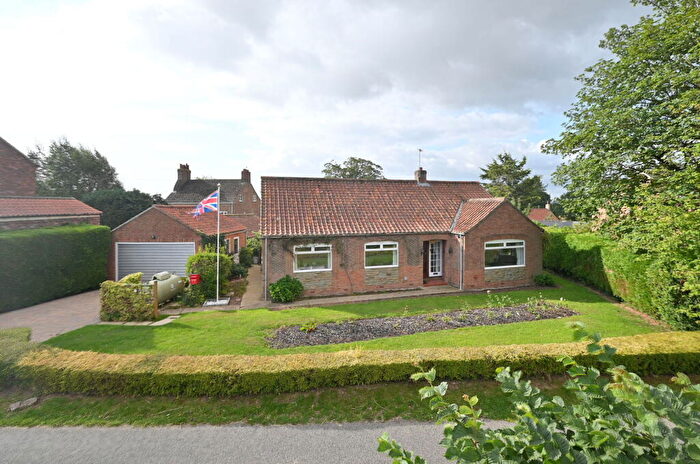
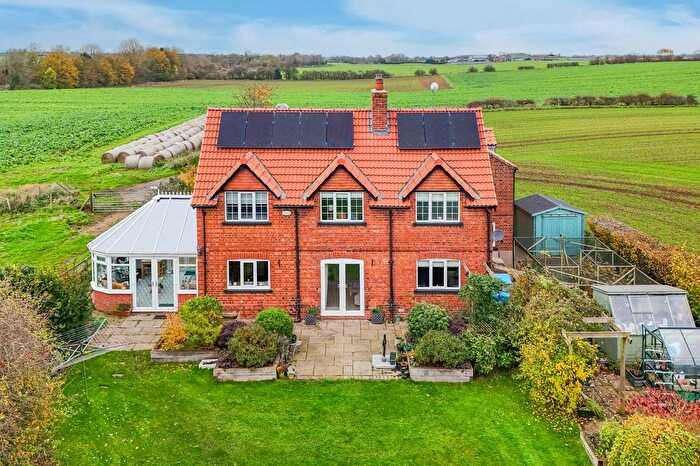
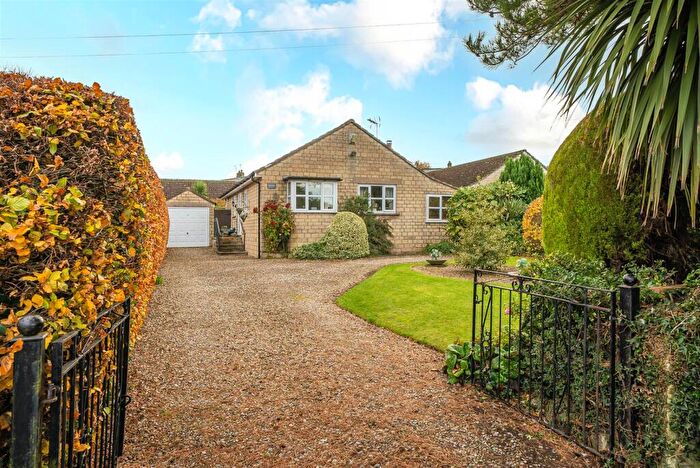
Previously listed properties in Wathvale
Roads and Postcodes in Wathvale
Navigate through our locations to find the location of your next house in Wathvale, Thirsk for sale or to rent.
| Streets | Postcodes |
|---|---|
| Ash View | YO7 3JZ |
| Back Lane | YO7 3LH YO7 3QB |
| Baldersby Garth | YO7 4PD |
| Baldersby Park | YO7 3BZ YO7 3PG YO7 3PQ |
| Beech Close | YO7 4QB |
| Blue Row | YO7 4PF |
| Brookside Villas | YO7 4PW |
| Carr Close | YO7 3QE |
| Carr Lane | YO7 3PS YO7 3PF |
| Chapel Yard | YO7 3JX |
| Chestnut Grove | YO7 4PQ |
| Church Lane | YO7 3PE |
| Church View | YO7 3JY |
| Clarkes Croft | YO7 3XB |
| Craythorns Crescent | YO7 3LY |
| Cundall Avenue | YO7 3QF |
| Cundall Road | YO7 3QZ YO7 3RA |
| Dishforth Airfield | YO7 3DW YO7 3EZ |
| Dishforth Cottages | YO7 3LA |
| Dishforth Lane | YO7 3PU |
| Dishforth Road | YO7 3QJ YO7 3QL |
| Forest Drive | YO7 3LU |
| Gables Court | YO7 3LT |
| Grange Close | YO7 3LN |
| Grange Farm Cottages | YO7 3PP |
| Grange Field | YO7 3LS |
| Great North Road | YO7 4LF |
| Green End | YO7 3QX |
| Hambleton View | YO7 3LB |
| Howefield | YO7 4PZ |
| Jamesville Way | YO7 3QP |
| Kirklea | YO7 4PX |
| Lingham Lane | YO7 3LF |
| Manor Close | YO7 3LJ |
| Marlpit Lane | YO7 4PG |
| Moor Lane | YO7 3LG |
| Mowbray Avenue | YO7 3LQ |
| Old Post Office Row | YO7 3LD |
| Orchard Close | YO7 3LL |
| Orchard Cottages | YO7 3QW |
| Pear Tree Close | YO7 3QY |
| Pear Tree Gardens | YO7 3RE |
| Ripon Road | YO7 3DB YO7 4PS |
| Shambles Lane | YO7 3FA |
| Sinderby Cottages | YO7 3PR |
| Sunnybank | YO7 3PT |
| Sunnyside | YO7 3QU |
| Sycamore Close | YO7 4ED |
| Tanyard | YO7 4PJ YO7 4PL |
| The Close | YO7 3DE YO7 3DF |
| The Cottages | YO7 4PU |
| The Courtyard | YO7 3JS |
| The Crescent | YO7 3YA |
| Thornfield Avenue | YO7 3LX |
| Tithe Barn Avenue | YO7 3PJ |
| Topcliffe Road | YO7 3JT |
| Wellfield | YO7 4PY |
| West End Cottages | YO7 4PR |
| Whaites Lane | YO7 3RD |
| Willow Lane | YO7 3QG |
| YO7 3JU YO7 3LE YO7 3LP YO7 3LR YO7 3LW YO7 3PH YO7 3PL YO7 3PN YO7 3PX YO7 3QN YO7 3QR YO7 3QS YO7 3QT YO7 4PE YO7 4PH YO7 4PP YO7 4PT YO7 3DA YO7 3PD YO7 3PW YO7 3PZ YO7 3QD YO7 4HT YO7 4PN |
Transport near Wathvale
-
Thirsk Station
-
Northallerton Station
-
Knaresborough Station
-
Starbeck Station
-
Cattal Station
-
Harrogate Station
-
Hammerton Station
-
Hornbeam Park Station
- FAQ
- Price Paid By Year
- Property Type Price
Frequently asked questions about Wathvale
What is the average price for a property for sale in Wathvale?
The average price for a property for sale in Wathvale is £307,057. This amount is 0.71% higher than the average price in Thirsk. There are 334 property listings for sale in Wathvale.
What streets have the most expensive properties for sale in Wathvale?
The streets with the most expensive properties for sale in Wathvale are Back Lane at an average of £463,166, Jamesville Way at an average of £450,000 and Church Lane at an average of £440,000.
What streets have the most affordable properties for sale in Wathvale?
The streets with the most affordable properties for sale in Wathvale are The Close at an average of £159,000, Beech Close at an average of £230,521 and Grange Close at an average of £235,000.
Which train stations are available in or near Wathvale?
Some of the train stations available in or near Wathvale are Thirsk, Northallerton and Knaresborough.
Property Price Paid in Wathvale by Year
The average sold property price by year was:
| Year | Average Sold Price | Price Change |
Sold Properties
|
|---|---|---|---|
| 2025 | £294,550 | -10% |
20 Properties |
| 2024 | £323,502 | 9% |
26 Properties |
| 2023 | £295,968 | -56% |
16 Properties |
| 2022 | £460,305 | 20% |
34 Properties |
| 2021 | £367,287 | 25% |
47 Properties |
| 2020 | £274,374 | -8% |
40 Properties |
| 2019 | £297,055 | -5% |
27 Properties |
| 2018 | £310,783 | 3% |
42 Properties |
| 2017 | £300,151 | 11% |
36 Properties |
| 2016 | £268,307 | 13% |
32 Properties |
| 2015 | £233,606 | -17% |
15 Properties |
| 2014 | £272,710 | 31% |
28 Properties |
| 2013 | £188,170 | -85% |
17 Properties |
| 2012 | £347,624 | 26% |
16 Properties |
| 2011 | £258,720 | 7% |
17 Properties |
| 2010 | £239,673 | -36% |
17 Properties |
| 2009 | £326,640 | 21% |
17 Properties |
| 2008 | £257,960 | -1% |
15 Properties |
| 2007 | £261,761 | 15% |
37 Properties |
| 2006 | £223,402 | -13% |
32 Properties |
| 2005 | £251,872 | 8% |
26 Properties |
| 2004 | £230,709 | 22% |
34 Properties |
| 2003 | £179,267 | 2% |
60 Properties |
| 2002 | £176,472 | 21% |
46 Properties |
| 2001 | £139,053 | 14% |
29 Properties |
| 2000 | £119,370 | 17% |
32 Properties |
| 1999 | £99,328 | 16% |
26 Properties |
| 1998 | £83,646 | -1% |
28 Properties |
| 1997 | £84,387 | 6% |
45 Properties |
| 1996 | £79,234 | 6% |
23 Properties |
| 1995 | £74,455 | - |
18 Properties |
Property Price per Property Type in Wathvale
Here you can find historic sold price data in order to help with your property search.
The average Property Paid Price for specific property types in the last three years are:
| Property Type | Average Sold Price | Sold Properties |
|---|---|---|
| Semi Detached House | £279,357.00 | 21 Semi Detached Houses |
| Detached House | £425,636.00 | 22 Detached Houses |
| Terraced House | £200,371.00 | 19 Terraced Houses |

