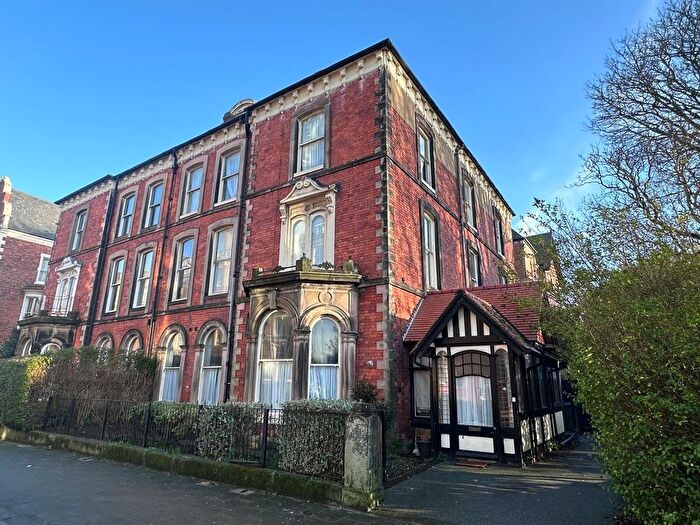
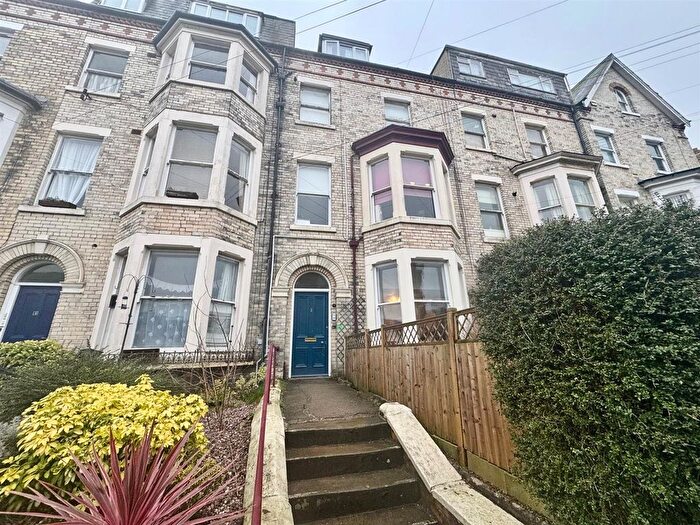
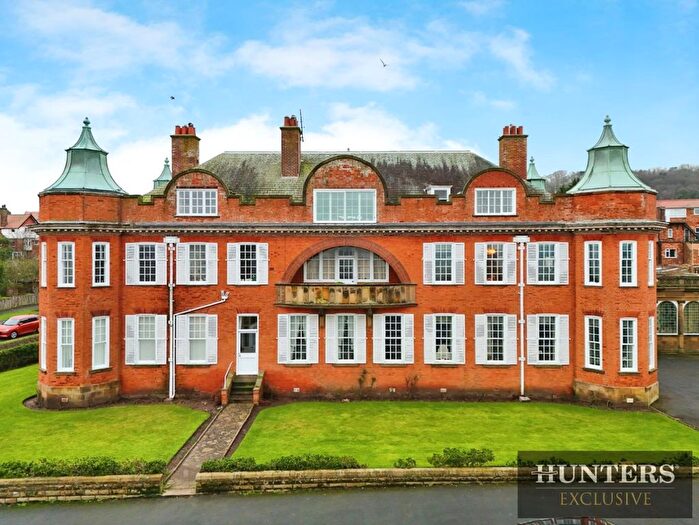
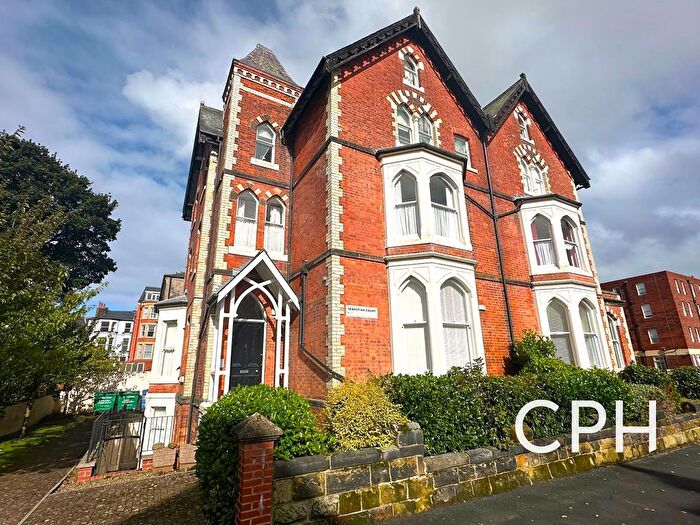
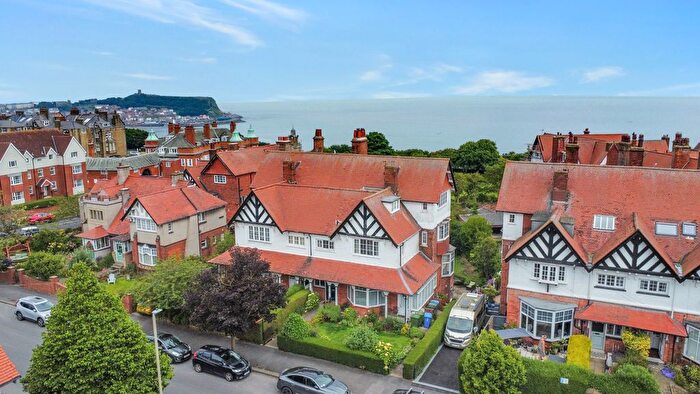
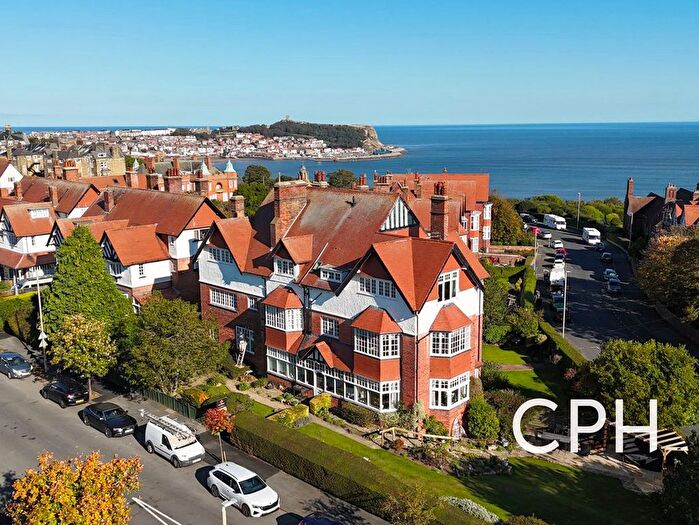
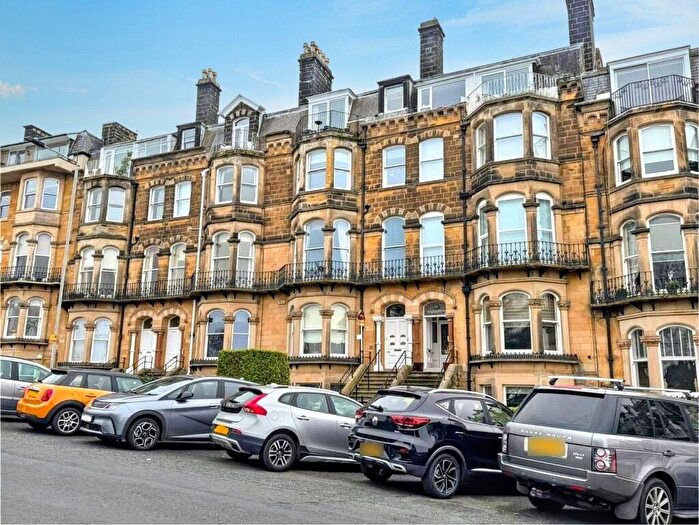
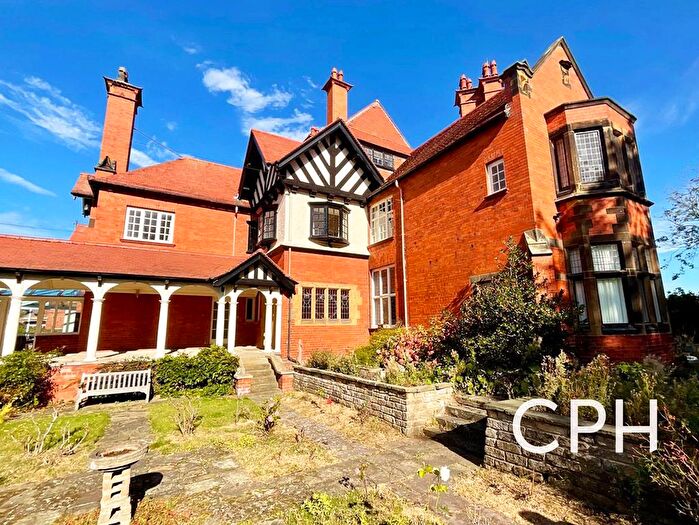
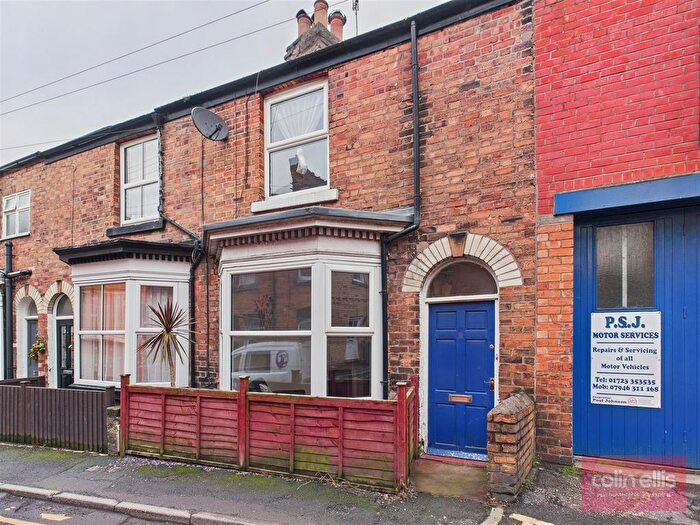
Houses for sale & to rent in Weaponness, Scarborough
House Prices in Weaponness
Properties in Weaponness have an average house price of £220,610.00 and had 284 Property Transactions within the last 3 years¹.
Weaponness is an area in Scarborough, North Yorkshire with 1,778 households², where the most expensive property was sold for £1,059,994.00.
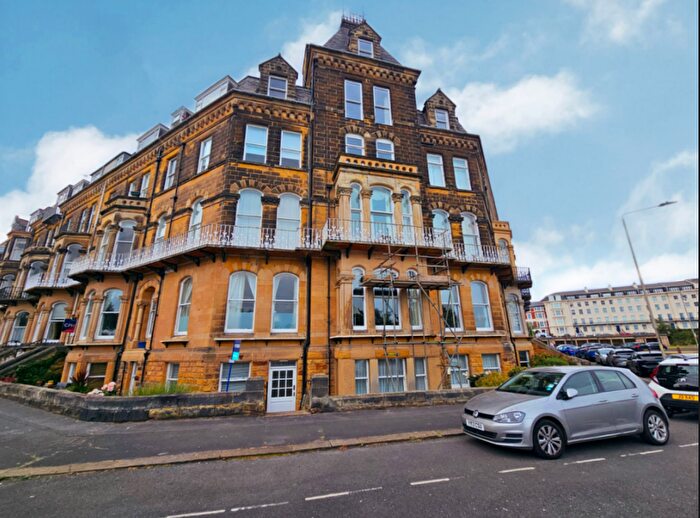
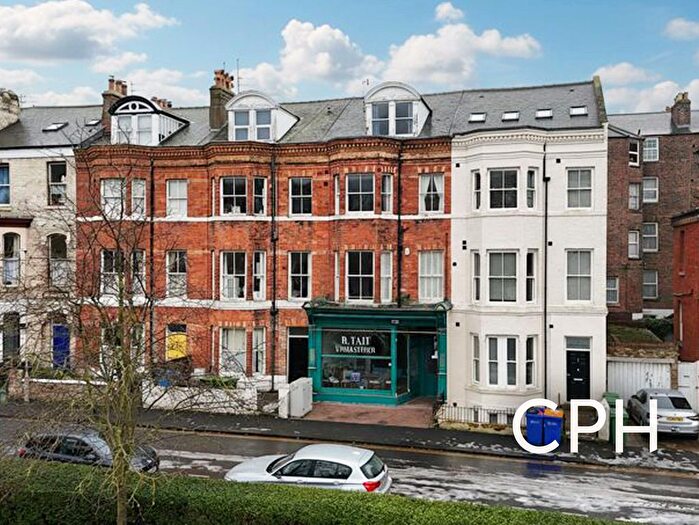
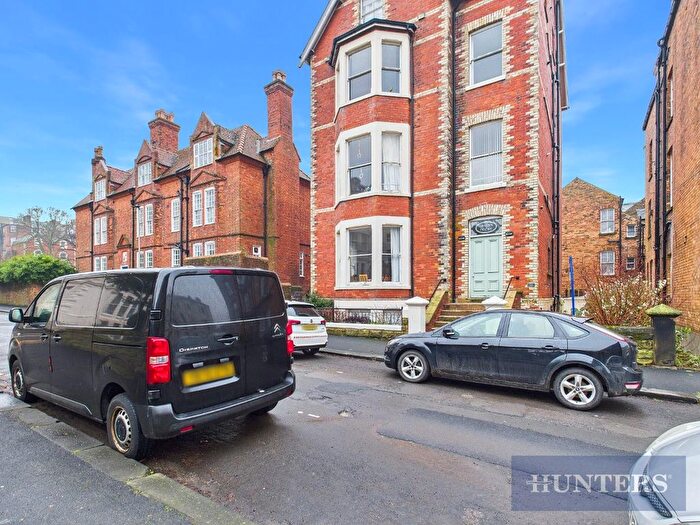
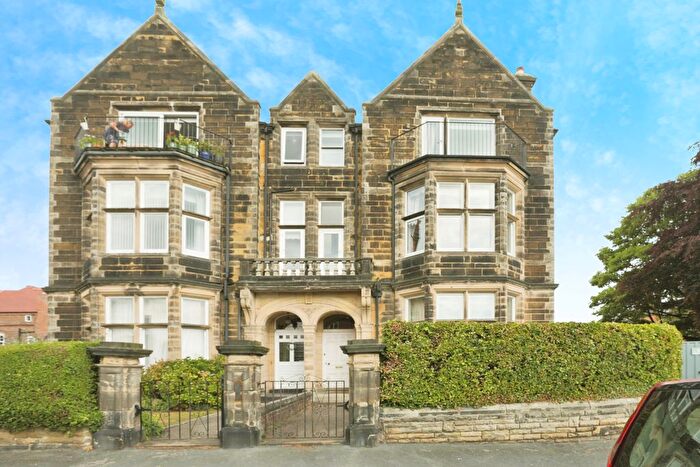
Properties for sale in Weaponness
Previously listed properties in Weaponness
Roads and Postcodes in Weaponness
Navigate through our locations to find the location of your next house in Weaponness, Scarborough for sale or to rent.
| Streets | Postcodes |
|---|---|
| Abrams View | YO11 3YE |
| Astoria Court | YO11 2BA |
| Avenue Victoria | YO11 2QB YO11 2QS YO11 2QT |
| Back Avenue Victoria | YO11 2QD |
| Barleycroft | YO11 3AR |
| Belvedere Place | YO11 2QX |
| Belvedere Road | YO11 2UU |
| Belvedere Terrace | YO11 2PX |
| Chandlers Court | YO11 2YB |
| College Avenue | YO11 2BE |
| Cornelian Avenue | YO11 3AN YO11 3AW |
| Cornelian Close | YO11 3AH |
| Cornelian Drive | YO11 3AJ YO11 3AL |
| Deepdale Avenue | YO11 2UF YO11 2UQ |
| Esplanade | YO11 2AR YO11 2AY YO11 2UX YO11 2UZ |
| Esplanade Crescent | YO11 2XB |
| Esplanade Road | YO11 2AS YO11 2AT YO11 2AU |
| Filey Road | YO11 2SD YO11 2TJ YO11 2TL YO11 2TP YO11 2TU YO11 2TX YO11 3AA YO11 3AE YO11 3AF YO11 3AG YO11 3AQ YO11 3AY YO11 3JG YO11 3JQ |
| Granville Road | YO11 2RA |
| Granville Square | YO11 2QZ |
| Haworth Court | YO11 2QQ |
| Holbeck Avenue | YO11 2XG YO11 2XH YO11 2XJ YO11 2XQ YO11 2YD |
| Holbeck Close | YO11 2XL YO11 2XN YO11 2XW |
| Holbeck Hill | YO11 2XD YO11 2XE YO11 2XP YO11 3BJ YO11 3BL YO11 3BW |
| Holbeck Mews | YO11 2YQ |
| Holbeck Road | YO11 2XF |
| Knox Lane | YO11 2BD |
| Lonsdale Road | YO11 2QU YO11 2QY |
| Mere Lane | YO11 2YN |
| Michael Mount Road | YO11 3AD |
| Mountside | YO11 2TY |
| Queen Margarets Road | YO11 2RT YO11 2RU YO11 2RX YO11 2RY YO11 2SA YO11 2SB YO11 2YH |
| Red Court | YO11 2XA |
| Sea Cliff Crescent | YO11 2XY YO11 2XZ YO11 2YA |
| Sea Cliff Road | YO11 2XR YO11 2XS YO11 2XT YO11 2XU |
| Sea View Close | YO11 3JB |
| Sea View Court | YO11 3HZ |
| Sea View Crescent | YO11 3JE YO11 3JF |
| Sea View Drive | YO11 3HY YO11 3JS |
| Sea View Gardens | YO11 3JD |
| Sea View Grove | YO11 3JA |
| St Michaels Lane | YO11 3AB |
| The Oval | YO11 3AP |
| Weaponness Drive | YO11 2TZ |
| Weaponness Park | YO11 2UB |
| Weldon Court | YO11 2UA |
| West Street | YO11 2QP YO11 2QR |
| Wheatcroft Avenue | YO11 3BN |
Transport near Weaponness
- FAQ
- Price Paid By Year
- Property Type Price
Frequently asked questions about Weaponness
What is the average price for a property for sale in Weaponness?
The average price for a property for sale in Weaponness is £220,610. This amount is 7% higher than the average price in Scarborough. There are 911 property listings for sale in Weaponness.
What streets have the most expensive properties for sale in Weaponness?
The streets with the most expensive properties for sale in Weaponness are College Avenue at an average of £665,000, Deepdale Avenue at an average of £485,750 and Weaponness Drive at an average of £445,000.
What streets have the most affordable properties for sale in Weaponness?
The streets with the most affordable properties for sale in Weaponness are Belvedere Place at an average of £77,500, Mountside at an average of £125,500 and Queen Margarets Road at an average of £125,800.
Which train stations are available in or near Weaponness?
Some of the train stations available in or near Weaponness are Scarborough, Seamer and Filey.
Property Price Paid in Weaponness by Year
The average sold property price by year was:
| Year | Average Sold Price | Price Change |
Sold Properties
|
|---|---|---|---|
| 2025 | £209,115 | -9% |
85 Properties |
| 2024 | £227,929 | 2% |
100 Properties |
| 2023 | £223,086 | 3% |
99 Properties |
| 2022 | £215,454 | 22% |
119 Properties |
| 2021 | £167,860 | -16% |
145 Properties |
| 2020 | £194,625 | 6% |
103 Properties |
| 2019 | £183,537 | 13% |
99 Properties |
| 2018 | £159,713 | -7% |
124 Properties |
| 2017 | £171,488 | 17% |
127 Properties |
| 2016 | £143,104 | -23% |
124 Properties |
| 2015 | £176,275 | 28% |
119 Properties |
| 2014 | £126,982 | -20% |
95 Properties |
| 2013 | £152,233 | 10% |
109 Properties |
| 2012 | £137,183 | -15% |
80 Properties |
| 2011 | £158,228 | -4% |
64 Properties |
| 2010 | £164,458 | 3% |
74 Properties |
| 2009 | £158,804 | -7% |
72 Properties |
| 2008 | £169,366 | 1% |
85 Properties |
| 2007 | £168,264 | 8% |
140 Properties |
| 2006 | £155,282 | -4% |
136 Properties |
| 2005 | £161,079 | 5% |
116 Properties |
| 2004 | £153,221 | 24% |
140 Properties |
| 2003 | £116,893 | 18% |
182 Properties |
| 2002 | £95,711 | 23% |
185 Properties |
| 2001 | £73,652 | 4% |
158 Properties |
| 2000 | £70,911 | 4% |
130 Properties |
| 1999 | £68,177 | 7% |
138 Properties |
| 1998 | £63,484 | 2% |
107 Properties |
| 1997 | £62,086 | 9% |
111 Properties |
| 1996 | £56,353 | -10% |
87 Properties |
| 1995 | £62,266 | - |
86 Properties |
Property Price per Property Type in Weaponness
Here you can find historic sold price data in order to help with your property search.
The average Property Paid Price for specific property types in the last three years are:
| Property Type | Average Sold Price | Sold Properties |
|---|---|---|
| Semi Detached House | £276,823.00 | 51 Semi Detached Houses |
| Detached House | £400,468.00 | 47 Detached Houses |
| Terraced House | £212,590.00 | 11 Terraced Houses |
| Flat | £156,427.00 | 175 Flats |

