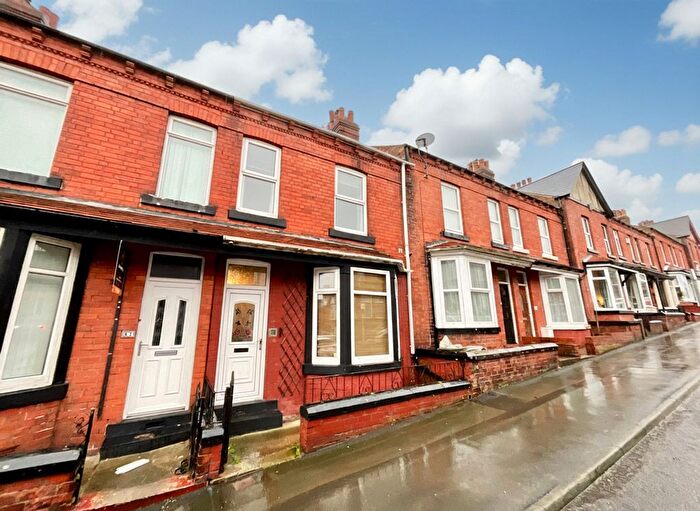
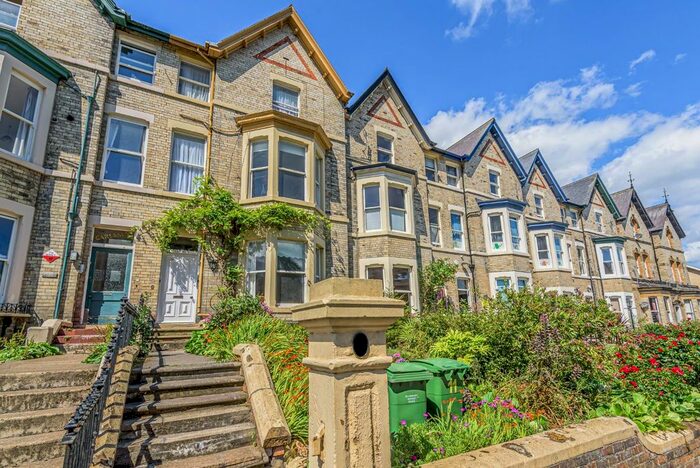
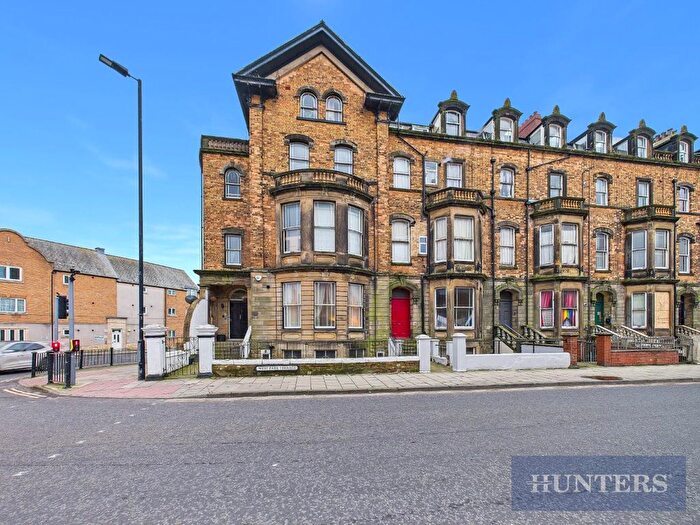
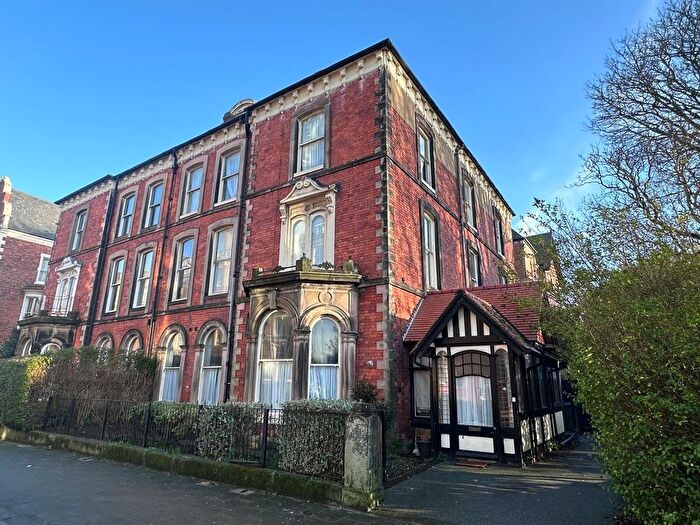
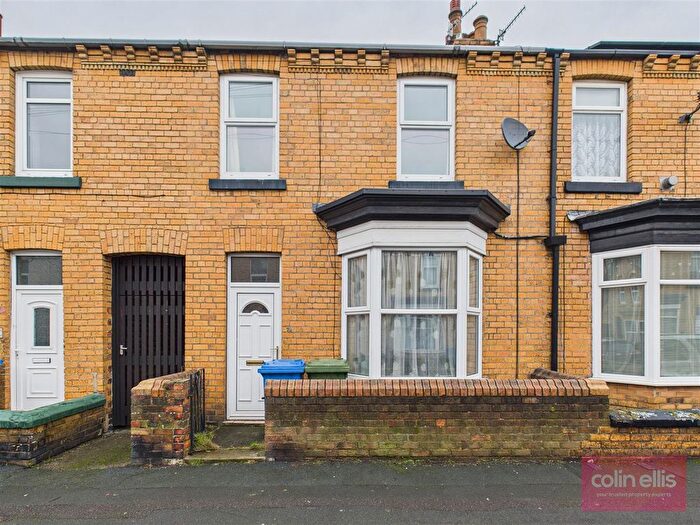
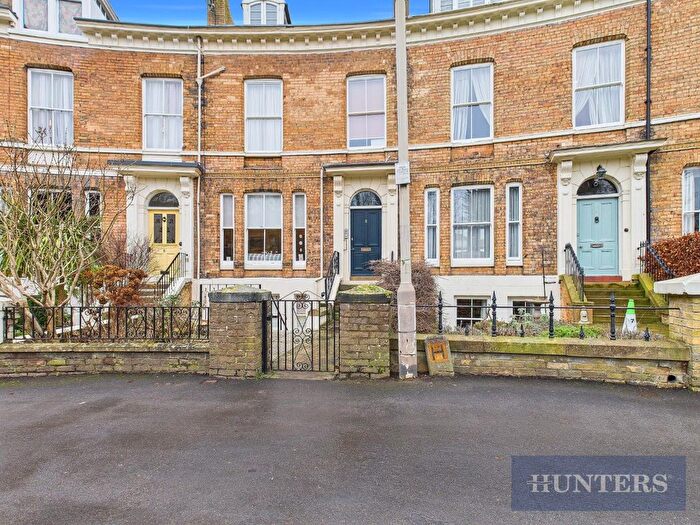
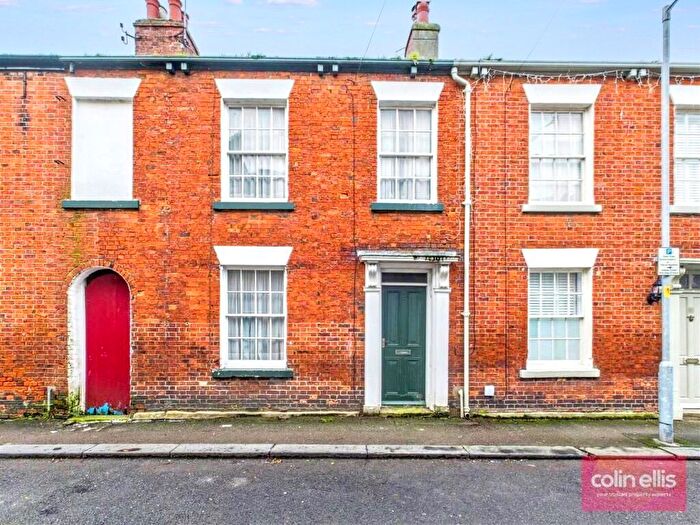
Houses for sale & to rent in Central, Scarborough
House Prices in Central
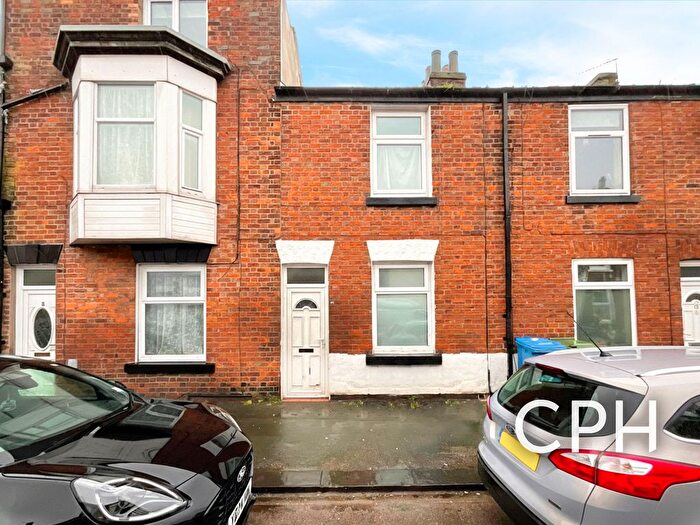
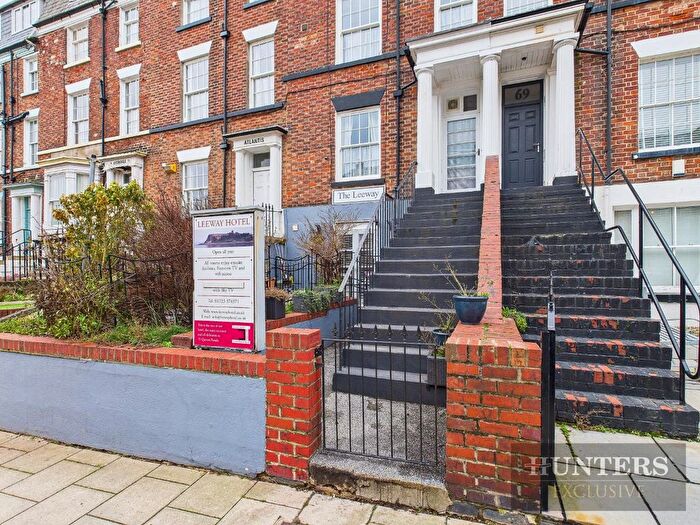
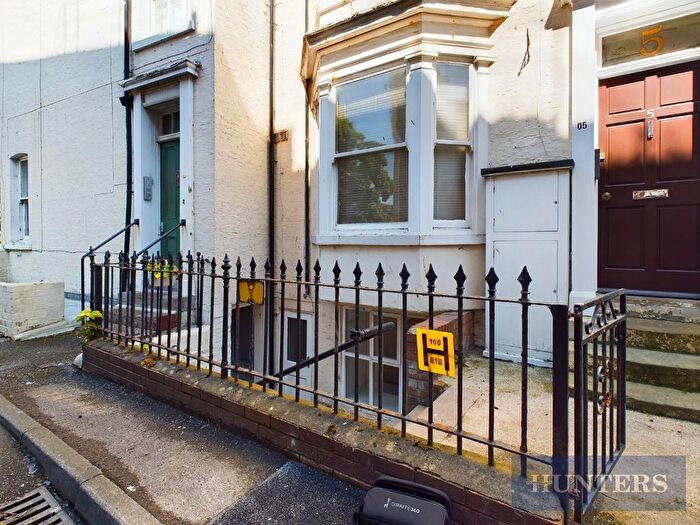
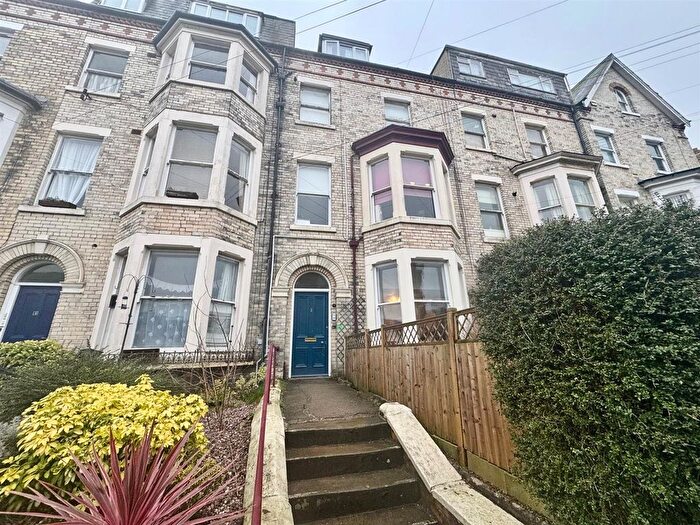
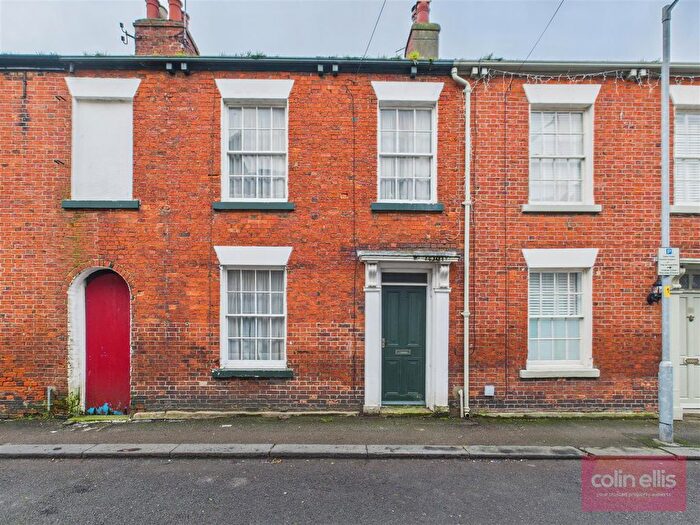
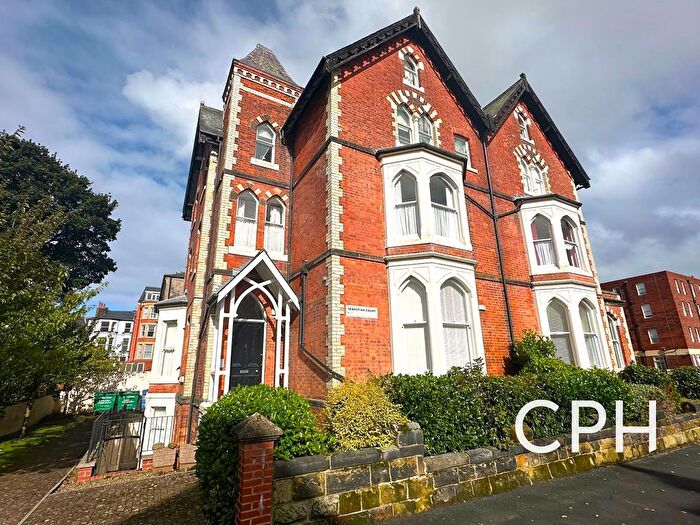
Properties in Central have an average house price of £137,167.00 and had 297 Property Transactions within the last 3 years¹.
Central is an area in Scarborough, North Yorkshire with 1,960 households², where the most expensive property was sold for £380,000.00.
Properties for sale in Central
Previously listed properties in Central
Roads and Postcodes in Central
Navigate through our locations to find the location of your next house in Central, Scarborough for sale or to rent.
| Streets | Postcodes |
|---|---|
| Barwick Street | YO12 7AP |
| Barwick Terrace | YO12 7AR |
| Belle Vue Street | YO12 7EL YO12 7EP |
| Brinkburn Road | YO12 7DE |
| Britannia Street | YO12 7DN |
| Caledonia Street | YO12 7DP YO12 7DW |
| Cambridge Street | YO12 7ED |
| Candler Street | YO12 7DF YO12 7DG YO12 7DQ |
| Cleveland Road | YO12 7BG |
| Clifton Street | YO12 7SR |
| Columbus Ravine | YO12 7JR YO12 7JT YO12 7QT |
| Fairfax Street | YO12 7DL |
| Franklin Street | YO12 7JU |
| Garfield Road | YO12 7LJ |
| Gladstone Lane | YO12 7BP YO12 7BS |
| Gladstone Road | YO12 7BJ YO12 7BL YO12 7BQ |
| Gladstone Street | YO12 7BN |
| Gordon Street | YO12 7RU YO12 7RX |
| Hibernia Street | YO12 7DH |
| Hoxton Road | YO12 7ST YO12 7SX YO12 7SY |
| Ireton Street | YO12 7DR |
| Livingstone Road | YO12 7LH |
| Melrose Street | YO12 7SH |
| Morgan Street | YO12 7BU |
| Murchison Street | YO12 7RN YO12 7RP YO12 7RW |
| Nelson Street | YO12 7SZ YO12 7TA |
| Northway | YO12 7AG |
| Norwood Place | YO12 7AW |
| Norwood Street | YO12 7EG YO12 7EQ |
| Prospect Road | YO12 7JP YO12 7JX YO12 7JY YO12 7LA YO12 7LD YO12 7LE YO12 7LF |
| Raleigh Street | YO12 7JZ YO12 7LG |
| Roscoe Street | YO12 7BX YO12 7BY |
| Rothbury Street | YO12 7DS YO12 7DT |
| Sherwood Street | YO11 1SR |
| Tindall Street | YO12 7EE YO12 7EF |
| Trafalgar Street West | YO12 7AU YO12 7AX |
| Victoria Road | YO11 1SB YO11 1SH YO11 1SP YO11 1SY |
| Victoria Street | YO12 7SS |
| Vine Street | YO11 1XN |
| West Parade Mews | YO12 5ED |
| Windmill View | YO12 7EH |
| Wooler Street | YO12 7DD |
Transport near Central
- FAQ
- Price Paid By Year
- Property Type Price
Frequently asked questions about Central
What is the average price for a property for sale in Central?
The average price for a property for sale in Central is £137,167. This amount is 33% lower than the average price in Scarborough. There are 2,153 property listings for sale in Central.
What streets have the most expensive properties for sale in Central?
The streets with the most expensive properties for sale in Central are West Parade Mews at an average of £236,000, Columbus Ravine at an average of £192,340 and Victoria Road at an average of £185,000.
What streets have the most affordable properties for sale in Central?
The streets with the most affordable properties for sale in Central are Roscoe Street at an average of £87,500, Nelson Street at an average of £100,894 and Vine Street at an average of £102,000.
Which train stations are available in or near Central?
Some of the train stations available in or near Central are Scarborough, Seamer and Filey.
Property Price Paid in Central by Year
The average sold property price by year was:
| Year | Average Sold Price | Price Change |
Sold Properties
|
|---|---|---|---|
| 2025 | £135,305 | -5% |
95 Properties |
| 2024 | £141,769 | 5% |
101 Properties |
| 2023 | £134,317 | -6% |
101 Properties |
| 2022 | £142,886 | 11% |
125 Properties |
| 2021 | £127,872 | 7% |
129 Properties |
| 2020 | £118,708 | 6% |
91 Properties |
| 2019 | £111,335 | -6% |
116 Properties |
| 2018 | £117,518 | 4% |
110 Properties |
| 2017 | £112,598 | 11% |
112 Properties |
| 2016 | £100,493 | -10% |
115 Properties |
| 2015 | £110,615 | 5% |
101 Properties |
| 2014 | £104,569 | -0,2% |
82 Properties |
| 2013 | £104,755 | -1% |
81 Properties |
| 2012 | £105,484 | 8% |
72 Properties |
| 2011 | £97,037 | -10% |
77 Properties |
| 2010 | £107,107 | 10% |
71 Properties |
| 2009 | £96,168 | -13% |
57 Properties |
| 2008 | £108,595 | -10% |
89 Properties |
| 2007 | £119,668 | 7% |
142 Properties |
| 2006 | £111,769 | 3% |
157 Properties |
| 2005 | £108,724 | 11% |
139 Properties |
| 2004 | £96,944 | 24% |
139 Properties |
| 2003 | £73,737 | 23% |
199 Properties |
| 2002 | £57,086 | 20% |
198 Properties |
| 2001 | £45,403 | 6% |
155 Properties |
| 2000 | £42,556 | 8% |
164 Properties |
| 1999 | £39,088 | 4% |
156 Properties |
| 1998 | £37,578 | 1% |
130 Properties |
| 1997 | £37,330 | -3% |
145 Properties |
| 1996 | £38,334 | 5% |
109 Properties |
| 1995 | £36,291 | - |
123 Properties |
Property Price per Property Type in Central
Here you can find historic sold price data in order to help with your property search.
The average Property Paid Price for specific property types in the last three years are:
| Property Type | Average Sold Price | Sold Properties |
|---|---|---|
| Semi Detached House | £174,214.00 | 14 Semi Detached Houses |
| Detached House | £111,250.00 | 2 Detached Houses |
| Terraced House | £137,118.00 | 272 Terraced Houses |
| Flat | £86,777.00 | 9 Flats |

