
Houses for sale & to rent in Barlby, Selby
House Prices in Barlby
Properties in Barlby have an average house price of £213k and had 200 Property Transactions within the last 3 years¹.
Barlby is an area in Selby, North Yorkshire with 1,662 households², where the most expensive property was sold for £530k.
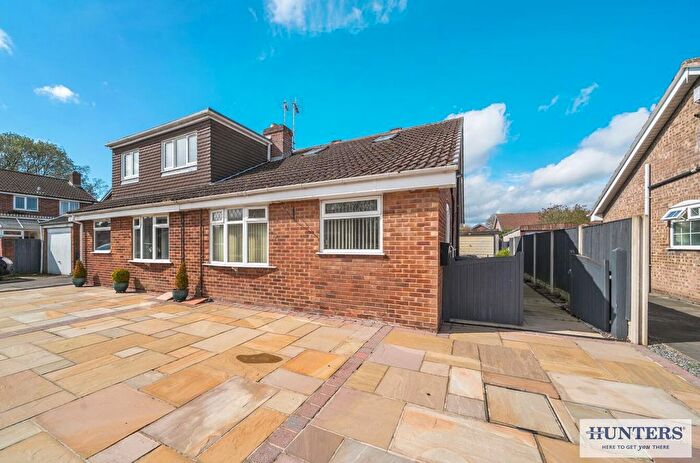
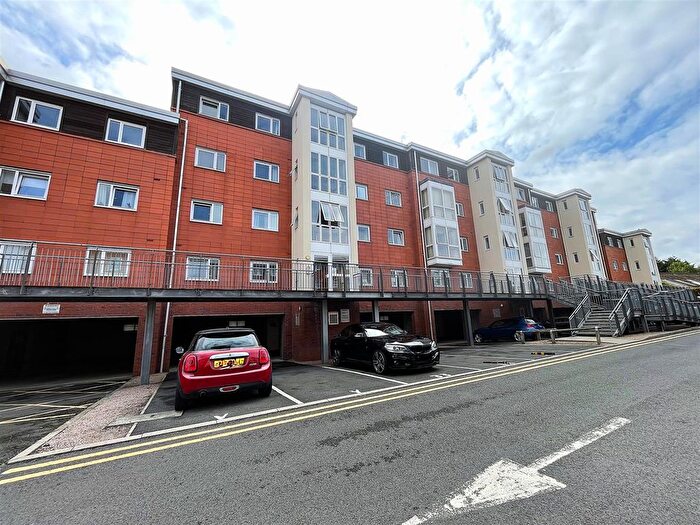
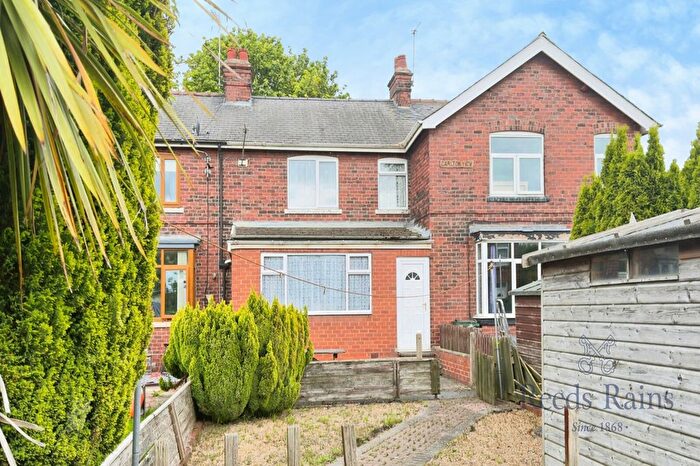
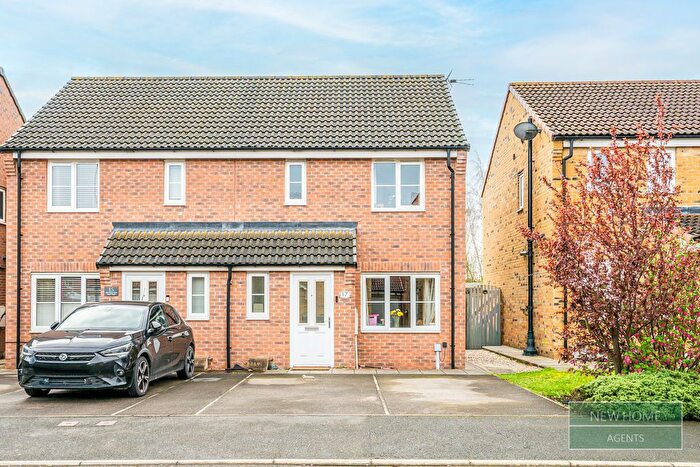
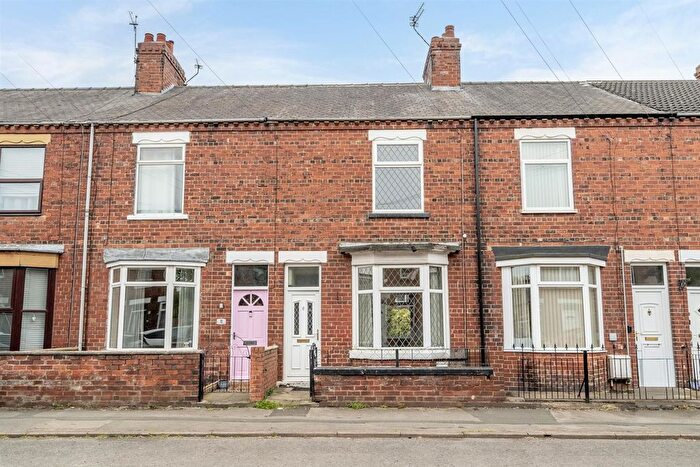
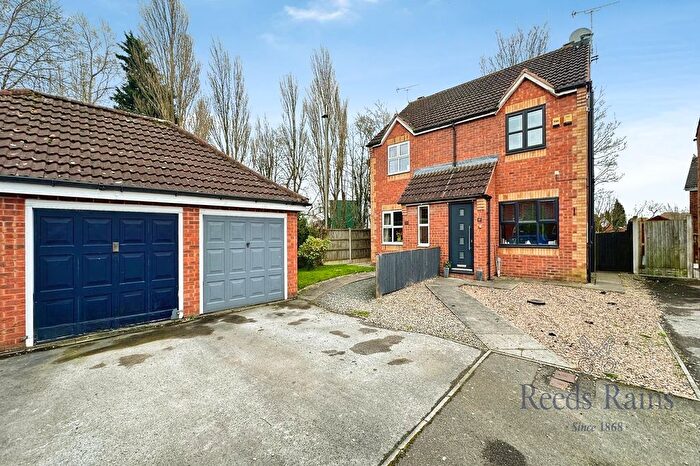
Properties for sale in Barlby
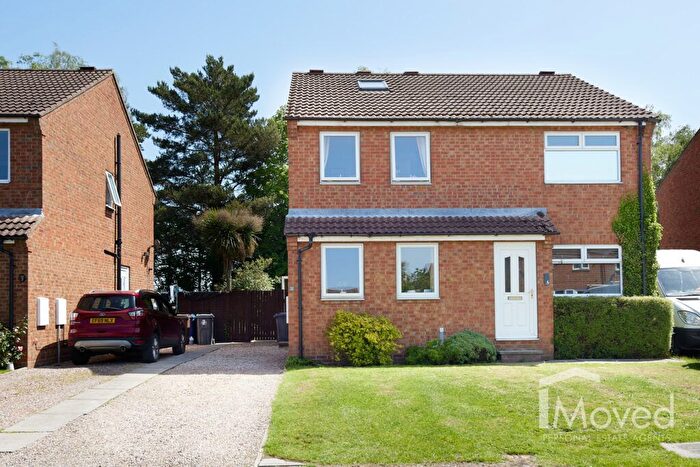
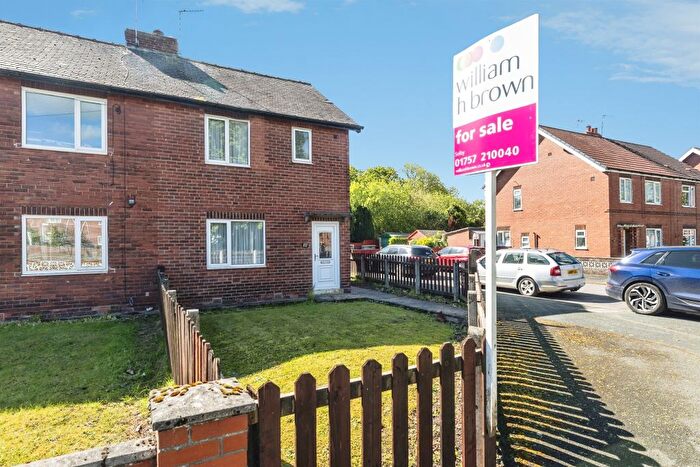
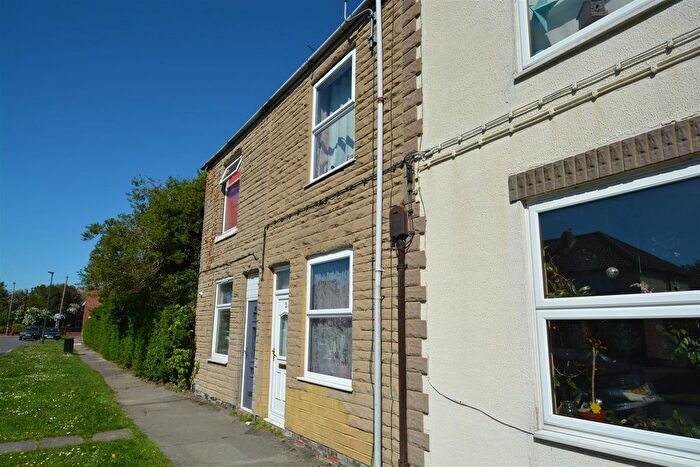
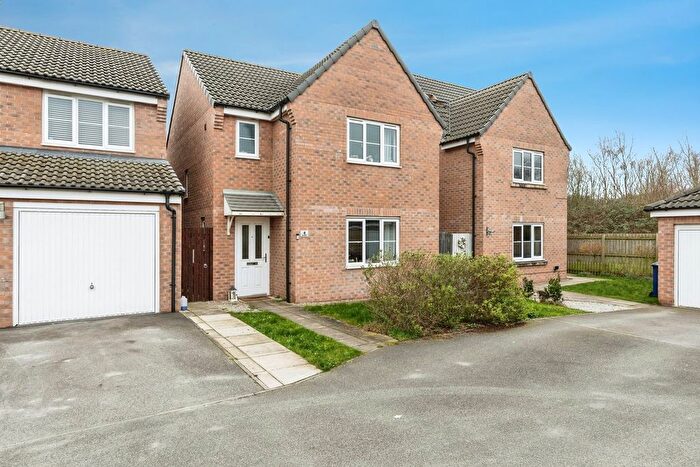
![]()
If you are looking to sell your house, let it out, or receive a property valuation, an expert can help you.
Click the button below to get started.
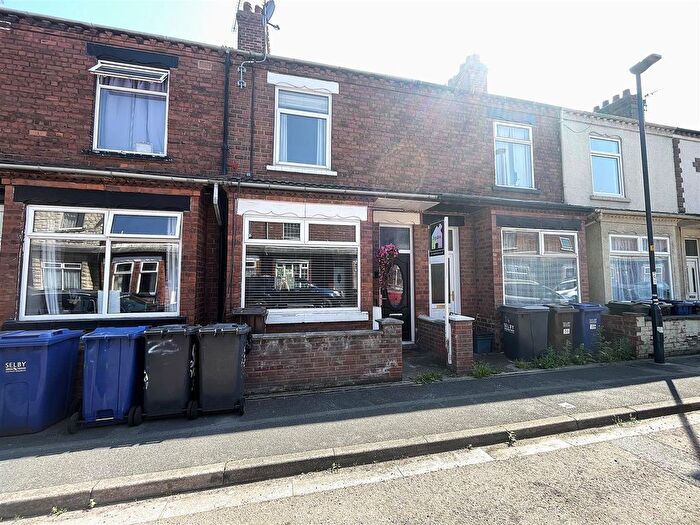
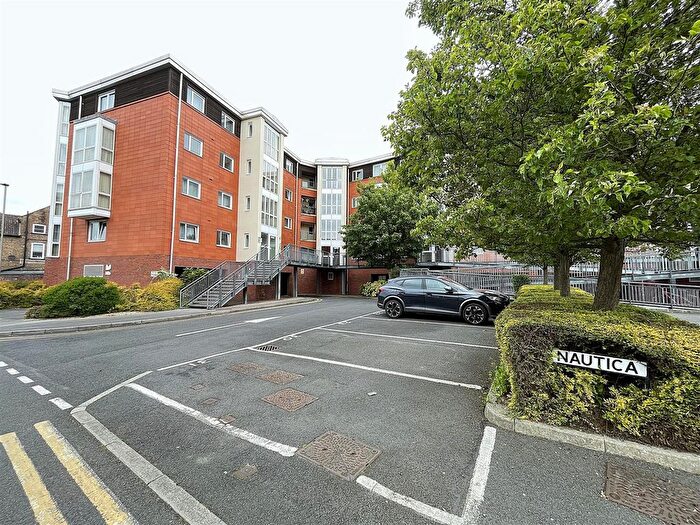
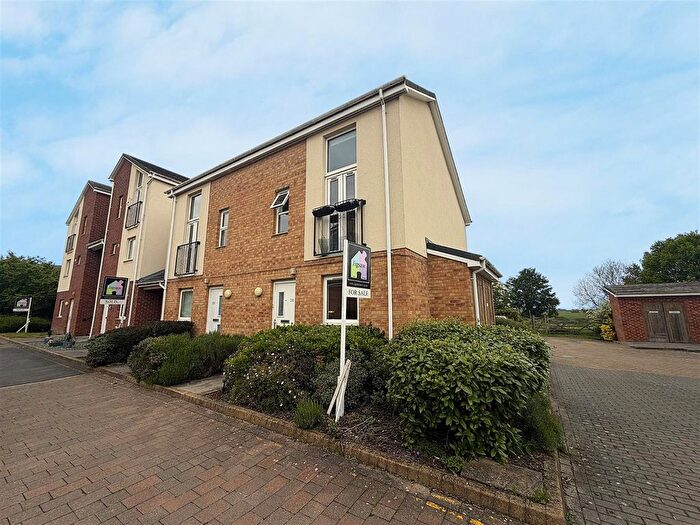
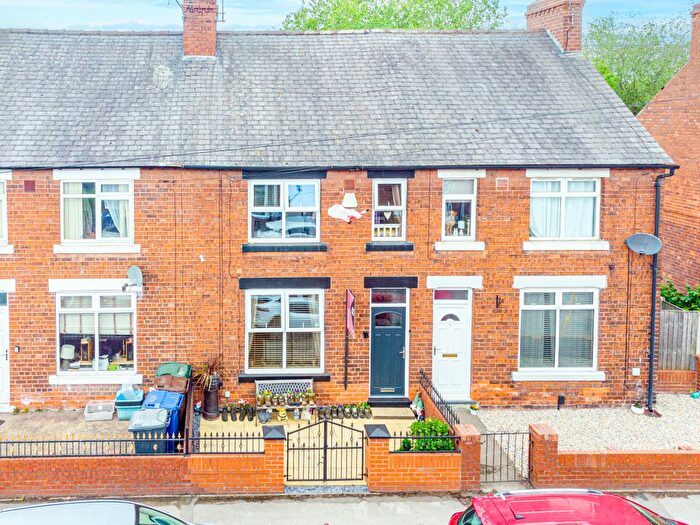
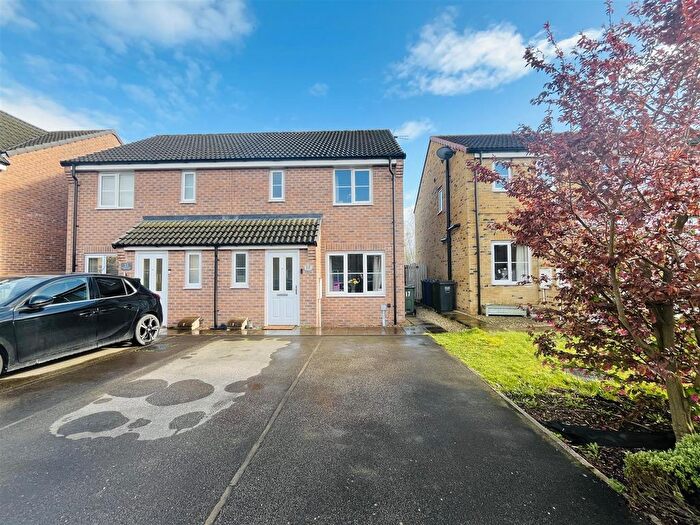
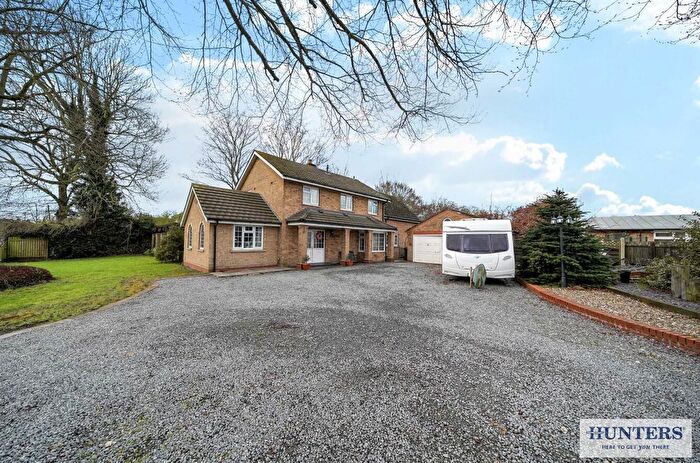
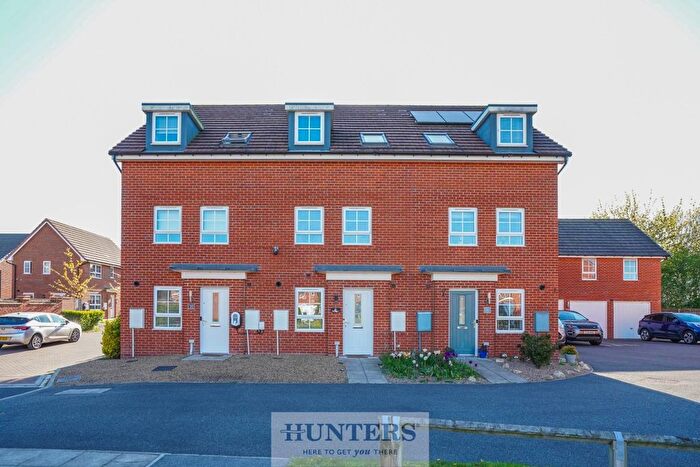
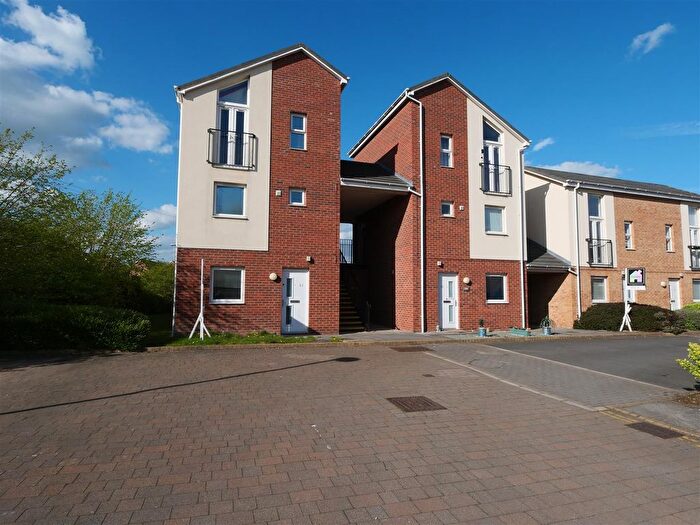
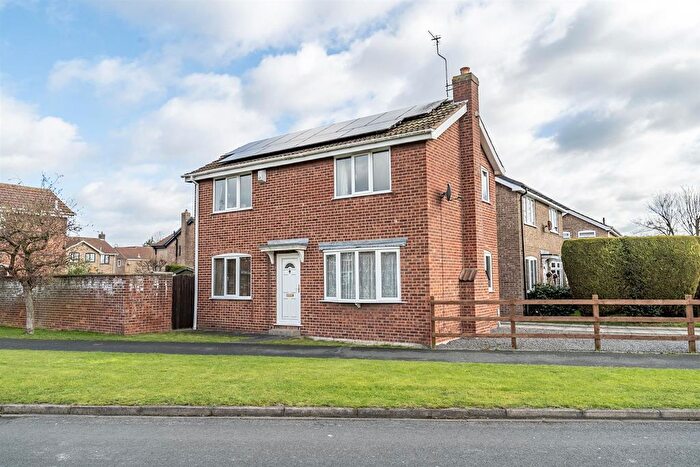
Previously listed properties in Barlby
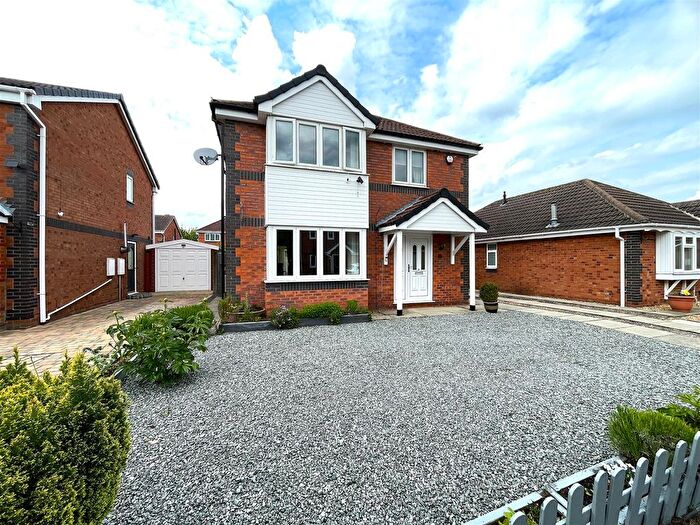
![]()
If you are looking to sell your house, let it out, or receive a property valuation, an expert can help you.
Click the button below to get started.
Roads and Postcodes in Barlby
Navigate through our locations to find the location of your next house in Barlby, Selby for sale or to rent.
| Streets | Postcodes |
|---|---|
| Acorn Close | YO8 5UT |
| Acorn Cottages | YO8 5UW |
| Bank Road | YO8 5AN |
| Barlby Bank | YO8 5AX |
| Barlby Crescent | YO8 5BB |
| Barlby Road | YO8 5AA YO8 5AB YO8 5AD YO8 5AU YO8 5BA YO8 5BE |
| Beech Croft | YO8 5UY |
| Bramley Avenue | YO8 5EY |
| Bungalow Road | YO8 5AW |
| Carr Lane | YO8 5BH |
| Cherry Tree Court | YO8 5XN |
| Cherry Tree Walk | YO8 5XW |
| Church Lane | YO8 5JG |
| Church Mews | YO8 5LL |
| Derwent Drive | YO8 5LH |
| Dutch Court | YO8 5XT |
| Elm Street | YO8 5AR |
| George Street | YO8 5AH |
| George Terrace | YO8 5HA |
| Glebe Garth | YO8 5NE |
| Grange Farm Close | YO8 5EU |
| Grove Park | YO8 5LP |
| Hall Park | YO8 5XR |
| Hawthorn Drive | YO8 5LQ |
| Highfield Crescent | YO8 5HD |
| Highfield View | YO8 5HB |
| Hill Top | YO8 5JQ |
| Howden Gardens | YO8 5BN |
| Howden Road | YO8 5JE |
| Ings Close | YO8 5XS |
| John Street | YO8 5AJ |
| Kings Close | YO8 5XG |
| Landing Close | YO8 5LG |
| Lowfield Road | YO8 5ZZ |
| Maple Tree Avenue | YO8 5XP |
| Market Weighton Road | YO8 5LB |
| Moor Carr Lane | YO8 5LJ |
| Ness Road | YO8 5AT |
| Northfield | YO8 5JS |
| Old School Lane | YO8 5JJ |
| Olympia Crescent | YO8 5AG |
| Ouse Bank | YO8 5AY |
| Peartree Close | YO8 5BT |
| Pindars Way | YO8 5XU |
| Pine Tree Mews | YO8 5GZ |
| Plantation Drive | YO8 5EX |
| Pond Street | YO8 5AS |
| Recreation Road | YO8 5AL |
| River Close | YO8 5JU |
| River Street | YO8 5AP |
| River View | YO8 5JT |
| Riverside Close | YO8 5BS |
| Rose Garth | YO8 5UZ |
| Sand Lane | YO8 5LA |
| Siding Lane | YO8 5JL |
| Springfield Close | YO8 5JW |
| Springfield Drive | YO8 5JN |
| Sycamore Court | YO8 5XF |
| Sycamore Road | YO8 5XA YO8 5XB YO8 5XD YO8 5XE |
| The Charters | YO8 5JD |
| The Laurels | YO8 5LW |
| Thomas Street | YO8 5AQ |
| Turnhead Court | YO8 5UX |
| Turnhead Crescent | YO8 5JX |
| West View | YO8 5BD |
| West View Mount | YO8 5JR |
| Wilfreds Grove | YO8 5JB |
| Wilfreds Road | YO8 5JA |
| Woodlands Close | YO8 5XQ |
| Woodlands Court | YO8 5XJ |
| Woodlands Drive | YO8 5XH |
| Woodlands View | YO8 5XL |
| York Road | YO8 5JH YO8 5JP YO8 5JY YO8 5JZ |
Transport near Barlby
-
 Selby Station
 -
Wressle Station
-
Snaith Station
-
Hensall Station
-
Sherburn-In-Elmet Station
-
Church Fenton Station
-
Howden Station
-
Ulleskelf Station
-
Whitley Bridge Station
-
Rawcliffe Station
- FAQ
- Price Paid By Year
- Property Type Price
Frequently asked questions about Barlby
What is the average price for a property for sale in Barlby?
The average price for a property for sale in Barlby is £213,262. This amount is 12% lower than the average price in Selby. There are 883 property listings for sale in Barlby.
What streets have the most expensive properties for sale in Barlby?
The streets with the most expensive properties for sale in Barlby are Glebe Garth at an average of £530,000, Kings Close at an average of £351,666 and Siding Lane at an average of £347,125.
What streets have the most affordable properties for sale in Barlby?
The streets with the most affordable properties for sale in Barlby are Sycamore Court at an average of £119,000, River View at an average of £138,333 and George Street at an average of £141,000.
Which train stations are available in or near Barlby?
Some of the train stations available in or near Barlby are Selby, Wressle and Snaith.
Property Price Paid in Barlby by Year
The average sold property price by year was:
| Year | Average Sold Price | Price Change |
Sold Properties
|
|---|---|---|---|
| 2026 | £250,600 | 15% |
5 Properties |
| 2025 | £213,368 | 1% |
74 Properties |
| 2024 | £210,577 | -1% |
68 Properties |
| 2023 | £213,036 | 7% |
53 Properties |
| 2022 | £198,627 | 7% |
74 Properties |
| 2021 | £184,407 | - |
103 Properties |
| 2020 | £184,340 | 0,5% |
78 Properties |
| 2019 | £183,488 | 11% |
101 Properties |
| 2018 | £162,922 | 5% |
67 Properties |
| 2017 | £155,118 | 1% |
83 Properties |
| 2016 | £153,740 | 2% |
94 Properties |
| 2015 | £151,142 | 9% |
87 Properties |
| 2014 | £138,139 | -8% |
106 Properties |
| 2013 | £149,062 | 9% |
60 Properties |
| 2012 | £136,382 | 8% |
70 Properties |
| 2011 | £126,107 | -20% |
57 Properties |
| 2010 | £151,831 | 23% |
52 Properties |
| 2009 | £116,586 | -27% |
44 Properties |
| 2008 | £147,973 | 2% |
65 Properties |
| 2007 | £145,148 | 1% |
124 Properties |
| 2006 | £143,229 | 14% |
144 Properties |
| 2005 | £122,991 | -7% |
100 Properties |
| 2004 | £131,951 | 20% |
110 Properties |
| 2003 | £105,073 | 21% |
113 Properties |
| 2002 | £82,638 | 21% |
135 Properties |
| 2001 | £64,960 | 0,1% |
126 Properties |
| 2000 | £64,893 | 17% |
122 Properties |
| 1999 | £53,942 | 3% |
126 Properties |
| 1998 | £52,135 | 0,1% |
95 Properties |
| 1997 | £52,083 | 3% |
91 Properties |
| 1996 | £50,504 | 1% |
86 Properties |
| 1995 | £49,985 | - |
93 Properties |
Property Price per Property Type in Barlby
Here you can find historic sold price data in order to help with your property search.
The average Property Paid Price for specific property types in the last three years are:
| Property Type | Average Sold Price | Sold Properties |
|---|---|---|
| Semi Detached House | £207,379.00 | 77 Semi Detached Houses |
| Detached House | £287,609.00 | 48 Detached Houses |
| Terraced House | £177,471.00 | 70 Terraced Houses |
| Flat | £91,200.00 | 5 Flats |