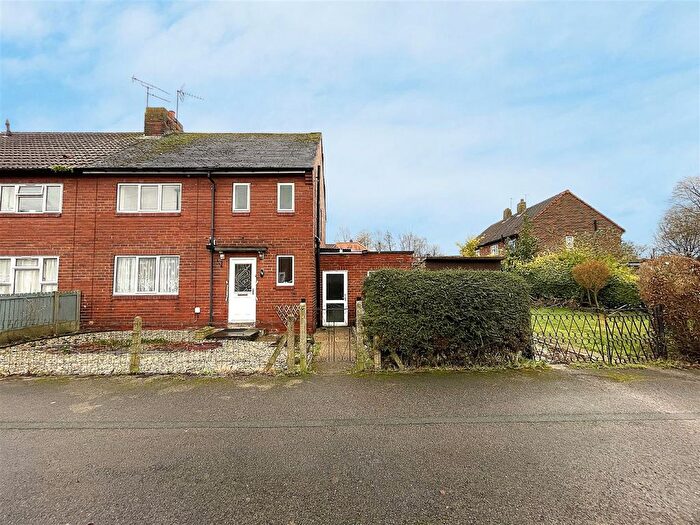
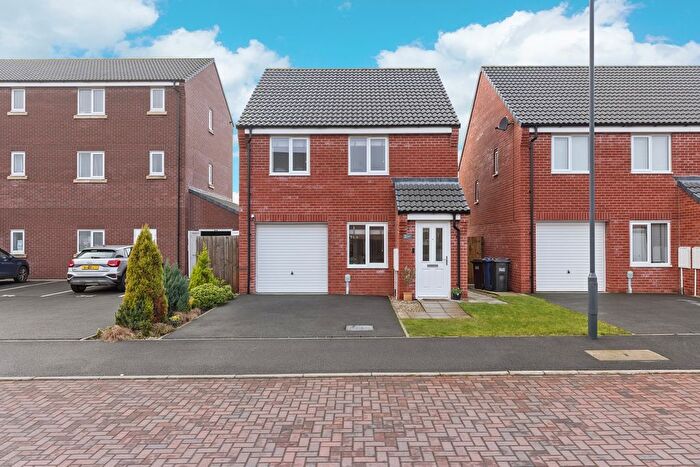
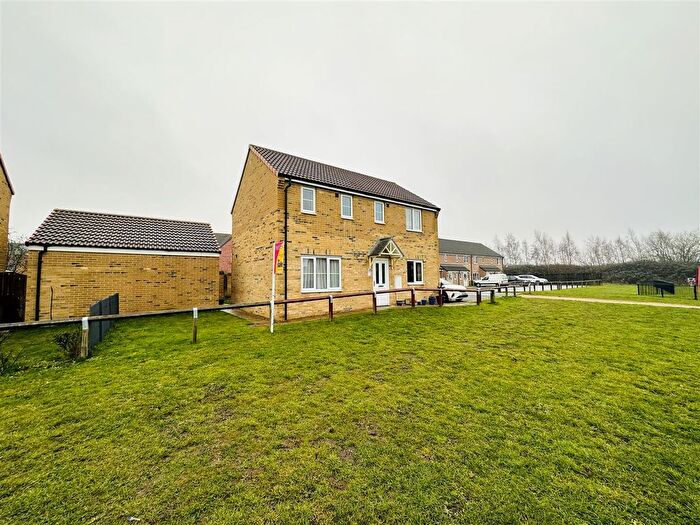
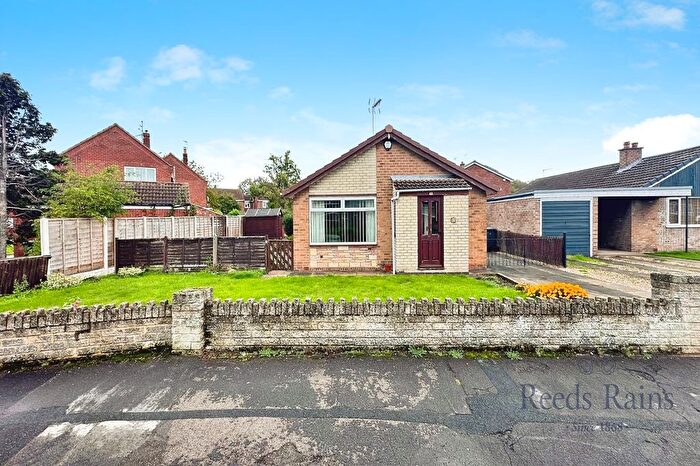
Houses for sale & to rent in Selby South, Selby
House Prices in Selby South
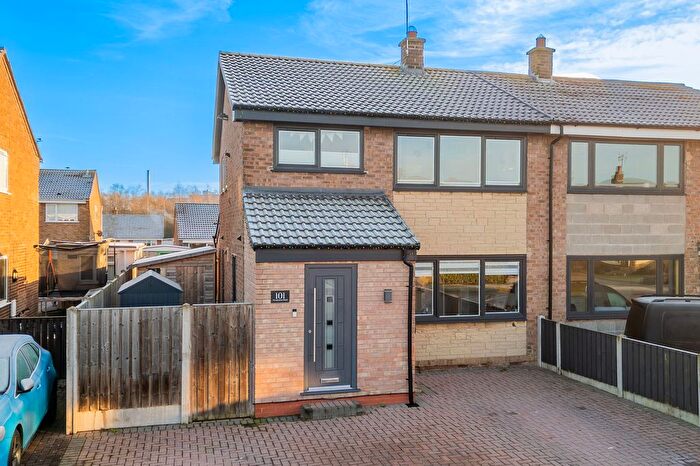
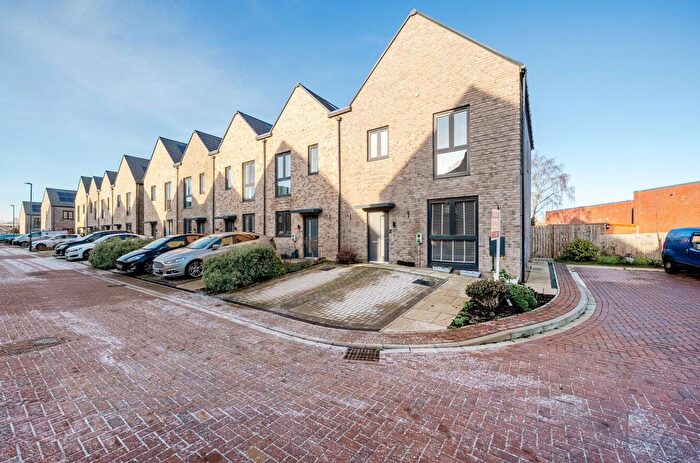
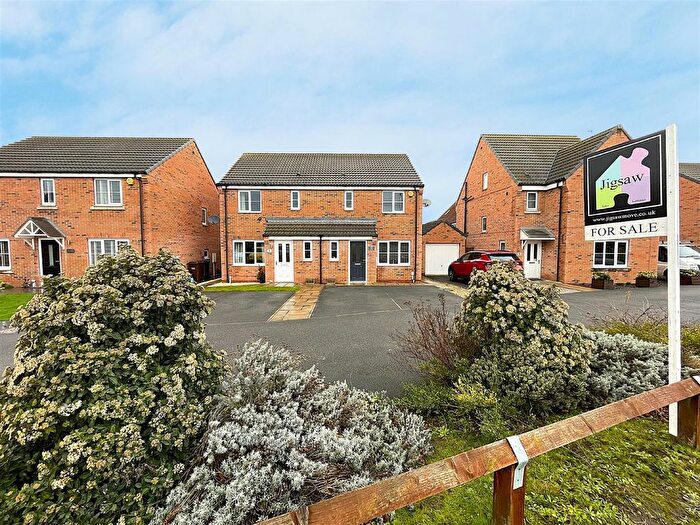
Properties in Selby South have an average house price of £177,400.00 and had 251 Property Transactions within the last 3 years¹.
Selby South is an area in Selby, North Yorkshire with 1,895 households², where the most expensive property was sold for £620,000.00.
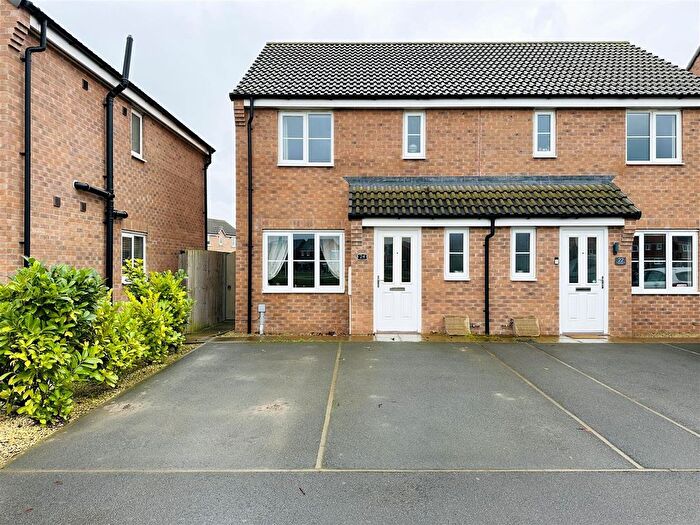
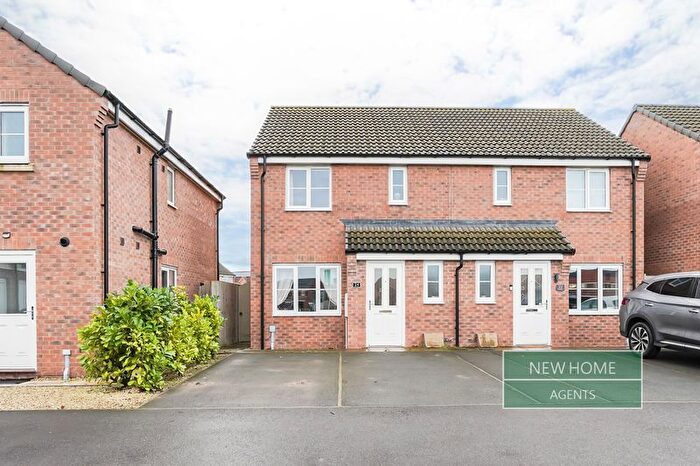
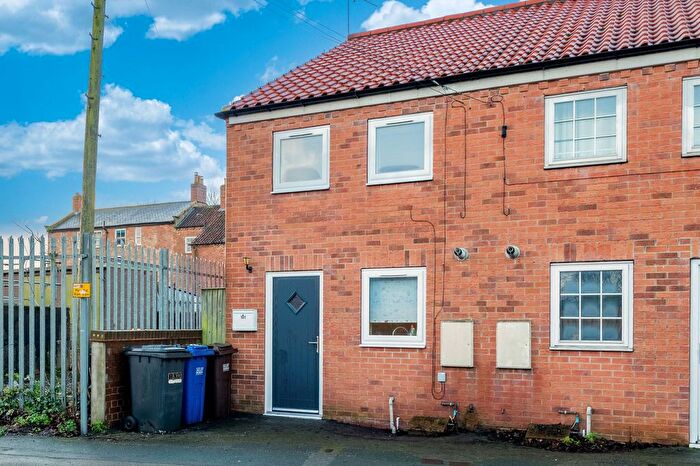
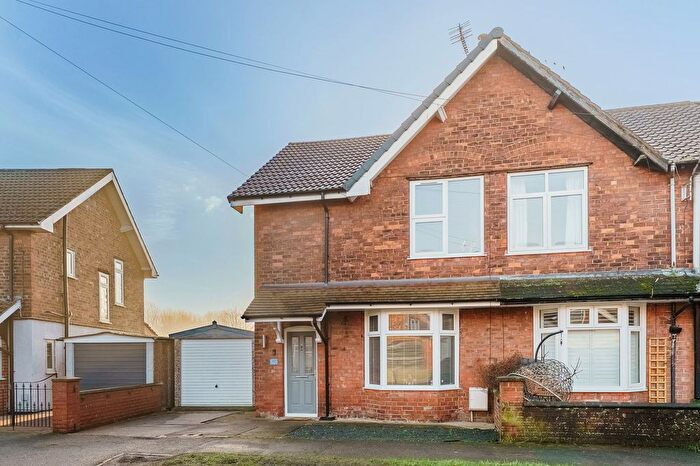
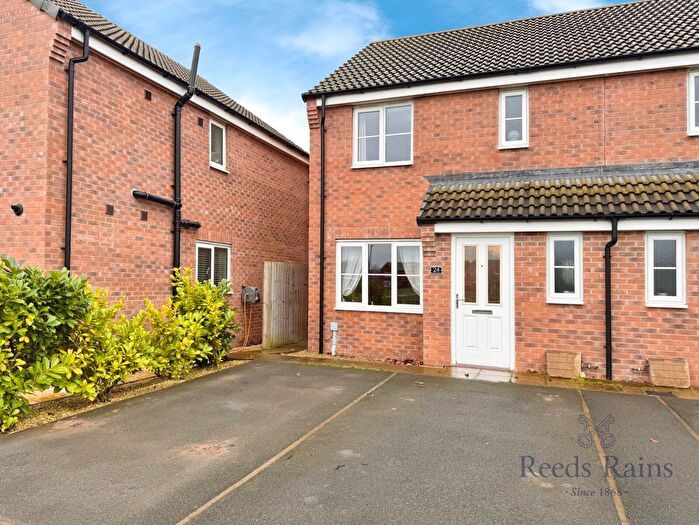
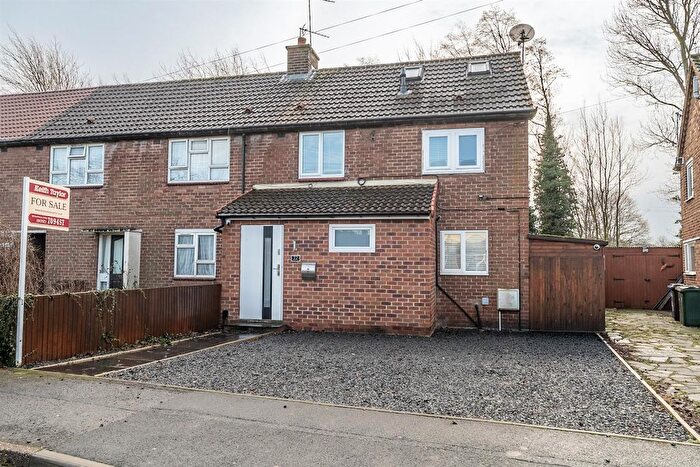
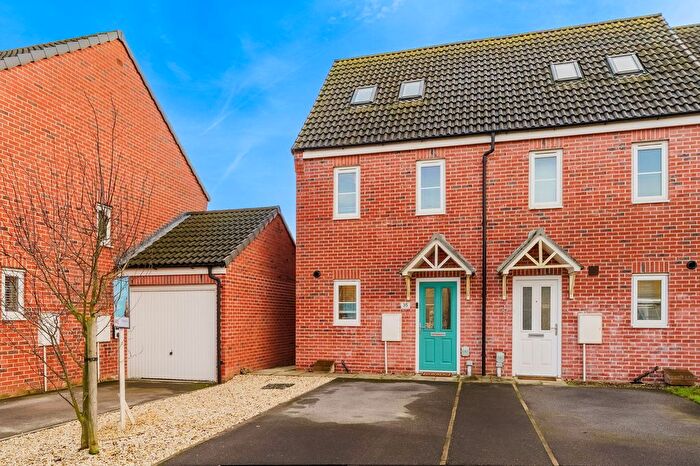
Properties for sale in Selby South
Previously listed properties in Selby South
Roads and Postcodes in Selby South
Navigate through our locations to find the location of your next house in Selby South, Selby for sale or to rent.
| Streets | Postcodes |
|---|---|
| Abbey Place | YO8 4PF |
| Abbots Court | YO8 8BF |
| Abbots Mews | YO8 8RS |
| Abbots Road | YO8 8AS YO8 8AU YO8 8AY YO8 8AZ YO8 8BA |
| Alder Close | YO8 8RP |
| Ash Way | YO8 8RX |
| Ashlea Close | YO8 4NY |
| Back Micklegate | YO8 3GH |
| Bainbridge Drive | YO8 4QN |
| Barfoss Place | YO8 4QT |
| Bawtry Close | YO8 8DX |
| Bawtry Road | YO8 8NB |
| Benedict Avenue | YO8 8BB |
| Canal Road | YO8 8AG |
| Carlton View | YO8 8AD |
| Carr Street | YO8 8AW |
| Cedar Court | YO8 8FH |
| Cedar Road | YO8 8GB YO8 8RR |
| Cedar Way | YO8 8SD |
| Chestnut Way | YO8 8RG |
| Church Avenue | YO8 4PG |
| Church Hill | YO8 4PL |
| Church Lane | YO8 4PQ |
| Cochrane Street | YO8 8DU |
| Darcy Road | YO8 8BS YO8 8BX |
| Denison Road | YO8 8AN YO8 8AQ YO8 8BZ YO8 8DA |
| East Common Lane | YO8 8EG |
| Eden Avenue | YO8 8DR |
| Elm Close | YO8 8RW |
| Fernlea Close | YO8 4NZ |
| Finkle Street | YO8 4DS |
| Fir Tree Close | YO8 8FT |
| Fostergate | YO8 8DZ |
| Germain Close | YO8 8SA |
| Germain Road | YO8 8DH |
| Hardy Street | YO8 8DQ |
| Harold Street | YO8 8AR |
| Hawdon Avenue | YO8 4QJ |
| Hawthorn Road | YO8 8RQ |
| Hornbeam Close | YO8 8FS |
| Jesse Close | YO8 8SB |
| Juniper Drive | YO8 8RZ |
| Kirkland Close | YO8 8EB |
| Kitchen Drive | YO8 8EA |
| Larch Road | YO8 8RJ |
| Larch Way | YO8 8RH |
| Lowther Drive | YO8 8DP |
| Micklegate | YO8 4EA |
| Millgate | YO8 3JX |
| Mulberry Close | YO8 8FL |
| New Street | YO8 4PT |
| Oak Way | YO8 8RL |
| Ousegate | YO8 4NJ YO8 8BL |
| Oxford Terrace | YO8 8DD |
| Pagnell Avenue | YO8 8DG |
| Park Row | YO8 4PR |
| Park Street | YO8 4PW YO8 4QL |
| Petre Avenue | YO8 8DJ YO8 8DN YO8 8DW |
| Portholme Court | YO8 4QG |
| Portholme Drive | YO8 4QF |
| Portholme Road | YO8 4QH YO8 4QQ |
| Portholme Villas | YO8 4AX |
| Reginald Terrace | YO8 8AB |
| Robert Street | YO8 4DY |
| Rowan Court | YO8 8RU |
| Spruce Way | YO8 8FJ |
| Station Houses | YO8 8BH |
| Station Road | YO8 4NW |
| Sycamore Mews | YO8 8RT |
| The Crescent | YO8 4PD YO8 4PU |
| The Haven | YO8 8BJ |
| The Waterfront | YO8 8FB YO8 8FD YO8 8FE |
| Volta Street | YO8 8DE YO8 8DF |
| Willow Court | YO8 8RN |
| Willow Gardens | YO8 8SH |
| Willow Green | YO8 8SG |
| Woodville Terrace | YO8 8AH YO8 8AJ YO8 8AL |
| Wren Lane | YO8 4PH |
Transport near Selby South
-
Selby Station
-
Wressle Station
-
Hensall Station
-
Snaith Station
-
Whitley Bridge Station
-
Sherburn-In-Elmet Station
-
Rawcliffe Station
-
Church Fenton Station
-
South Milford Station
-
Ulleskelf Station
- FAQ
- Price Paid By Year
- Property Type Price
Frequently asked questions about Selby South
What is the average price for a property for sale in Selby South?
The average price for a property for sale in Selby South is £177,400. This amount is 27% lower than the average price in Selby. There are 835 property listings for sale in Selby South.
What streets have the most expensive properties for sale in Selby South?
The streets with the most expensive properties for sale in Selby South are East Common Lane at an average of £620,000, Jesse Close at an average of £343,889 and Sycamore Mews at an average of £318,250.
What streets have the most affordable properties for sale in Selby South?
The streets with the most affordable properties for sale in Selby South are Portholme Court at an average of £91,000, Hardy Street at an average of £100,000 and Cedar Way at an average of £103,500.
Which train stations are available in or near Selby South?
Some of the train stations available in or near Selby South are Selby, Wressle and Hensall.
Property Price Paid in Selby South by Year
The average sold property price by year was:
| Year | Average Sold Price | Price Change |
Sold Properties
|
|---|---|---|---|
| 2025 | £181,005 | 3% |
73 Properties |
| 2024 | £174,890 | -1% |
97 Properties |
| 2023 | £177,158 | 1% |
81 Properties |
| 2022 | £175,083 | 5% |
92 Properties |
| 2021 | £165,755 | 14% |
108 Properties |
| 2020 | £143,214 | -1% |
84 Properties |
| 2019 | £144,769 | 1% |
100 Properties |
| 2018 | £143,956 | 2% |
95 Properties |
| 2017 | £141,344 | 1% |
106 Properties |
| 2016 | £140,065 | -3% |
107 Properties |
| 2015 | £144,298 | 7% |
133 Properties |
| 2014 | £133,544 | -8% |
120 Properties |
| 2013 | £143,841 | -4% |
112 Properties |
| 2012 | £149,591 | 5% |
97 Properties |
| 2011 | £141,829 | 8% |
84 Properties |
| 2010 | £130,688 | 1% |
92 Properties |
| 2009 | £129,814 | -4% |
71 Properties |
| 2008 | £134,672 | -13% |
90 Properties |
| 2007 | £152,106 | 10% |
282 Properties |
| 2006 | £137,258 | 9% |
229 Properties |
| 2005 | £125,003 | 26% |
80 Properties |
| 2004 | £92,958 | 16% |
59 Properties |
| 2003 | £78,358 | 20% |
78 Properties |
| 2002 | £62,735 | 26% |
63 Properties |
| 2001 | £46,224 | 14% |
63 Properties |
| 2000 | £39,741 | 10% |
54 Properties |
| 1999 | £35,770 | -3% |
60 Properties |
| 1998 | £36,857 | -5% |
45 Properties |
| 1997 | £38,633 | 7% |
49 Properties |
| 1996 | £35,801 | 2% |
32 Properties |
| 1995 | £35,067 | - |
46 Properties |
Property Price per Property Type in Selby South
Here you can find historic sold price data in order to help with your property search.
The average Property Paid Price for specific property types in the last three years are:
| Property Type | Average Sold Price | Sold Properties |
|---|---|---|
| Semi Detached House | £183,869.00 | 69 Semi Detached Houses |
| Detached House | £290,853.00 | 38 Detached Houses |
| Terraced House | £160,862.00 | 104 Terraced Houses |
| Flat | £101,462.00 | 40 Flats |

