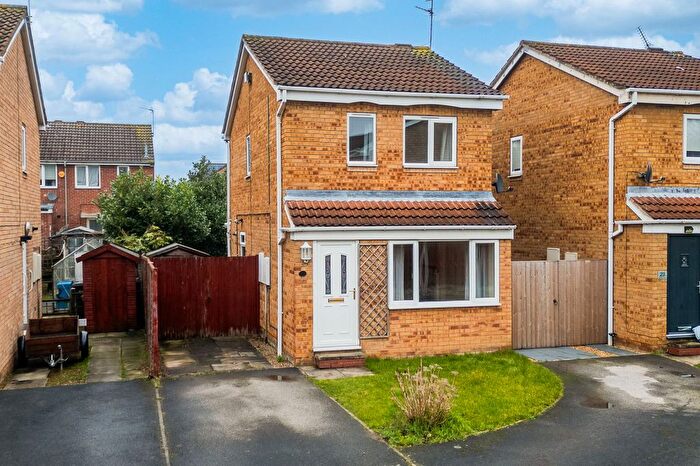
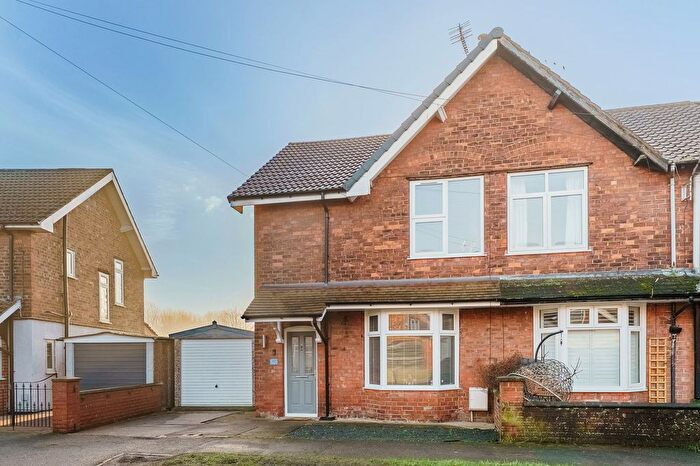
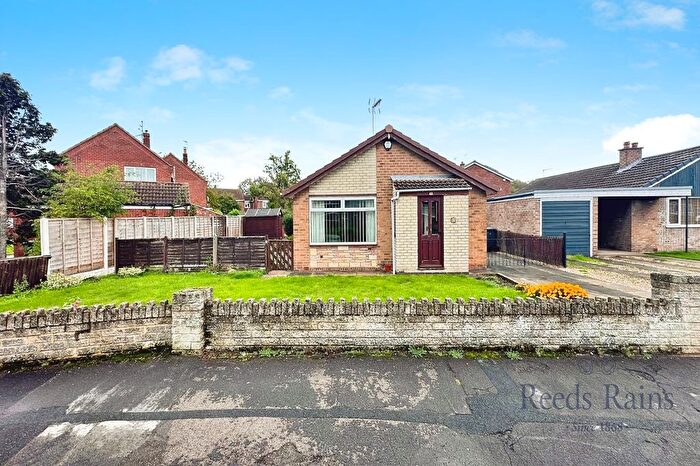
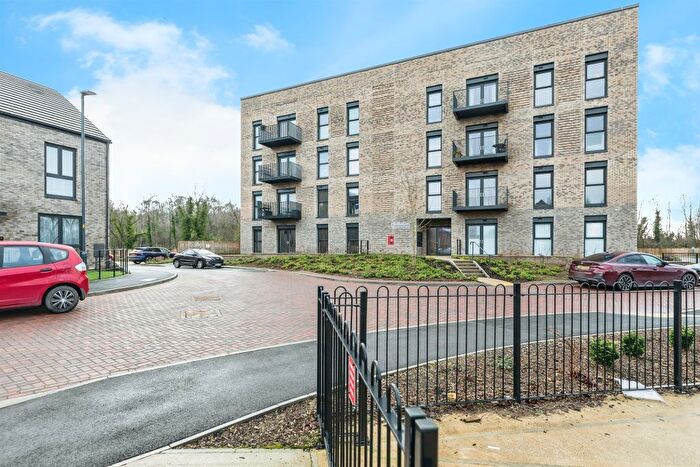
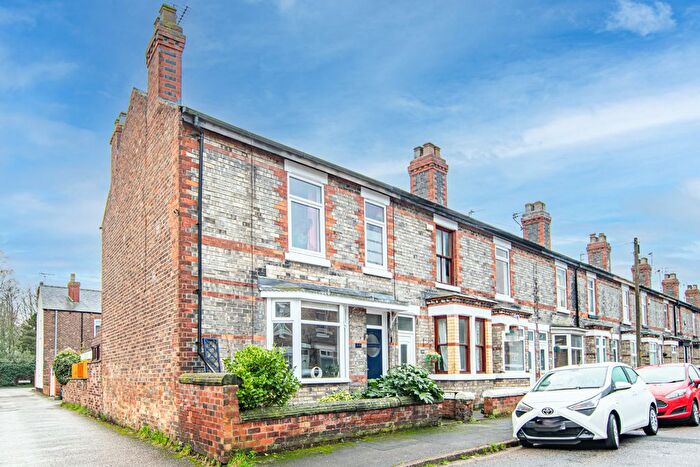
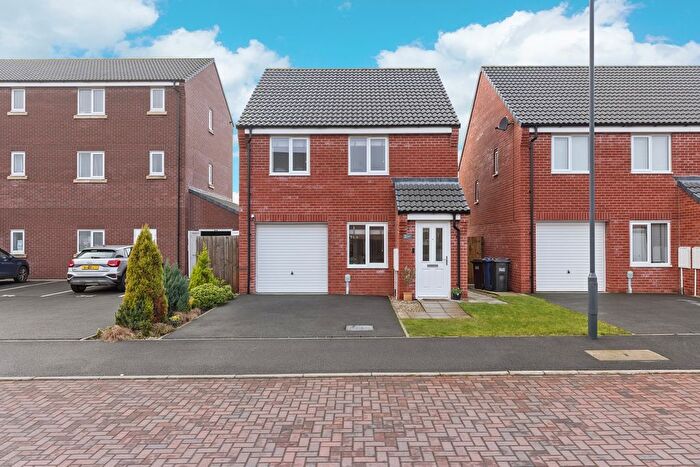
Houses for sale & to rent in Selby East, Selby
House Prices in Selby East
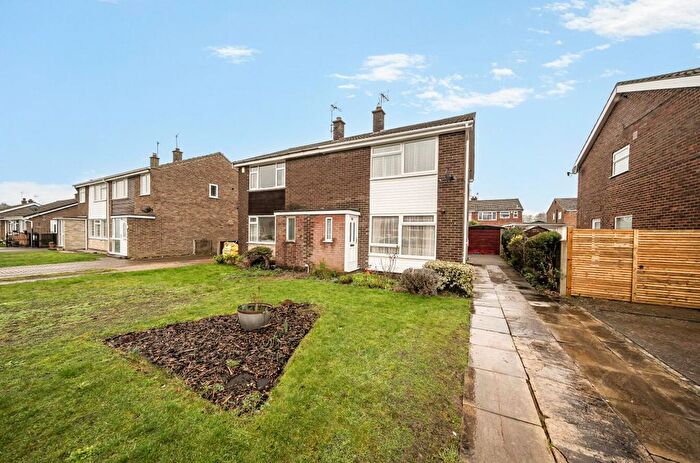
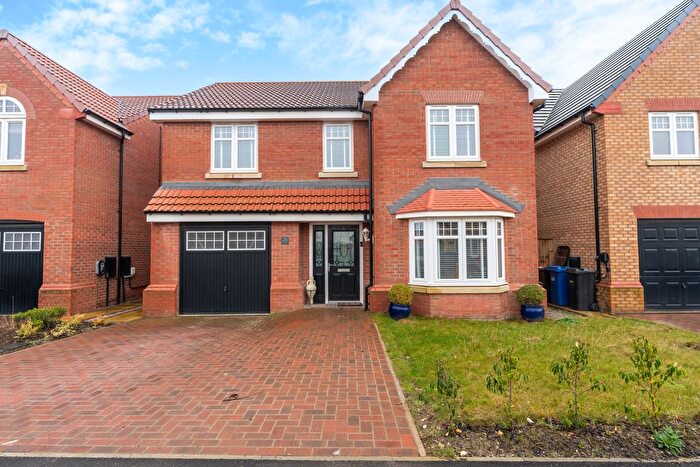
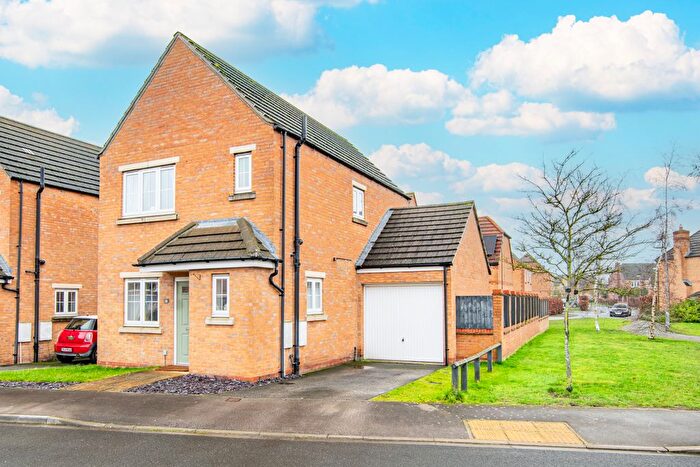
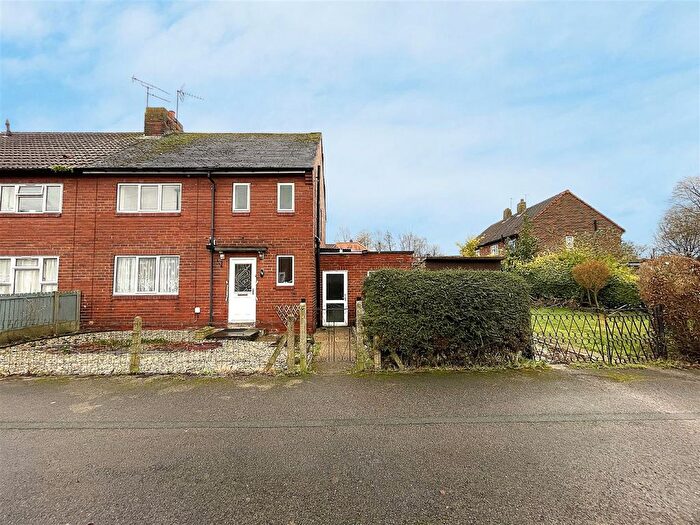
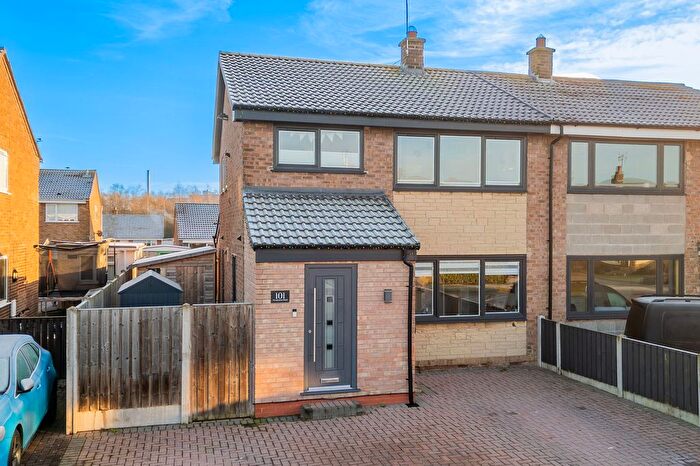
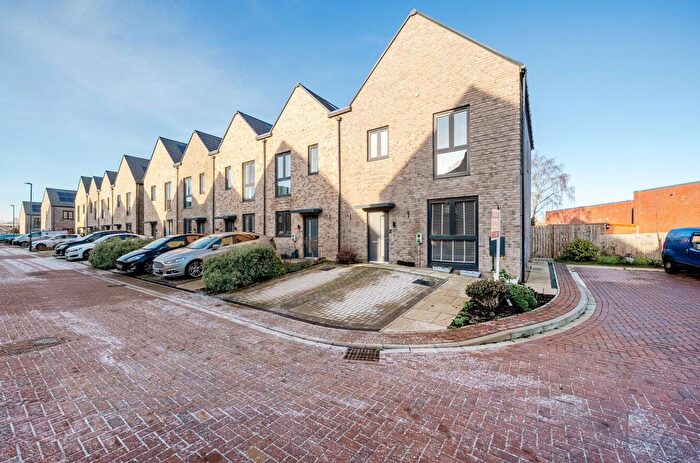
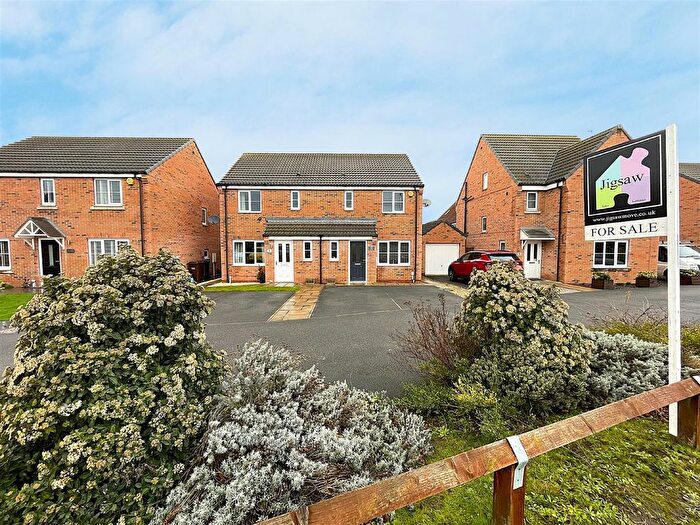
Properties in Selby East have an average house price of £192,404.00 and had 76 Property Transactions within the last 3 years¹.
Selby East is an area in Selby, North Yorkshire with 217 households², where the most expensive property was sold for £325,000.00.
Properties for sale in Selby East
Previously listed properties in Selby East
Roads and Postcodes in Selby East
Navigate through our locations to find the location of your next house in Selby East, Selby for sale or to rent.
| Streets | Postcodes |
|---|---|
| Abbey View | YO8 8BP |
| Abbey Walk | YO8 4DZ |
| Abbey Yard | YO8 4PS YO8 4PX |
| Abbots Road | YO8 8AT |
| Barlby Road | YO8 5AE YO8 5AF YO8 5AZ YO8 5BJ YO8 5BL YO8 5BQ YO8 5BY YO8 5DZ |
| Barlow Road | YO8 8FX |
| Barwic Close | YO8 8GH |
| Barwick Parade | YO8 8DL |
| Bawtry Road | YO8 8AA YO8 8LY YO8 8NA |
| Blackthorn Close | YO8 8FU YO8 8FW |
| Bracken Way | YO8 8GQ |
| Bridge Court | YO8 5BP |
| Bridge Wharf | YO8 4NR |
| Brook Street | YO8 4AT |
| Canal View | YO8 8AE |
| Cliffe Bank | YO8 6DY |
| Corunna Court | YO8 4PZ |
| Cowie Drive | YO8 8BG |
| D'arcy Court | YO8 8DY |
| D'arcy Road | YO8 8BU YO8 8BT |
| Douglas Street | YO8 4AF |
| East Common Lane | YO8 8FA YO8 8GA |
| Far Moss | YO8 8GG |
| Finkle Street | YO8 4DT |
| Gant Walk | YO8 4QR |
| Hemlock Drive | YO8 8FR |
| Hope Yard | YO8 4EE |
| James Street | YO8 4PY |
| Kitchen Gardens | YO8 8FZ |
| Laurence Grove | YO8 8DS |
| Laurie Backhouse Court | YO8 9AQ |
| Lock Hill | YO8 8BW |
| Market Cross | YO8 4JS YO8 4NU |
| Market Lane | YO8 4QA |
| Market Place | YO8 4NS YO8 4NT YO8 4NX YO8 4PA YO8 4PB |
| Micklegate | YO8 4ED YO8 4EH YO8 4EJ YO8 4EQ |
| New Church Terrace | YO8 4DX |
| New Lane | YO8 4QP |
| Ousegate | YO8 4NH YO8 4NN |
| Palm House Drive | YO8 8GJ |
| Parkin Avenue | YO8 8BY |
| Pond View | YO8 8GF |
| Preston Yard | YO8 4EF |
| Prospect Way | YO8 8BD |
| Rose Court | YO8 8FF |
| Shipyard Road | YO8 8BN |
| Shireburn Grove | YO8 8DT |
| Station Road | YO8 4AA |
| Staynor Avenue | YO8 8AX |
| Staynor Link | YO8 8GE |
| Swans Way | YO8 8FG |
| The Crescent | YO8 4PE |
| The Nook | YO8 4PJ |
| The Plantation | YO8 8FY |
| The Quay | YO8 4EG |
| The Stables | YO8 8GD |
| Thornden Buildings | YO8 4BF |
| Turners Square | YO8 4BE |
| Union Lane | YO8 4BA |
| Vivars Way | YO8 8BE |
| War Memorial Square | YO8 1SB YO8 1SD YO8 1SE YO8 1SF YO8 1SG YO8 1SH YO8 1SJ YO8 1SL YO8 1SN YO8 1SP YO8 1SQ YO8 1SR YO8 1SS YO8 1ST YO8 1SU YO8 1SW YO8 1SX YO8 1SY YO8 1SZ YO8 1TA YO8 1TB YO8 1TD YO8 1TE YO8 1TF YO8 1TG YO8 1TH YO8 1TJ YO8 1TL YO8 1TN YO8 1ZZ |
| Water Lane | YO8 4HQ |
| Waterfront Complex | YO8 8AP |
| Willow Gardens | YO8 8SL |
| Woodland Glade | YO8 8GP |
| YO8 1AE YO8 1BQ YO8 1DN YO8 1DP YO8 1DS YO8 1DU YO8 1EB YO8 1EW YO8 3YF YO8 4EY YO8 4GS YO8 6WY YO8 9ZS |
Transport near Selby East
-
Selby Station
-
Wressle Station
-
Hensall Station
-
Snaith Station
-
Whitley Bridge Station
-
Sherburn-In-Elmet Station
-
Church Fenton Station
-
Rawcliffe Station
-
South Milford Station
-
Ulleskelf Station
- FAQ
- Price Paid By Year
- Property Type Price
Frequently asked questions about Selby East
What is the average price for a property for sale in Selby East?
The average price for a property for sale in Selby East is £192,404. This amount is 21% lower than the average price in Selby. There are 964 property listings for sale in Selby East.
What streets have the most expensive properties for sale in Selby East?
The streets with the most expensive properties for sale in Selby East are Palm House Drive at an average of £241,000, Woodland Glade at an average of £206,928 and Blackthorn Close at an average of £201,400.
What streets have the most affordable properties for sale in Selby East?
The streets with the most affordable properties for sale in Selby East are Barlby Road at an average of £88,000, Corunna Court at an average of £96,000 and Rose Court at an average of £123,166.
Which train stations are available in or near Selby East?
Some of the train stations available in or near Selby East are Selby, Wressle and Hensall.
Property Price Paid in Selby East by Year
The average sold property price by year was:
| Year | Average Sold Price | Price Change |
Sold Properties
|
|---|---|---|---|
| 2025 | £193,166 | 12% |
9 Properties |
| 2024 | £169,231 | -34% |
40 Properties |
| 2023 | £226,481 | -1% |
27 Properties |
| 2022 | £228,650 | 21% |
17 Properties |
| 2021 | £181,574 | 4% |
34 Properties |
| 2020 | £174,364 | -11% |
35 Properties |
| 2019 | £193,970 | 21% |
51 Properties |
| 2018 | £153,404 | -9% |
56 Properties |
| 2017 | £167,594 | -15% |
64 Properties |
| 2016 | £192,328 | 11% |
58 Properties |
| 2015 | £170,407 | 7% |
62 Properties |
| 2014 | £158,712 | 18% |
23 Properties |
| 2011 | £130,000 | -40% |
1 Property |
| 2008 | £182,500 | 45% |
2 Properties |
| 2007 | £100,000 | -235% |
1 Property |
| 2006 | £335,000 | 13% |
1 Property |
| 2004 | £292,000 | 55% |
1 Property |
| 2002 | £130,000 | 57% |
1 Property |
| 2000 | £56,000 | -248% |
1 Property |
| 1998 | £195,000 | 6% |
1 Property |
| 1997 | £183,666 | - |
3 Properties |
Property Price per Property Type in Selby East
Here you can find historic sold price data in order to help with your property search.
The average Property Paid Price for specific property types in the last three years are:
| Property Type | Average Sold Price | Sold Properties |
|---|---|---|
| Semi Detached House | £196,619.00 | 15 Semi Detached Houses |
| Detached House | £275,636.00 | 18 Detached Houses |
| Terraced House | £160,210.00 | 37 Terraced Houses |
| Flat | £130,699.00 | 6 Flats |

