
Houses for sale & to rent in Barden Fell, Skipton
House Prices in Barden Fell
Properties in Barden Fell have an average house price of £633k and had 38 Property Transactions within the last 3 years¹.
Barden Fell is an area in Skipton, North Yorkshire with 639 households², where the most expensive property was sold for £1.25M.
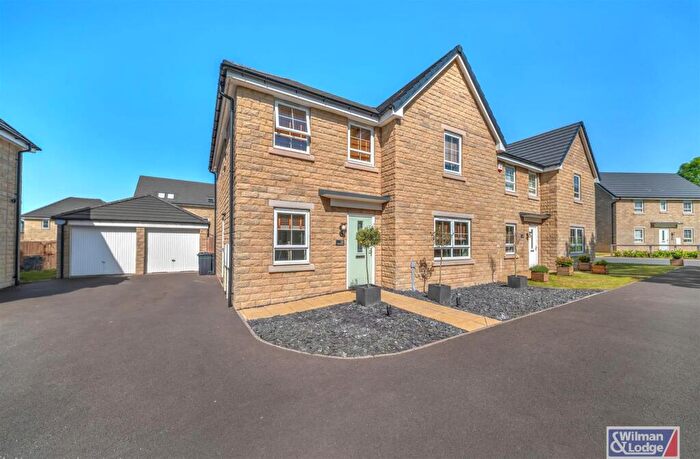
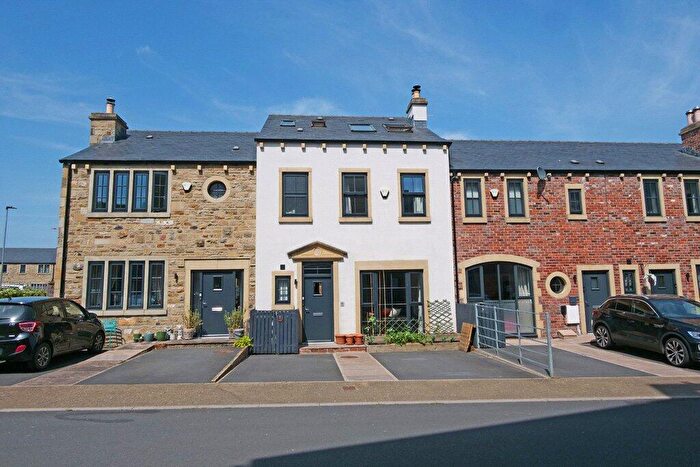
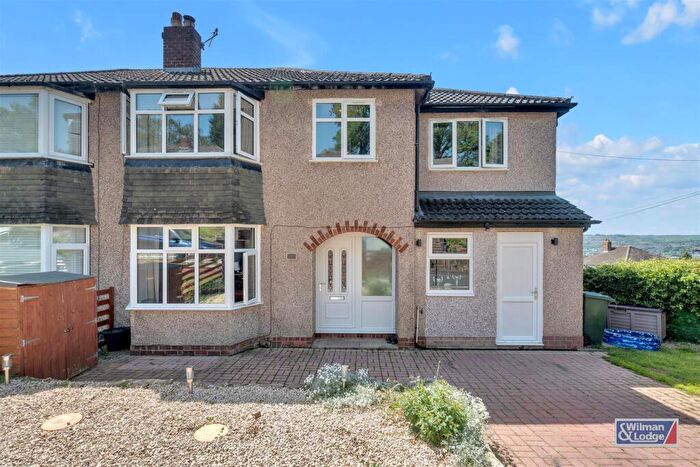
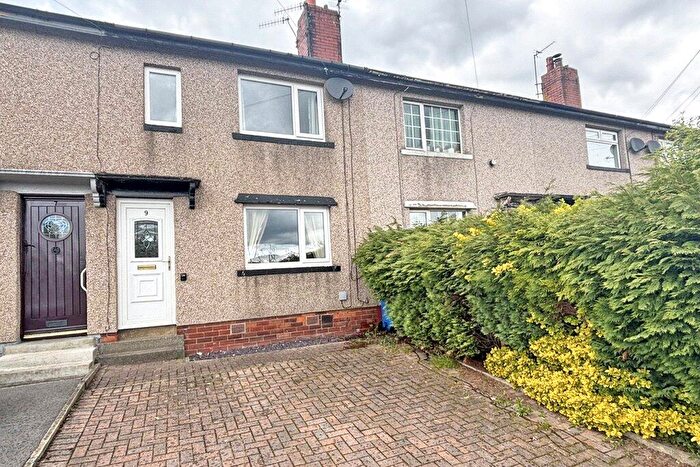
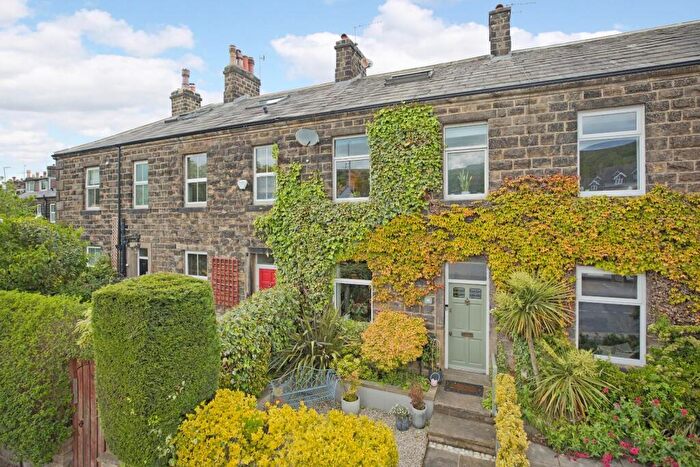
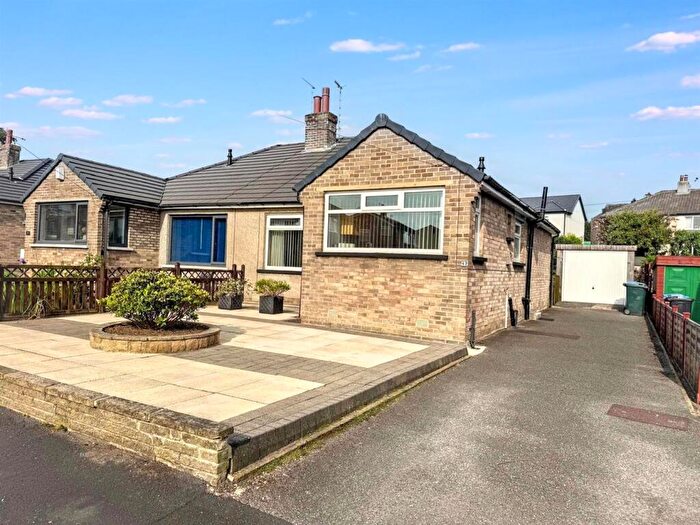
Properties for sale in Barden Fell
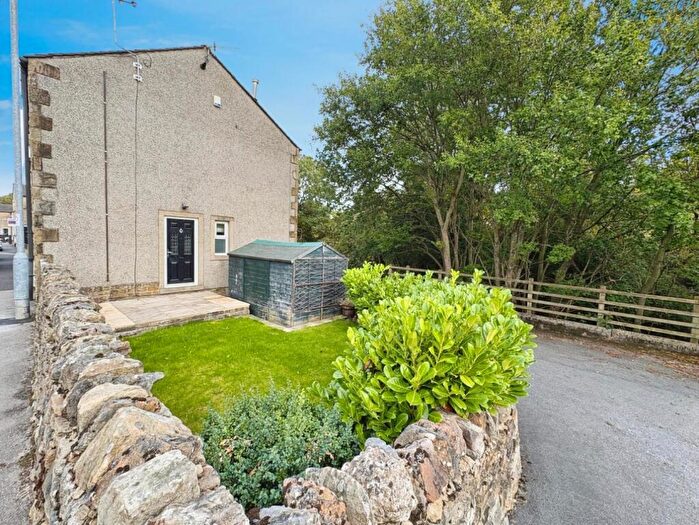
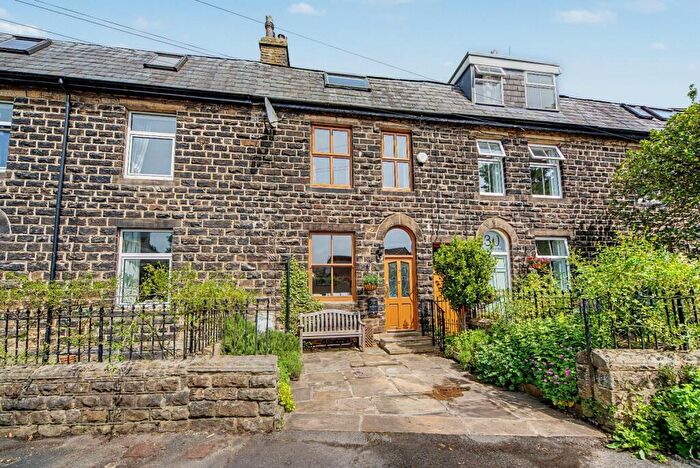
![]()
If you are looking to sell your house, let it out, or receive a property valuation, an expert can help you.
Click the button below to get started.
Roads and Postcodes in Barden Fell
Navigate through our locations to find the location of your next house in Barden Fell, Skipton for sale or to rent.
Transport near Barden Fell
-
 Skipton Station
 -
Cononley Station
-
Gargrave Station
-
Steeton and Silsden Station
-
Ilkley Station
-
Ben Rhydding Station
-
Keighley Station
- FAQ
- Price Paid By Year
- Property Type Price
Frequently asked questions about Barden Fell
What is the average price for a property for sale in Barden Fell?
The average price for a property for sale in Barden Fell is £633,049. This amount is 106% higher than the average price in Skipton. There are 4,324 property listings for sale in Barden Fell.
What streets have the most expensive properties for sale in Barden Fell?
The streets with the most expensive properties for sale in Barden Fell are The Green at an average of £1,017,500, Fell Lane at an average of £850,000 and Kail Lane at an average of £795,000.
What streets have the most affordable properties for sale in Barden Fell?
The streets with the most affordable properties for sale in Barden Fell are Fell View at an average of £370,000, Main Street at an average of £396,000 and Brockles Ghyll at an average of £400,000.
Which train stations are available in or near Barden Fell?
Some of the train stations available in or near Barden Fell are Skipton, Cononley and Gargrave.
Property Price Paid in Barden Fell by Year
The average sold property price by year was:
| Year | Average Sold Price | Price Change |
Sold Properties
|
|---|---|---|---|
| 2026 | £513,333 | -30% |
3 Properties |
| 2025 | £669,714 | 2% |
14 Properties |
| 2024 | £657,686 | 9% |
10 Properties |
| 2023 | £596,636 | -17% |
11 Properties |
| 2022 | £698,815 | 33% |
19 Properties |
| 2021 | £470,045 | -10% |
19 Properties |
| 2020 | £518,875 | -10% |
22 Properties |
| 2019 | £569,258 | 7% |
15 Properties |
| 2018 | £527,886 | 19% |
17 Properties |
| 2017 | £429,107 | 11% |
14 Properties |
| 2016 | £380,461 | 1% |
13 Properties |
| 2015 | £378,133 | -12% |
15 Properties |
| 2014 | £422,800 | 28% |
17 Properties |
| 2013 | £305,500 | -27% |
10 Properties |
| 2012 | £387,340 | -21% |
16 Properties |
| 2011 | £469,937 | 3% |
8 Properties |
| 2010 | £456,180 | 6% |
10 Properties |
| 2009 | £429,687 | 15% |
8 Properties |
| 2008 | £363,563 | 3% |
16 Properties |
| 2007 | £353,321 | -22% |
14 Properties |
| 2006 | £432,636 | 1% |
18 Properties |
| 2005 | £430,380 | 10% |
21 Properties |
| 2004 | £387,538 | 25% |
13 Properties |
| 2003 | £289,210 | 20% |
24 Properties |
| 2002 | £230,133 | 15% |
26 Properties |
| 2001 | £195,281 | -8% |
16 Properties |
| 2000 | £210,083 | 13% |
12 Properties |
| 1999 | £182,410 | 21% |
19 Properties |
| 1998 | £144,887 | 15% |
20 Properties |
| 1997 | £122,817 | 10% |
15 Properties |
| 1996 | £110,647 | 0,4% |
23 Properties |
| 1995 | £110,234 | - |
16 Properties |
Property Price per Property Type in Barden Fell
Here you can find historic sold price data in order to help with your property search.
The average Property Paid Price for specific property types in the last three years are:
| Property Type | Average Sold Price | Sold Properties |
|---|---|---|
| Semi Detached House | £532,857.00 | 7 Semi Detached Houses |
| Detached House | £729,537.00 | 23 Detached Houses |
| Terraced House | £488,785.00 | 7 Terraced Houses |
| Flat | £125,000.00 | 1 Flat |