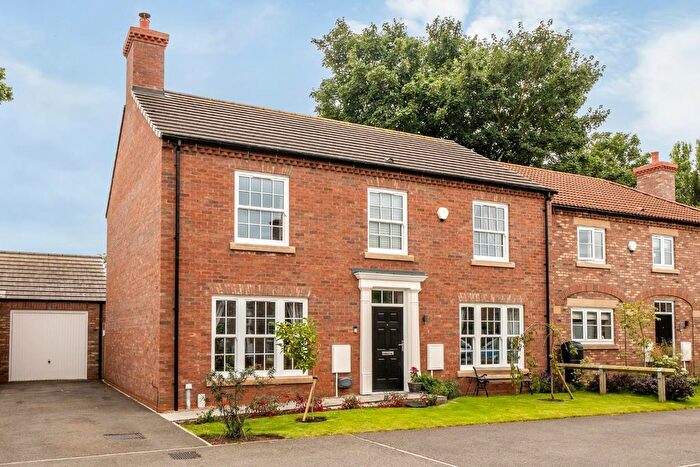
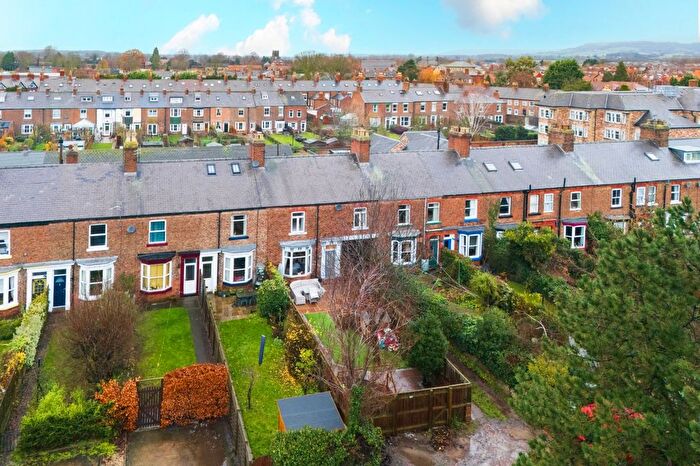
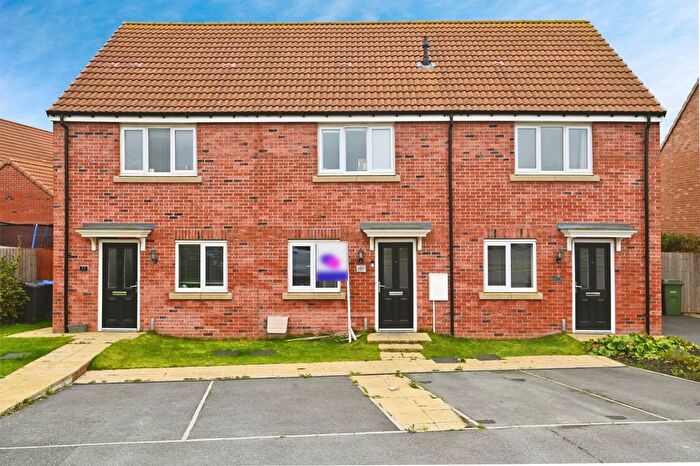
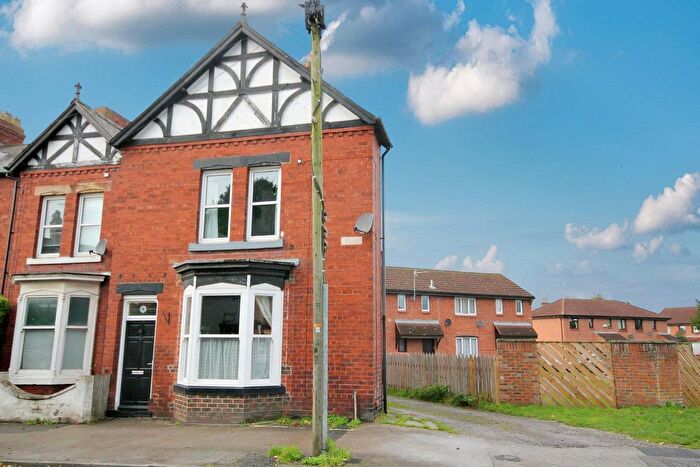
Houses for sale & to rent in Sowerby, Thirsk
House Prices in Sowerby
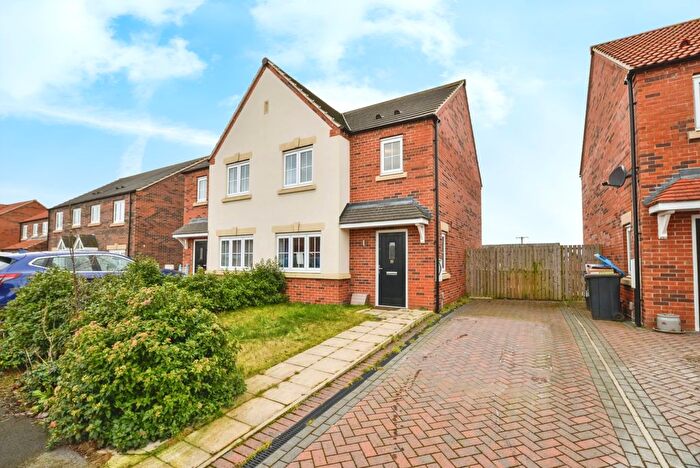
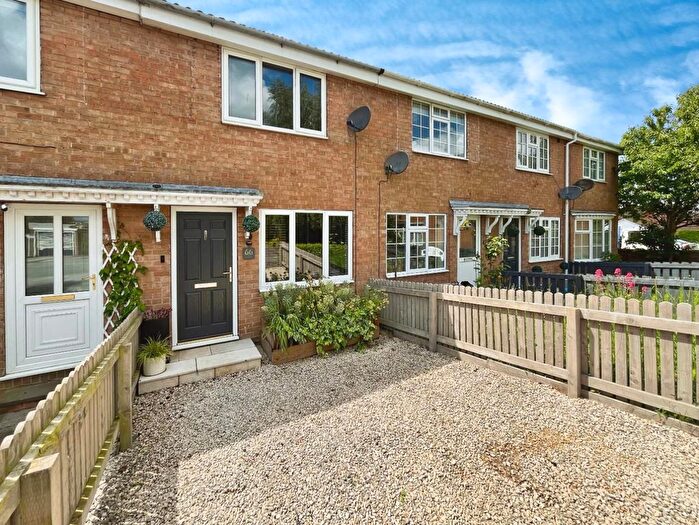
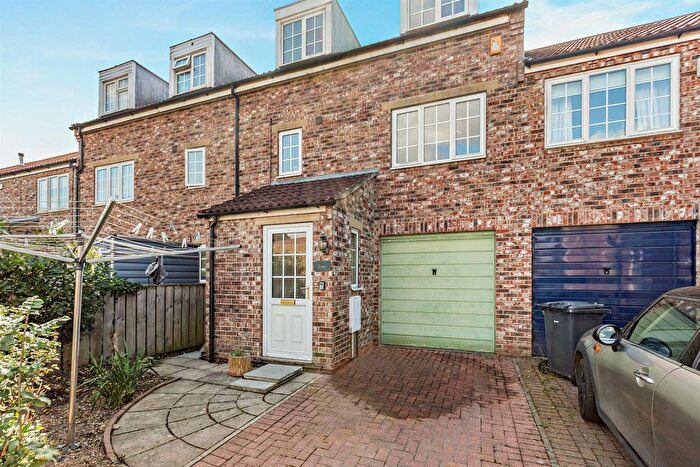
Properties in Sowerby have an average house price of £272,246.00 and had 253 Property Transactions within the last 3 years¹.
Sowerby is an area in Thirsk, North Yorkshire with 1,745 households², where the most expensive property was sold for £950,000.00.
Properties for sale in Sowerby
Previously listed properties in Sowerby
Roads and Postcodes in Sowerby
Navigate through our locations to find the location of your next house in Sowerby, Thirsk for sale or to rent.
| Streets | Postcodes |
|---|---|
| Admirals Court | YO7 1RP YO7 1RR YO7 1RS |
| Back Lane | YO7 1JD YO7 1JT YO7 1NJ YO7 1NQ YO7 1ST |
| Beech Grove | YO7 1JW |
| Belgrave Terrace | YO7 1RE |
| Bellcroft Close | YO7 1QW |
| Blakey Close | YO7 1JL |
| Blakey Lane | YO7 1JY YO7 3AB |
| Carlton Avenue | YO7 1RJ |
| Cocked Hat Park | YO7 3HB |
| Croft Gardens | YO7 1NF |
| Croft Heads | YO7 1ND YO7 1NG YO7 1NY |
| Danum Avenue | YO7 1RU |
| Dondeen Avenue | YO7 1GE |
| Freemans Way | YO7 1GF |
| Front Street | YO7 1JB YO7 1JE YO7 1JF YO7 1JG YO7 1JJ YO7 1JN YO7 1JP YO7 1JQ |
| George Court | YO7 1HW |
| Gravel Hole Lane | YO7 1NN YO7 1NS |
| Green Lane East | YO7 1NA YO7 1NB |
| Green Lane West | YO7 1RN YO7 1RW |
| Holly Close | YO7 1SH |
| Islebeck Road | YO7 3AG YO7 3AL |
| Kings Gardens | YO7 1NP YO7 1NR YO7 1NT YO7 1NU YO7 1NX |
| Kings Meadows | YO7 1PA YO7 1PB |
| Lochranza Road | YO7 1GB |
| Mac Arthur Close | YO7 1SQ |
| Meadow Garth | YO7 1HY |
| Melbourne Place | YO7 1QY |
| Melrose Gardens | YO7 1QA |
| Mowbray Place | YO7 1RF |
| Mowbray Terrace | YO7 1RG |
| Nursery Mews | YO7 1GJ |
| Orchard Lane | YO7 1NE |
| Queens Gardens | YO7 1NH YO7 1NL YO7 1NW |
| Racecourse Mews | YO7 1QG |
| Railway Terrace | YO7 1QT |
| Robb Close | YO7 1GG |
| Sandholme Court | YO7 1SU |
| Saxty Way | YO7 1SA YO7 1SB YO7 1SD YO7 1SE YO7 1SF YO7 1SG |
| School Garth | YO7 1PD |
| South Crescent | YO7 1QZ |
| South Terrace | YO7 1RH |
| Southlands Court | YO7 1LA |
| Sowerby Parks | YO7 3AH YO7 3BR |
| Sowerby Road | YO7 1HR YO7 1HU YO7 1HX YO7 1HZ YO7 1LZ |
| Sowerby Terrace | YO7 1HT |
| St Oswalds Close | YO7 1JX |
| Station Road | YO7 1PZ YO7 1QE YO7 1QF |
| The Close | YO7 1JA |
| The Croft | YO7 1NZ |
| The Dialstone | YO7 1GH |
| The Grove | YO7 1JH |
| The Maltings | YO7 1QJ |
| The Pines | YO7 1GN |
| Topcliffe Road | YO7 1QU YO7 1RB YO7 1RD YO7 1RL YO7 1RQ YO7 1RT YO7 1RX YO7 1RY YO7 3HF YO7 3HQ |
| Turkhan Close | YO7 1GA |
| Victoria Avenue | YO7 1QX |
| Villa Place | YO7 1LT |
| Westbourne Terrace | YO7 1QD |
| Westgate | YO7 1QS |
| Worlds End | YO7 1JS |
| York Road | YO7 3AA YO7 3AD |
Transport near Sowerby
-
Thirsk Station
-
Northallerton Station
-
Cattal Station
-
Knaresborough Station
-
Hammerton Station
-
Starbeck Station
-
Harrogate Station
-
Hornbeam Park Station
-
Yarm Station
-
Poppleton Station
- FAQ
- Price Paid By Year
- Property Type Price
Frequently asked questions about Sowerby
What is the average price for a property for sale in Sowerby?
The average price for a property for sale in Sowerby is £272,246. This amount is 13% lower than the average price in Thirsk. There are 400 property listings for sale in Sowerby.
What streets have the most expensive properties for sale in Sowerby?
The streets with the most expensive properties for sale in Sowerby are Turkhan Close at an average of £465,000, Croft Heads at an average of £451,162 and Croft Gardens at an average of £400,666.
What streets have the most affordable properties for sale in Sowerby?
The streets with the most affordable properties for sale in Sowerby are The Maltings at an average of £129,321, The Dialstone at an average of £132,083 and George Court at an average of £162,500.
Which train stations are available in or near Sowerby?
Some of the train stations available in or near Sowerby are Thirsk, Northallerton and Cattal.
Property Price Paid in Sowerby by Year
The average sold property price by year was:
| Year | Average Sold Price | Price Change |
Sold Properties
|
|---|---|---|---|
| 2025 | £292,386 | 10% |
44 Properties |
| 2024 | £263,229 | -6% |
80 Properties |
| 2023 | £279,054 | 5% |
53 Properties |
| 2022 | £265,330 | 7% |
76 Properties |
| 2021 | £245,661 | 6% |
87 Properties |
| 2020 | £229,801 | 4% |
74 Properties |
| 2019 | £220,022 | 3% |
71 Properties |
| 2018 | £213,961 | 2% |
73 Properties |
| 2017 | £210,344 | -12% |
80 Properties |
| 2016 | £235,793 | 23% |
61 Properties |
| 2015 | £181,185 | -7% |
85 Properties |
| 2014 | £193,989 | -5% |
89 Properties |
| 2013 | £204,318 | 4% |
66 Properties |
| 2012 | £196,990 | -0,3% |
66 Properties |
| 2011 | £197,512 | -0,5% |
46 Properties |
| 2010 | £198,408 | 5% |
53 Properties |
| 2009 | £188,190 | -14% |
65 Properties |
| 2008 | £215,357 | 0,2% |
80 Properties |
| 2007 | £214,952 | 4% |
149 Properties |
| 2006 | £206,388 | 1% |
125 Properties |
| 2005 | £204,341 | 5% |
60 Properties |
| 2004 | £193,368 | 30% |
99 Properties |
| 2003 | £136,204 | 17% |
58 Properties |
| 2002 | £113,112 | 18% |
83 Properties |
| 2001 | £92,281 | 9% |
78 Properties |
| 2000 | £83,806 | 8% |
104 Properties |
| 1999 | £77,182 | 0,1% |
83 Properties |
| 1998 | £77,123 | 12% |
69 Properties |
| 1997 | £67,795 | 9% |
91 Properties |
| 1996 | £61,781 | -8% |
80 Properties |
| 1995 | £66,796 | - |
92 Properties |
Property Price per Property Type in Sowerby
Here you can find historic sold price data in order to help with your property search.
The average Property Paid Price for specific property types in the last three years are:
| Property Type | Average Sold Price | Sold Properties |
|---|---|---|
| Semi Detached House | £248,332.00 | 73 Semi Detached Houses |
| Detached House | £370,711.00 | 67 Detached Houses |
| Terraced House | £257,024.00 | 88 Terraced Houses |
| Flat | £131,770.00 | 25 Flats |

