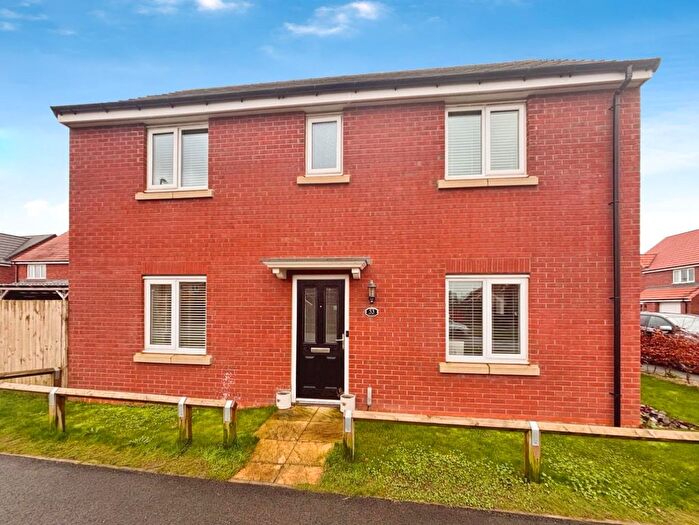
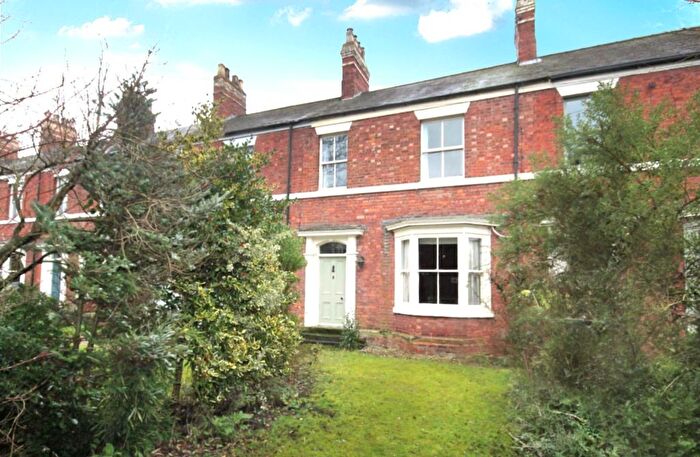
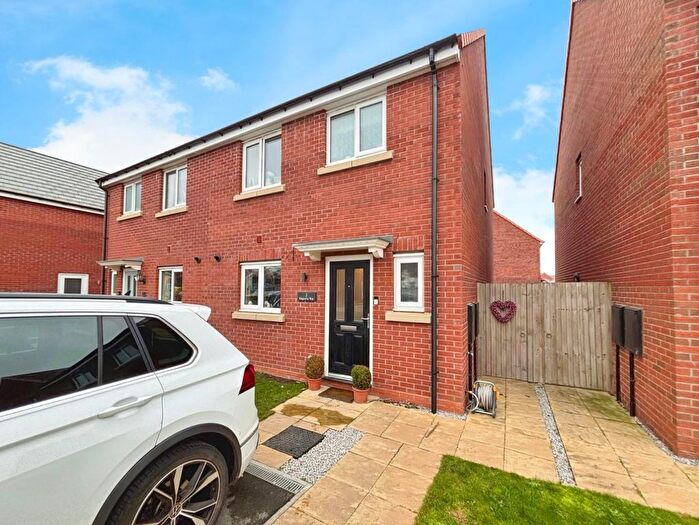
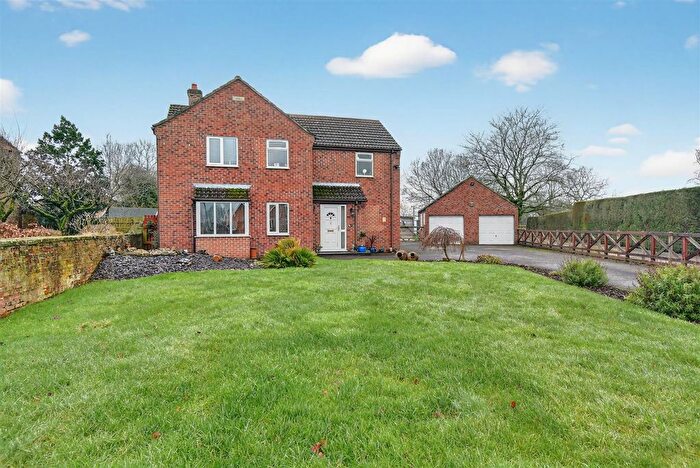
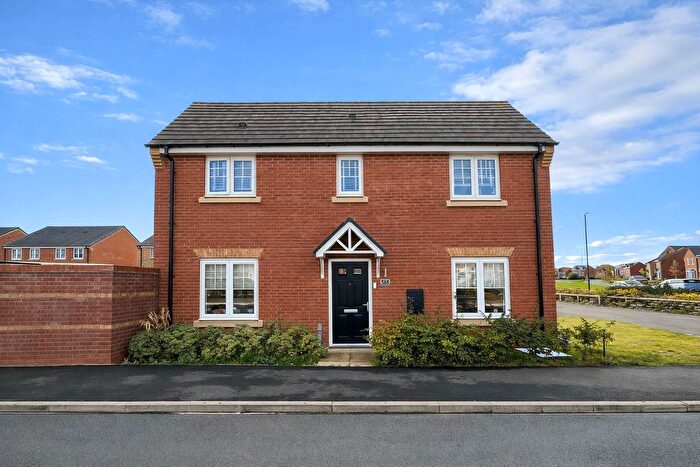
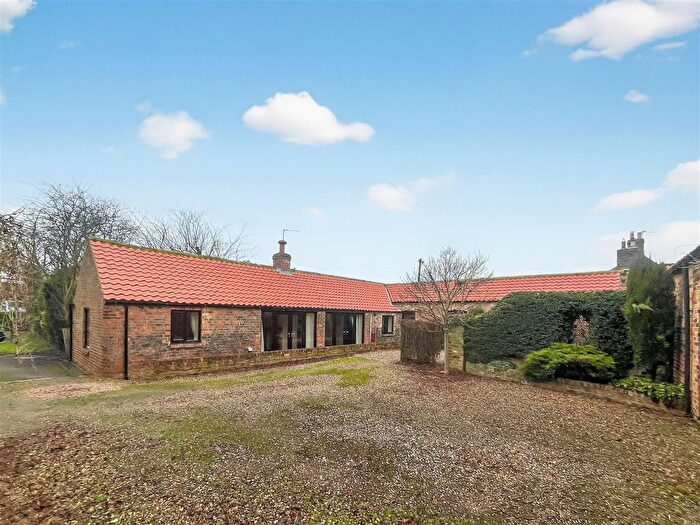
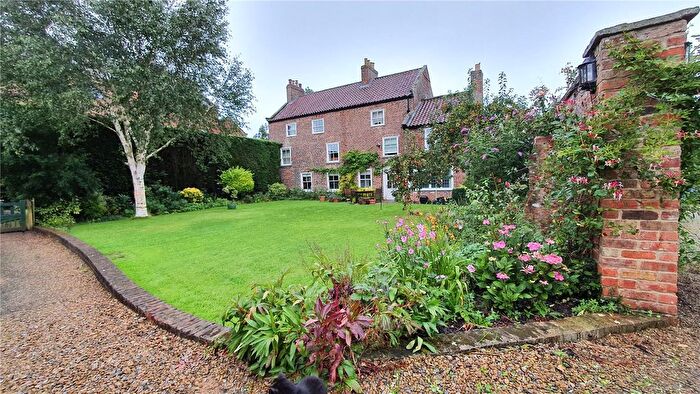
Houses for sale & to rent in Topcliffe, Thirsk
House Prices in Topcliffe
Properties in Topcliffe have an average house price of £359,282.00 and had 74 Property Transactions within the last 3 years¹.
Topcliffe is an area in Thirsk, North Yorkshire with 680 households², where the most expensive property was sold for £885,000.00.
Properties for sale in Topcliffe
Previously listed properties in Topcliffe
Roads and Postcodes in Topcliffe
Navigate through our locations to find the location of your next house in Topcliffe, Thirsk for sale or to rent.
| Streets | Postcodes |
|---|---|
| Back Lane | YO7 3RY |
| Beck Cottage | YO7 3HZ |
| Bridge Cottages | YO7 4SE |
| Catton Road | YO7 4SF |
| Chapel Garth | YO7 3HU |
| Chestnut Avenue | YO7 3EL YO7 3EW |
| Church Street | YO7 3PA |
| Dalton Bridge | YO7 3HP |
| Dalton Moor | YO7 3JD |
| Deans Square | YO7 3RT |
| Dovecote Mews | YO7 3RQ |
| East Lea | YO7 3RR YO7 3RS |
| Front Street | YO7 3NZ YO7 3RJ YO7 3RU YO7 3RX |
| Harriers Croft | YO7 3HA |
| Little Hutton | YO7 3BQ |
| Long Street | YO7 3RL YO7 3RW |
| Manor Close | YO7 3RH |
| Mill Lane | YO7 3RZ |
| Oak Drive | YO7 3RF |
| Oak View | YO7 3JR |
| Old Cricket Field Lane | YO7 3NU |
| Oval View | YO7 3NQ |
| Ox Close Lane | YO7 3JH |
| Park View | YO7 3NN |
| Pit Ings Lane | YO7 3HD |
| School Lane | YO7 3RG |
| Sessay Garth | YO7 3BS |
| Skipton Bridge | YO7 4SB |
| Station Road | YO7 3BJ YO7 3SQ |
| Sycamore Drive | YO7 3NW |
| The Oaks | YO7 3JP |
| The Rowans | YO7 3JW |
| The Willows | YO7 3NJ |
| Topcliffe Road | YO7 3HN |
| Willow Bridge Lane | YO7 3QQ |
| Willow Grove | YO7 3QH |
| Winn Lane | YO7 3RP |
| YO7 3BA YO7 3BB YO7 3BD YO7 3BE YO7 3BG YO7 3HJ YO7 3HS YO7 3HY YO7 3JA YO7 3NL YO7 4SG YO7 4SH YO7 4SQ |
Transport near Topcliffe
-
Thirsk Station
-
Northallerton Station
-
Knaresborough Station
-
Cattal Station
-
Hammerton Station
-
Starbeck Station
-
Harrogate Station
- FAQ
- Price Paid By Year
- Property Type Price
Frequently asked questions about Topcliffe
What is the average price for a property for sale in Topcliffe?
The average price for a property for sale in Topcliffe is £359,282. This amount is 18% higher than the average price in Thirsk. There are 658 property listings for sale in Topcliffe.
What streets have the most expensive properties for sale in Topcliffe?
The streets with the most expensive properties for sale in Topcliffe are Willow Grove at an average of £524,666, Long Street at an average of £495,100 and Church Street at an average of £424,166.
What streets have the most affordable properties for sale in Topcliffe?
The streets with the most affordable properties for sale in Topcliffe are Beck Cottage at an average of £147,166, Chestnut Avenue at an average of £147,750 and Winn Lane at an average of £175,000.
Which train stations are available in or near Topcliffe?
Some of the train stations available in or near Topcliffe are Thirsk, Northallerton and Knaresborough.
Property Price Paid in Topcliffe by Year
The average sold property price by year was:
| Year | Average Sold Price | Price Change |
Sold Properties
|
|---|---|---|---|
| 2025 | £387,320 | 11% |
25 Properties |
| 2024 | £344,427 | -0,4% |
27 Properties |
| 2023 | £345,654 | -10% |
22 Properties |
| 2022 | £380,315 | 13% |
36 Properties |
| 2021 | £332,308 | 16% |
49 Properties |
| 2020 | £278,141 | -8% |
36 Properties |
| 2019 | £301,465 | -1% |
33 Properties |
| 2018 | £304,286 | 8% |
26 Properties |
| 2017 | £280,815 | -1% |
40 Properties |
| 2016 | £284,695 | 14% |
37 Properties |
| 2015 | £244,698 | 1% |
41 Properties |
| 2014 | £242,548 | -17% |
44 Properties |
| 2013 | £283,651 | 10% |
23 Properties |
| 2012 | £255,780 | -5% |
30 Properties |
| 2011 | £269,137 | 22% |
29 Properties |
| 2010 | £208,827 | -24% |
9 Properties |
| 2009 | £258,760 | 9% |
23 Properties |
| 2008 | £235,353 | -3% |
14 Properties |
| 2007 | £242,855 | 21% |
29 Properties |
| 2006 | £192,127 | -5% |
45 Properties |
| 2005 | £202,323 | -10% |
53 Properties |
| 2004 | £222,370 | 15% |
37 Properties |
| 2003 | £188,305 | 7% |
36 Properties |
| 2002 | £174,735 | 42% |
37 Properties |
| 2001 | £100,580 | -6% |
32 Properties |
| 2000 | £107,070 | -1% |
35 Properties |
| 1999 | £107,668 | 19% |
36 Properties |
| 1998 | £87,612 | -10% |
24 Properties |
| 1997 | £96,037 | 28% |
36 Properties |
| 1996 | £69,538 | -18% |
44 Properties |
| 1995 | £81,966 | - |
22 Properties |
Property Price per Property Type in Topcliffe
Here you can find historic sold price data in order to help with your property search.
The average Property Paid Price for specific property types in the last three years are:
| Property Type | Average Sold Price | Sold Properties |
|---|---|---|
| Semi Detached House | £286,751.00 | 19 Semi Detached Houses |
| Detached House | £435,928.00 | 40 Detached Houses |
| Terraced House | £251,269.00 | 13 Terraced Houses |
| Flat | £217,500.00 | 2 Flats |

