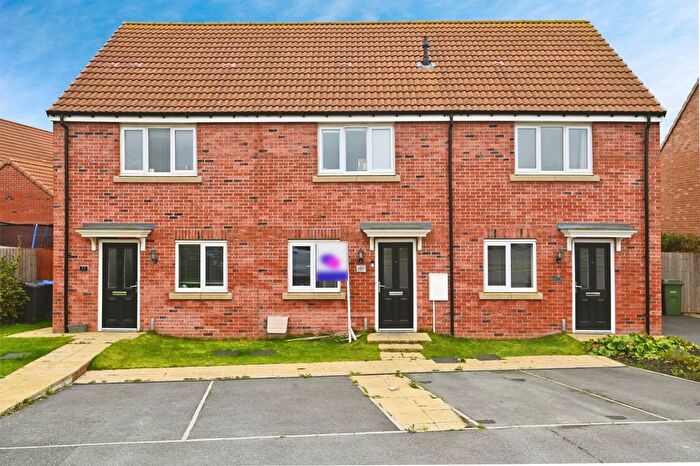
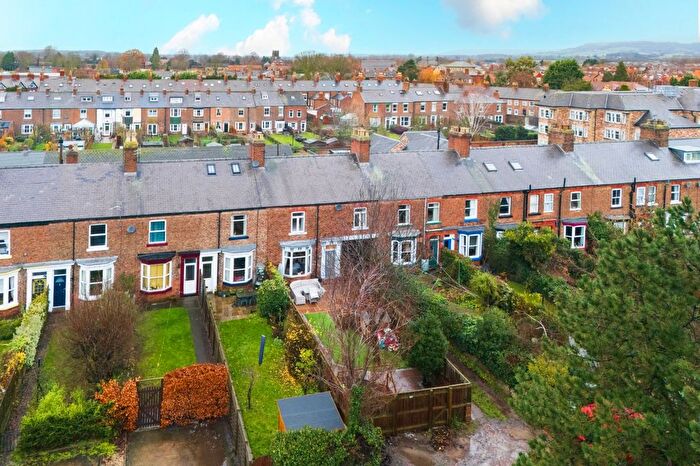
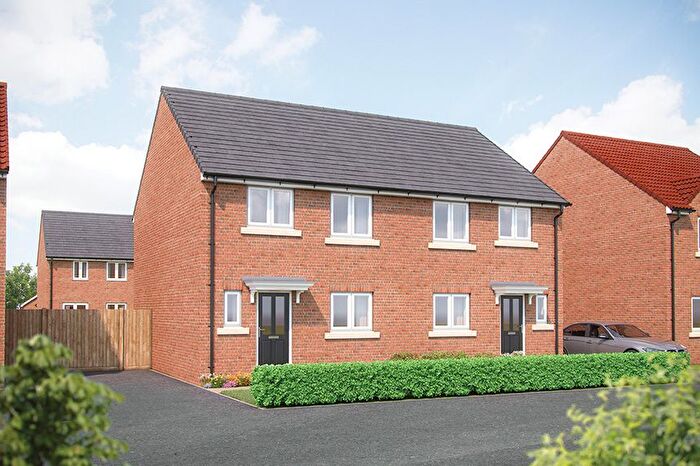
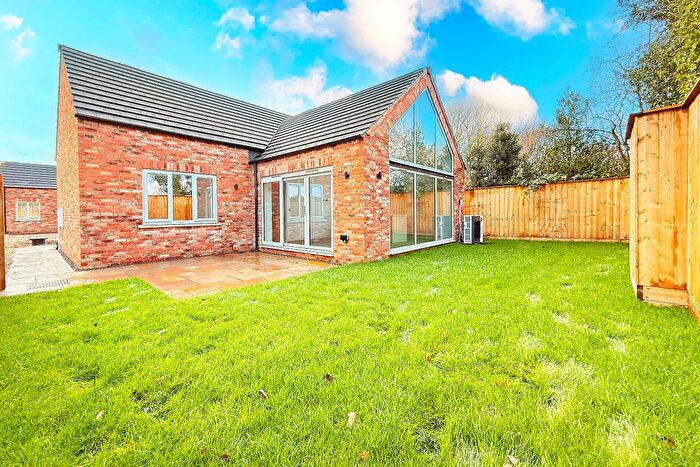
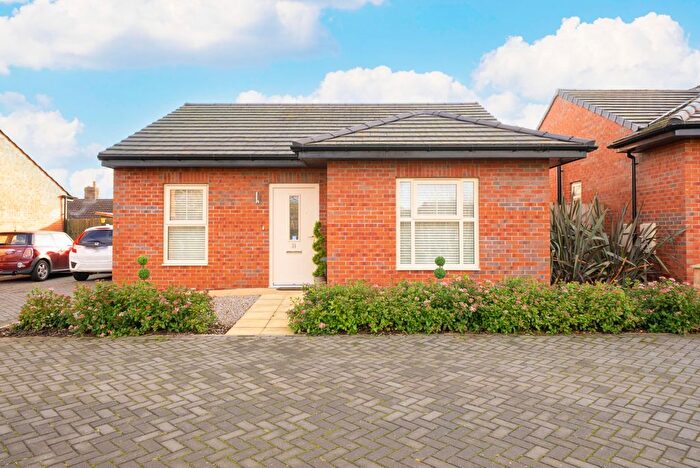
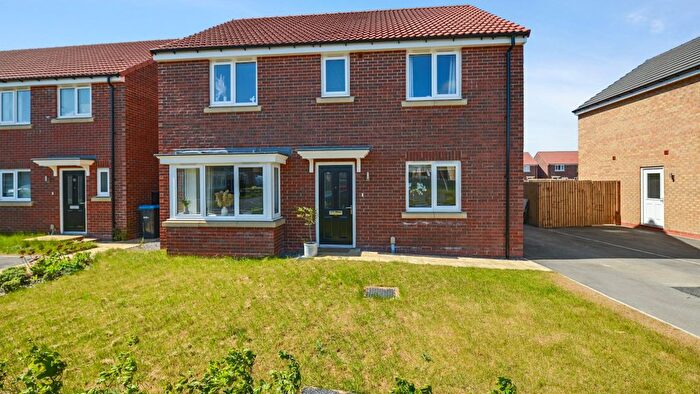
Houses for sale & to rent in Sowerby & Topcliffe, Thirsk
House Prices in Sowerby & Topcliffe
Properties in Sowerby & Topcliffe have an average house price of £248,305.00 and had 90 Property Transactions within the last 3 years¹.
Sowerby & Topcliffe is an area in Thirsk, North Yorkshire with 264 households², where the most expensive property was sold for £960,000.00.
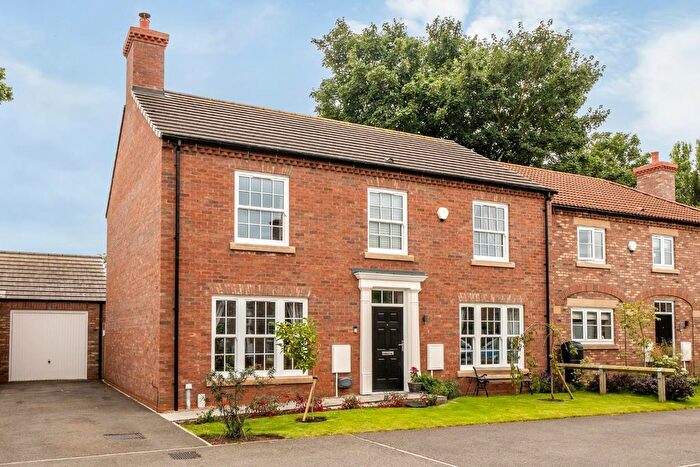
Properties for sale in Sowerby & Topcliffe
Previously listed properties in Sowerby & Topcliffe
Roads and Postcodes in Sowerby & Topcliffe
Navigate through our locations to find the location of your next house in Sowerby & Topcliffe, Thirsk for sale or to rent.
| Streets | Postcodes |
|---|---|
| Acacia Drive | YO7 1GT YO7 1GU |
| Apple Tree Road | YO7 3SW |
| Ash Court | YO7 3JE |
| Bankside Close | YO7 3TY |
| Beech Avenue | YO7 3EJ |
| Bribery Terrace | YO7 1HS |
| Butter Hill View | YO7 3FE |
| Butterfly Close | YO7 3SP |
| Campion Square | YO7 1GW |
| Catton Road | YO7 3SA |
| Cedar Road | YO7 3ST |
| Chapel Row | YO7 3HT |
| Chapel Street | YO7 1GP YO7 1GZ YO7 1LG YO7 1LX YO7 1TH |
| Cherryoak Street | YO7 3SU |
| Cheshire Square | YO7 3EH |
| Chestnut Crescent | YO7 3EN |
| Churchill Mews | YO7 3SY |
| Crakehill | YO7 3NS |
| Dalton Airfield | YO7 3HE YO7 3JN |
| Dalton Lane | YO7 3HR |
| Eldmire | YO7 3JJ YO7 3JQ |
| Elm Road | YO7 3ER |
| Farefield Close | YO7 3FD |
| Greenfield Close | YO7 3FS |
| Hawthorne Drive | YO7 3EP |
| Hedgehog Close | YO7 3SR |
| Honeysuckle Way | YO7 3SH |
| Inspiration Way | YO7 1TS |
| Islebeck Road | YO7 3AQ |
| Larch Road | YO7 3EX |
| Long Street | YO7 3PB |
| Lumb Lane | YO7 3DY |
| Maple Gardens | YO7 3PY |
| Oak Drive | YO7 3ES |
| Orr Crescent | YO7 3EA |
| Ox Moor Plantation Lane | YO7 1FA |
| Poplar Crescent | YO7 3QA |
| Poppy Drive | YO7 3SJ |
| Primrose Drive | YO7 3FG |
| Rose Lea | YO7 3JB |
| Rosemary Close | YO7 3SL |
| Silver Street | YO7 1JU |
| South Crescent | YO7 1RA |
| Sowerby Parks | YO7 3AJ |
| Station Road | YO7 1TR YO7 3SB YO7 3SD YO7 3SE YO7 3SF |
| Swale View | YO7 3RN |
| Swan Way | YO7 3SN |
| Sycamore Avenue | YO7 3ET |
| The Covert | YO7 3EF |
| The Flatts | YO7 1LY |
| The Green | YO7 3EG |
| The Sidings | YO7 1FU |
| Topcliffe Common | YO7 3HW |
| Topcliffe Road | YO7 1RZ YO7 3HG |
| Town End | YO7 1PY |
| Trenchard Street | YO7 3EQ |
| Whittle Street | YO7 3EE |
| Woodland View | YO7 3EU |
| Woodland Way | YO7 3SX |
| York Road | YO7 3TW |
| YO7 3AW YO7 3BH YO7 3BL YO7 3BN YO7 3BP YO7 3BW YO7 3DZ YO7 3ED YO7 3EY YO7 3HH YO7 3HL YO7 3HX YO7 3JF YO7 3JG YO7 3JL YO7 3LZ YO7 3NA YO7 3NB YO7 3ND YO7 3NE YO7 3NF YO7 3NG YO7 3NP YO7 3NR YO7 3NT YO7 4NX |
Transport near Sowerby & Topcliffe
- FAQ
- Price Paid By Year
- Property Type Price
Frequently asked questions about Sowerby & Topcliffe
What is the average price for a property for sale in Sowerby & Topcliffe?
The average price for a property for sale in Sowerby & Topcliffe is £248,305. This amount is 20% lower than the average price in Thirsk. There are 800 property listings for sale in Sowerby & Topcliffe.
What streets have the most expensive properties for sale in Sowerby & Topcliffe?
The streets with the most expensive properties for sale in Sowerby & Topcliffe are Churchill Mews at an average of £640,000, Poplar Crescent at an average of £420,833 and Butter Hill View at an average of £389,000.
What streets have the most affordable properties for sale in Sowerby & Topcliffe?
The streets with the most affordable properties for sale in Sowerby & Topcliffe are Station Road at an average of £82,695, Chapel Street at an average of £199,781 and Acacia Drive at an average of £208,993.
Which train stations are available in or near Sowerby & Topcliffe?
Some of the train stations available in or near Sowerby & Topcliffe are Thirsk, Northallerton and Knaresborough.
Property Price Paid in Sowerby & Topcliffe by Year
The average sold property price by year was:
| Year | Average Sold Price | Price Change |
Sold Properties
|
|---|---|---|---|
| 2025 | £222,531 | -10% |
18 Properties |
| 2024 | £243,834 | 2% |
26 Properties |
| 2023 | £238,447 | -20% |
24 Properties |
| 2022 | £285,429 | -6% |
22 Properties |
| 2021 | £301,849 | 13% |
38 Properties |
| 2020 | £261,753 | 1% |
40 Properties |
| 2019 | £259,824 | 1% |
115 Properties |
| 2018 | £256,626 | 32% |
87 Properties |
| 2017 | £174,165 | -10% |
131 Properties |
| 2016 | £190,871 | -10% |
64 Properties |
| 2015 | £209,667 | -79% |
25 Properties |
| 2007 | £375,000 | 36% |
1 Property |
| 2004 | £241,480 | 65% |
1 Property |
| 2003 | £85,000 | - |
1 Property |
Property Price per Property Type in Sowerby & Topcliffe
Here you can find historic sold price data in order to help with your property search.
The average Property Paid Price for specific property types in the last three years are:
| Property Type | Average Sold Price | Sold Properties |
|---|---|---|
| Semi Detached House | £209,404.00 | 32 Semi Detached Houses |
| Detached House | £382,163.00 | 29 Detached Houses |
| Flat | £155,920.00 | 28 Flats |
| Terraced House | £198,000.00 | 1 Terraced House |

