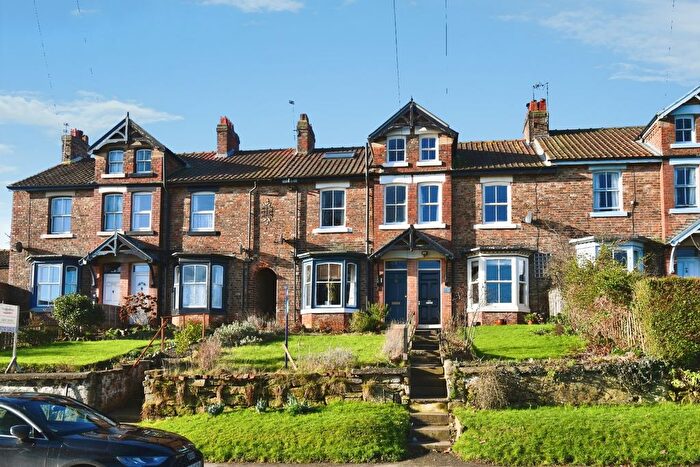
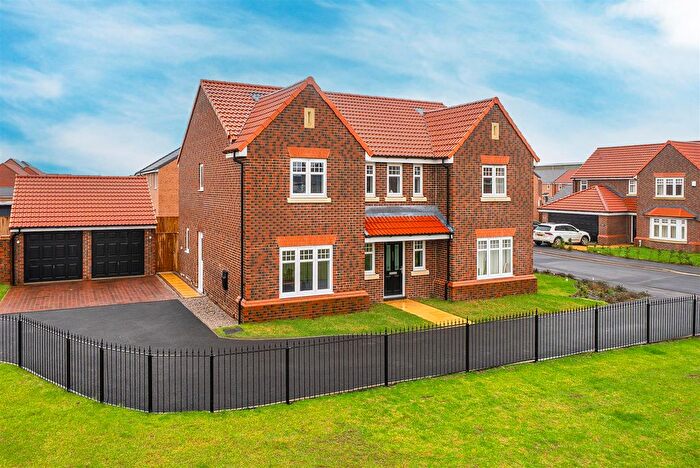
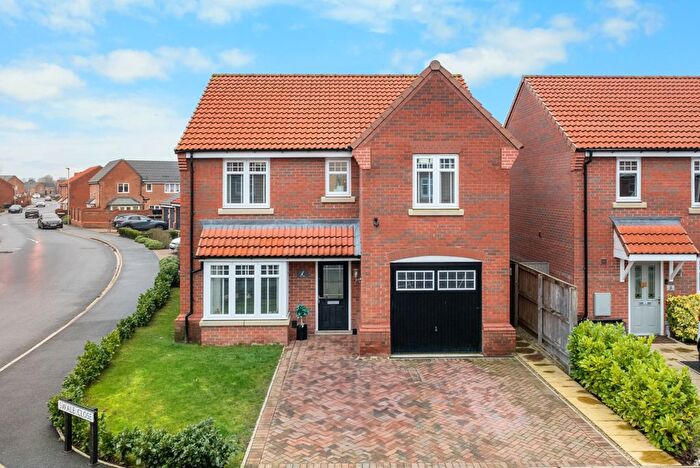
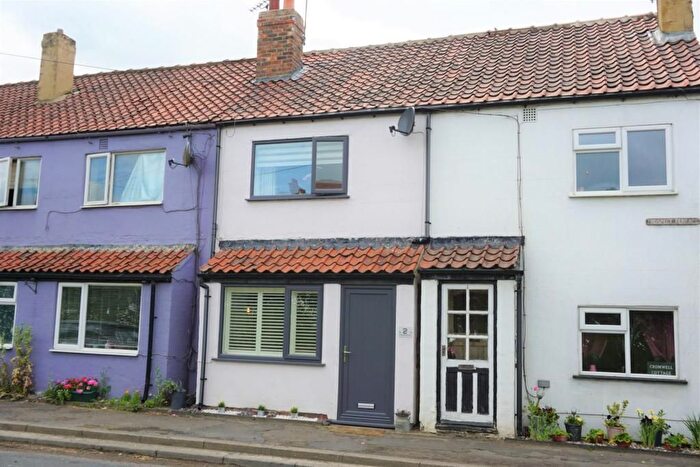
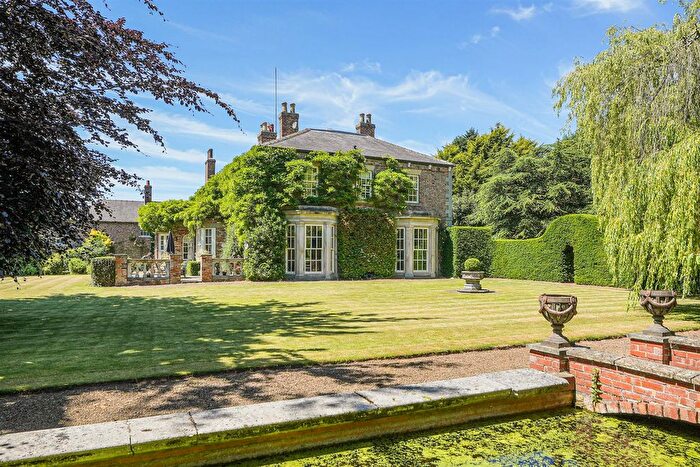
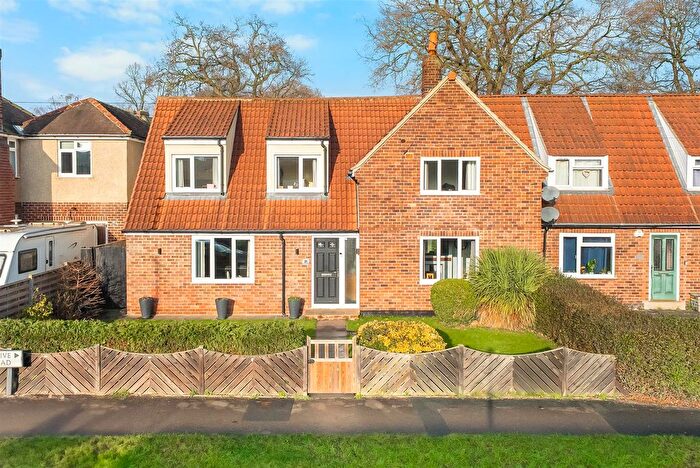
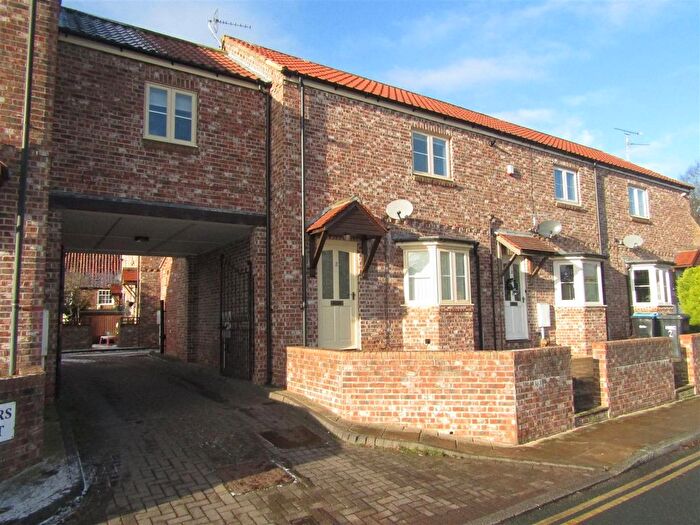
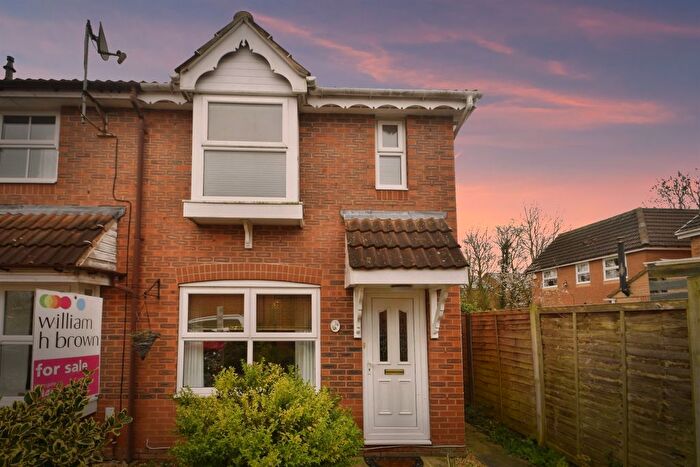
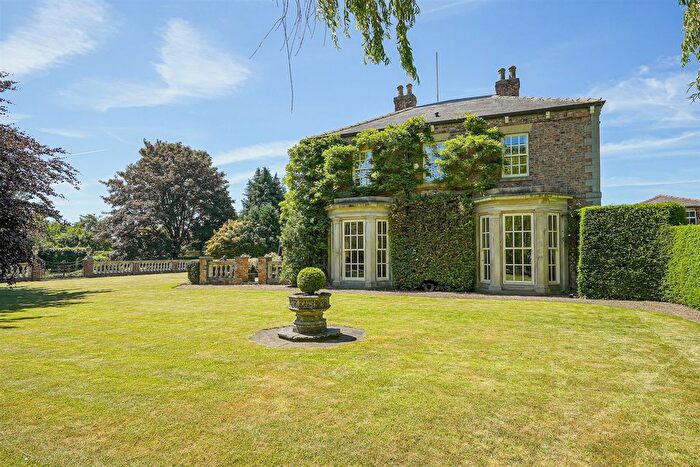
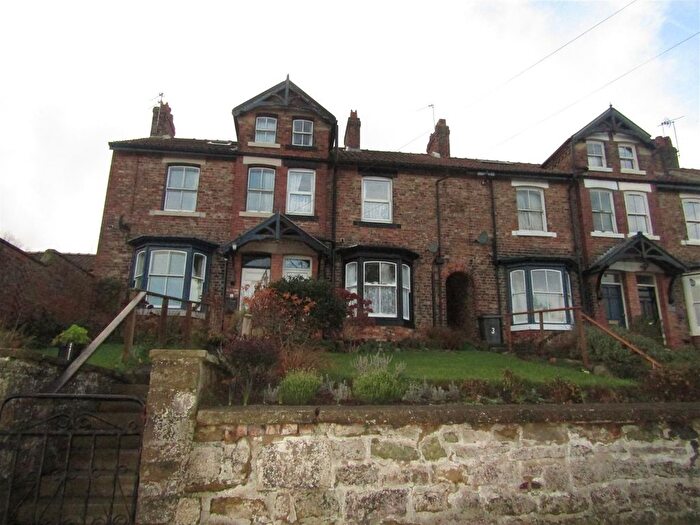
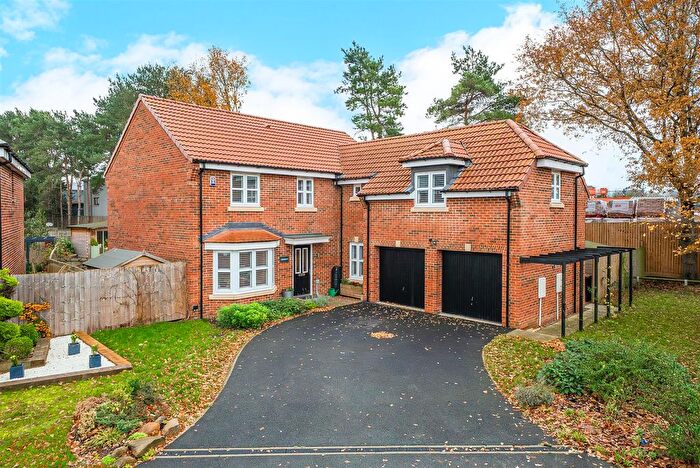
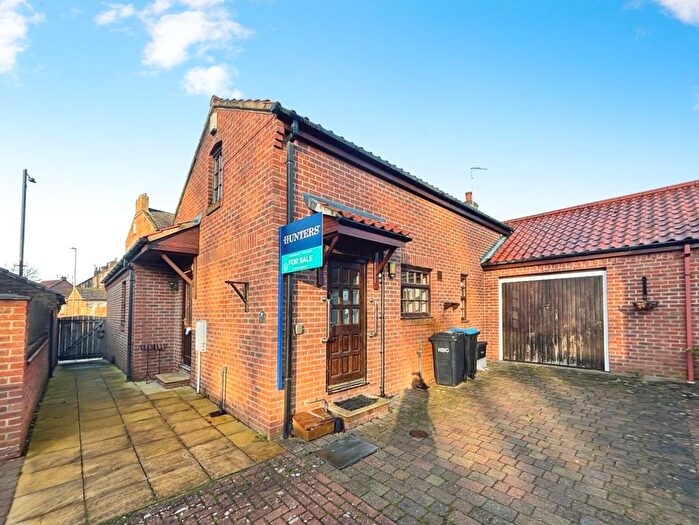
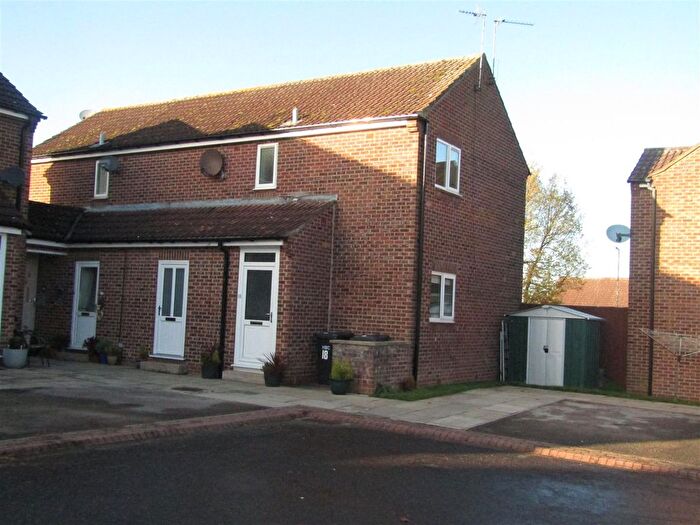
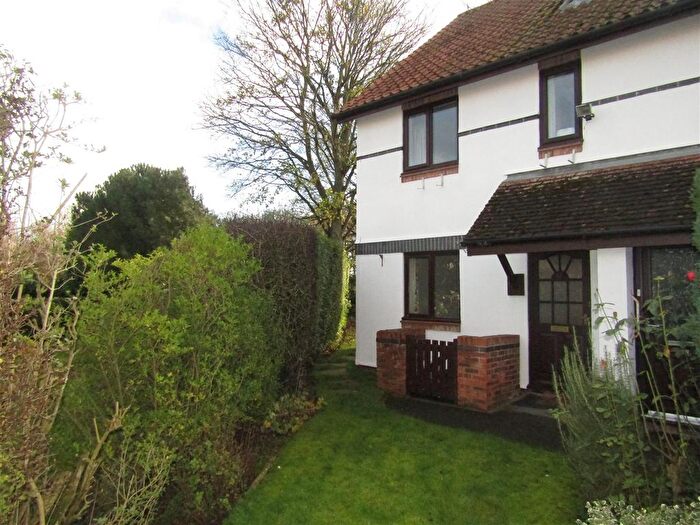
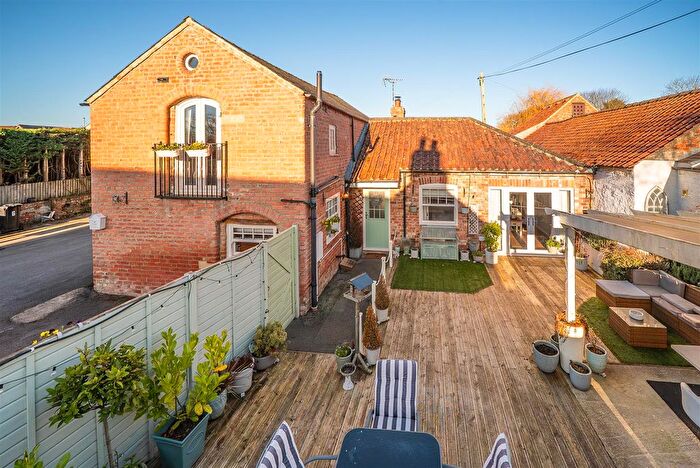
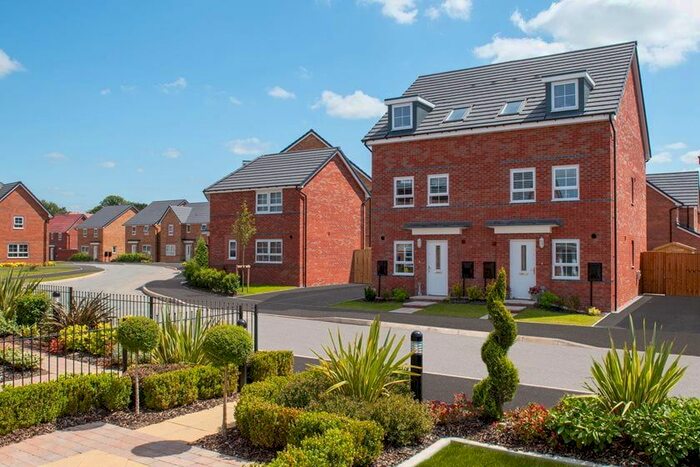
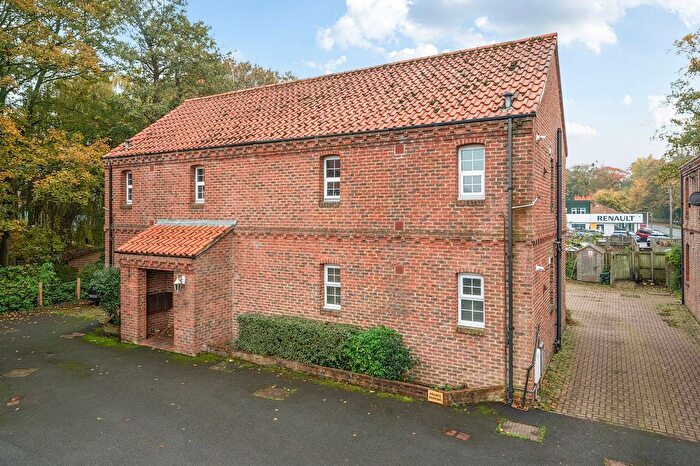
Houses for sale & to rent in Boroughbridge, York
House Prices in Boroughbridge
Properties in Boroughbridge have an average house price of £284,219.00 and had 166 Property Transactions within the last 3 years¹.
Boroughbridge is an area in York, North Yorkshire with 1,348 households², where the most expensive property was sold for £790,050.00.
Properties for sale in Boroughbridge
Previously listed properties in Boroughbridge
Roads and Postcodes in Boroughbridge
Navigate through our locations to find the location of your next house in Boroughbridge, York for sale or to rent.
| Streets | Postcodes |
|---|---|
| Abel Close | YO51 9US |
| Aldborough | YO51 9EP YO51 9EZ YO51 9HB YO51 9HD YO51 9HA |
| Aldborough Road | YO51 9EA |
| Arrows Crescent | YO51 9LP |
| Arrows Terrace | YO51 9LR |
| Ashbourne Close | YO51 9JJ |
| Ashbourne Road | YO51 9HX |
| Back Lane | YO51 9AT YO51 9PQ |
| Back Street | YO51 9EX YO51 9EU |
| Barnaby Way | YO51 9GJ |
| Battle Close | YO51 9GN |
| Boroughbridge Road | HG5 0QN HG5 0QW |
| Bridge Street | YO51 9LA YO51 9LF YO51 9LB YO51 9LG |
| Chatsworth Grove | YO51 9BB |
| Chatsworth Terrace | YO51 9AE |
| Cherry Lane | YO51 9GX |
| Chestnut Drive | YO51 9FW |
| Church Lane | YO51 9BA YO51 9BD YO51 9DA |
| Church Mews | YO51 9NZ |
| Craven Way | YO51 9UR |
| Cygnet Mews | YO51 9FH |
| Druids Meadow | YO51 9NF YO51 9NP |
| Dunsforth Road | YO51 9EY YO51 9FG |
| East Gate | YO51 9AY |
| Fishergate | YO51 9AL |
| Florence Court | YO51 9NU |
| Fothergill Way | YO51 9UX |
| Fountain Court Mews | YO51 9PG |
| Front Street | YO51 9ES |
| Greenways | YO51 9EN |
| Hall Square | YO51 9AN |
| Harclay Garth | YO51 9GL |
| Harness Lane | YO51 9PF |
| Hazel Road | YO51 9UT |
| Hazeldene Fold | YO51 9PH |
| Hereford Way | YO51 9PA |
| High Street | YO51 9AW YO51 9ET |
| Horsefair | YO51 9AA YO51 9AD YO51 9AH YO51 9AQ YO51 9FD YO51 9HP YO51 9HR |
| Hunters Row | YO51 9PE |
| Kingfisher Reach | YO51 9JS |
| Ladywell Road | YO51 9HL |
| Lancaster Court | YO51 9NJ |
| Langthorpe | YO51 9UQ YO51 9XE |
| Lawson Avenue | YO51 9UU |
| Low Road | YO51 9ER |
| Mallard Walk | YO51 9LQ |
| Marina Lane | YO51 9GF |
| Mill Lane | YO51 9LH |
| Mowbray Garth | YO51 9NT |
| New Row | YO51 9AX |
| Oak Close | YO51 9FZ |
| Orchard Terrace | YO51 9AF |
| Police Houses | YO51 9EQ |
| Pyesbury Walk | YO51 9BR |
| Roecliffe Drive | YO51 9JZ |
| Roecliffe Lane | YO51 9LJ YO51 9LN YO51 9LW |
| Smithsons Grove | YO51 9UZ |
| Southolme Close | YO51 9AU |
| Southolme Walk | YO51 9HW YO51 9AP |
| Spring Gardens | YO51 9EL |
| Springfield Close | YO51 9HN |
| Springfield Drive | YO51 9ED |
| Springfield Drive Bungalows | YO51 9EE |
| Springfield Drive Flats | YO51 9EF |
| Springfield Grove | YO51 9EG |
| Springfield Road | YO51 9AZ |
| St Helena | YO51 9AG |
| St James Meadow | YO51 9NW |
| St James Square | YO51 9AR YO51 9AS |
| Stump Cross | YO51 9HU |
| The Chase | YO51 9JT |
| The Close | YO51 9JQ |
| The Paddock | YO51 9NY |
| The Ridings | YO51 9PD |
| The Terrace | YO51 9EJ |
| Vine Terrace | YO51 9AB |
| Vineries | YO51 9AJ |
| Wetherby Road | YO51 9GH YO51 9HS YO51 9JX YO51 9UY |
| Willow Grove | YO51 9FX |
| York Road | YO51 9EB YO51 9EH YO51 9EW |
| YO51 9HT YO51 9JH YO51 9JW YO51 9HE YO51 9HF YO51 9HG YO51 9LD YO51 9UJ YO51 9XU YO51 9YU |
Transport near Boroughbridge
-
Knaresborough Station
-
Cattal Station
-
Starbeck Station
-
Hammerton Station
-
Harrogate Station
-
Hornbeam Park Station
-
Thirsk Station
- FAQ
- Price Paid By Year
- Property Type Price
Frequently asked questions about Boroughbridge
What is the average price for a property for sale in Boroughbridge?
The average price for a property for sale in Boroughbridge is £284,219. This amount is 32% lower than the average price in York. There are 403 property listings for sale in Boroughbridge.
What streets have the most expensive properties for sale in Boroughbridge?
The streets with the most expensive properties for sale in Boroughbridge are Low Road at an average of £630,000, Mallard Walk at an average of £530,000 and Oak Close at an average of £506,250.
What streets have the most affordable properties for sale in Boroughbridge?
The streets with the most affordable properties for sale in Boroughbridge are Roecliffe Drive at an average of £80,750, Smithsons Grove at an average of £92,500 and Mill Lane at an average of £141,530.
Which train stations are available in or near Boroughbridge?
Some of the train stations available in or near Boroughbridge are Knaresborough, Cattal and Starbeck.
Property Price Paid in Boroughbridge by Year
The average sold property price by year was:
| Year | Average Sold Price | Price Change |
Sold Properties
|
|---|---|---|---|
| 2025 | £294,275 | 11% |
58 Properties |
| 2024 | £262,539 | -11% |
47 Properties |
| 2023 | £291,362 | -11% |
61 Properties |
| 2022 | £324,863 | 15% |
94 Properties |
| 2021 | £274,544 | -19% |
105 Properties |
| 2020 | £327,975 | 11% |
79 Properties |
| 2019 | £292,699 | -0,4% |
91 Properties |
| 2018 | £293,910 | 12% |
86 Properties |
| 2017 | £258,180 | -8% |
57 Properties |
| 2016 | £280,105 | 20% |
44 Properties |
| 2015 | £223,233 | -11% |
49 Properties |
| 2014 | £247,172 | 15% |
75 Properties |
| 2013 | £210,206 | -12% |
47 Properties |
| 2012 | £234,844 | -0,3% |
27 Properties |
| 2011 | £235,462 | 11% |
58 Properties |
| 2010 | £209,058 | 3% |
41 Properties |
| 2009 | £203,112 | 7% |
43 Properties |
| 2008 | £188,605 | -12% |
35 Properties |
| 2007 | £212,106 | 6% |
88 Properties |
| 2006 | £200,433 | -11% |
116 Properties |
| 2005 | £222,345 | 17% |
69 Properties |
| 2004 | £183,573 | 15% |
96 Properties |
| 2003 | £155,973 | 14% |
82 Properties |
| 2002 | £133,579 | 25% |
88 Properties |
| 2001 | £100,185 | 8% |
83 Properties |
| 2000 | £91,695 | 6% |
87 Properties |
| 1999 | £86,138 | 13% |
116 Properties |
| 1998 | £74,543 | -7% |
71 Properties |
| 1997 | £79,913 | 6% |
85 Properties |
| 1996 | £74,848 | 4% |
75 Properties |
| 1995 | £71,838 | - |
107 Properties |
Property Price per Property Type in Boroughbridge
Here you can find historic sold price data in order to help with your property search.
The average Property Paid Price for specific property types in the last three years are:
| Property Type | Average Sold Price | Sold Properties |
|---|---|---|
| Semi Detached House | £269,973.00 | 52 Semi Detached Houses |
| Detached House | £403,662.00 | 55 Detached Houses |
| Terraced House | £218,977.00 | 40 Terraced Houses |
| Flat | £114,807.00 | 19 Flats |

