
Houses for sale & to rent in Newby, York
House Prices in Newby
Properties in Newby have an average house price of £371k and had 78 Property Transactions within the last 3 years¹.
Newby is an area in York, North Yorkshire with 673 households², where the most expensive property was sold for £842k.
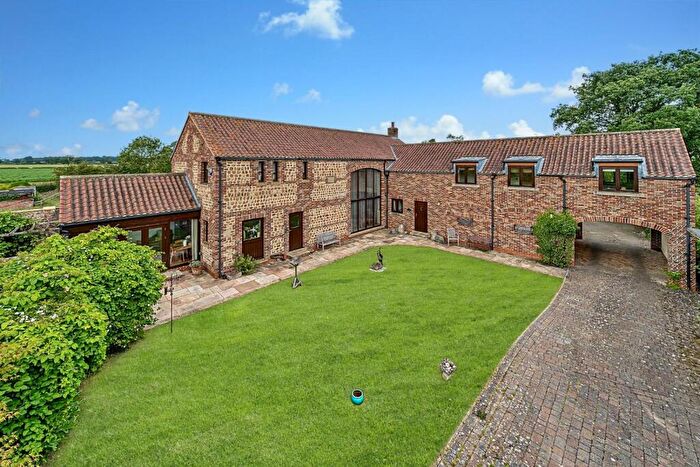
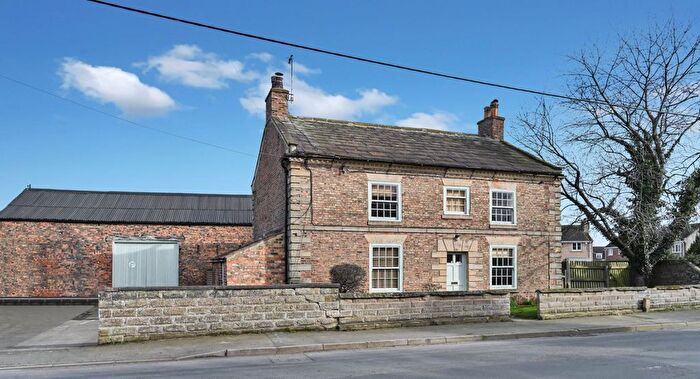
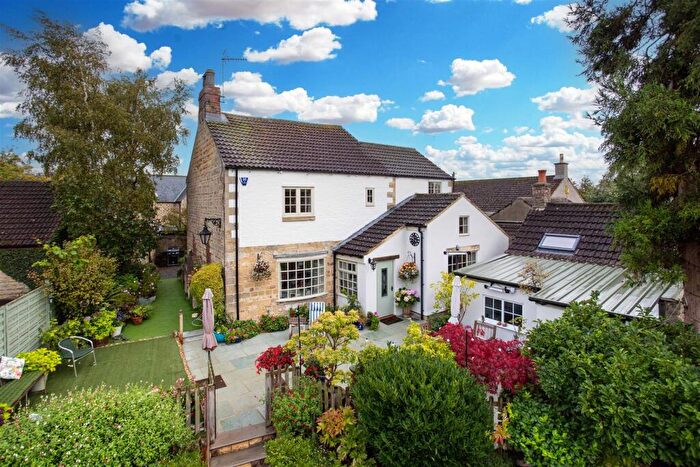
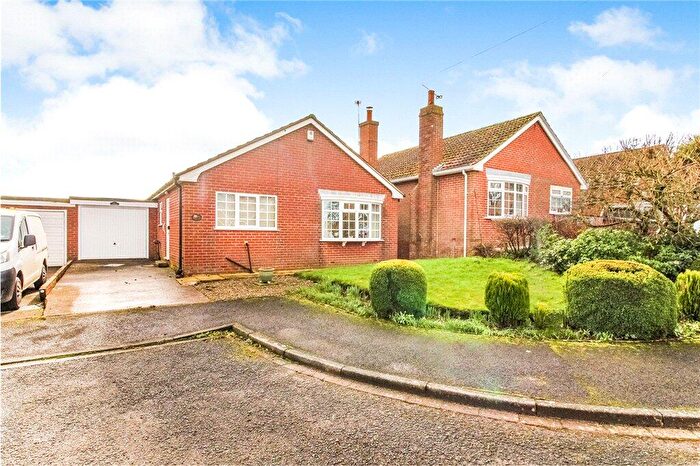
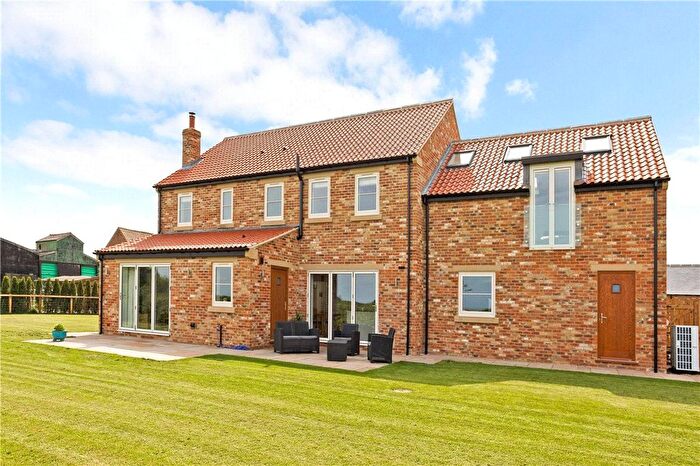
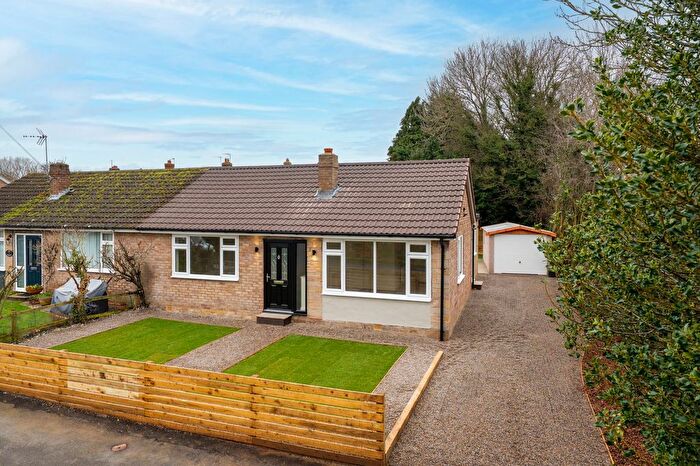
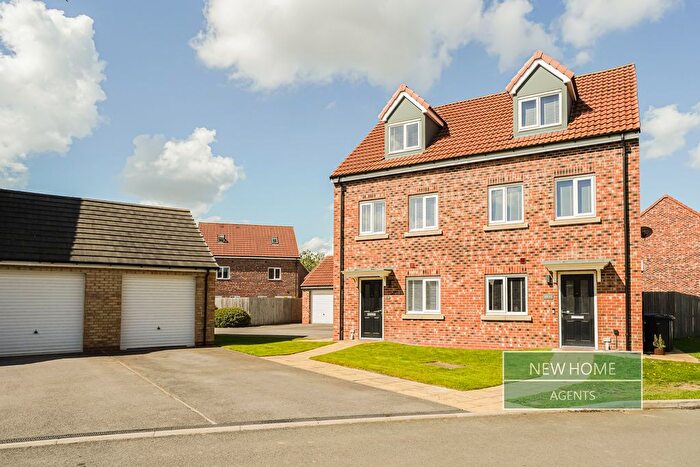
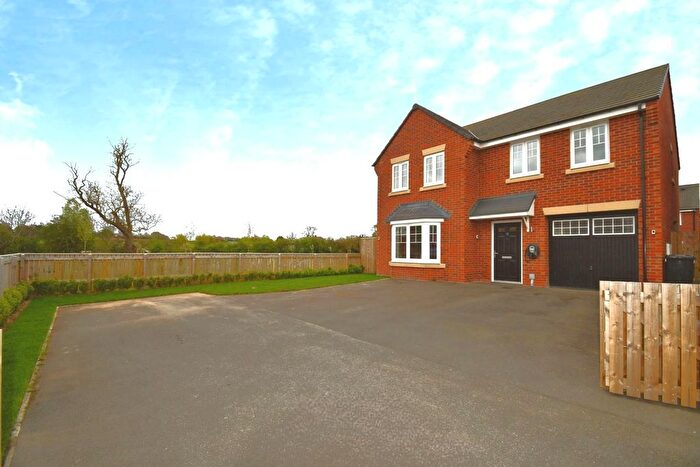
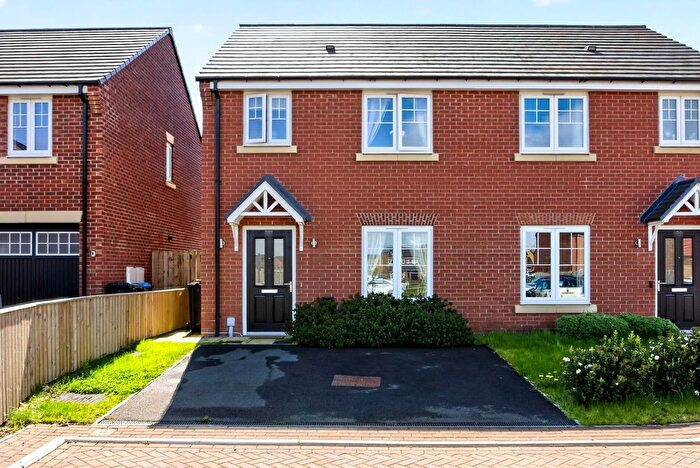
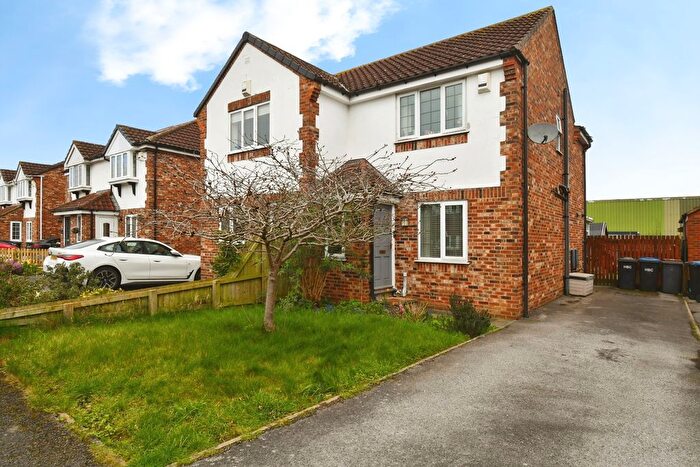
Properties for sale in Newby
![]()
If you are looking to sell your house, let it out, or receive a property valuation, an expert can help you.
Click the button below to get started.
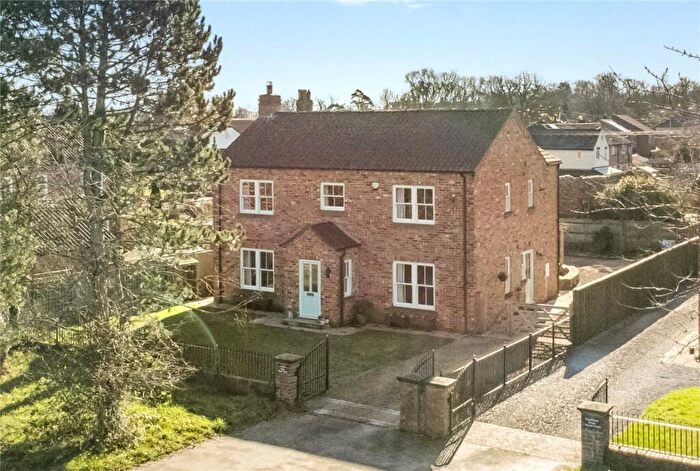
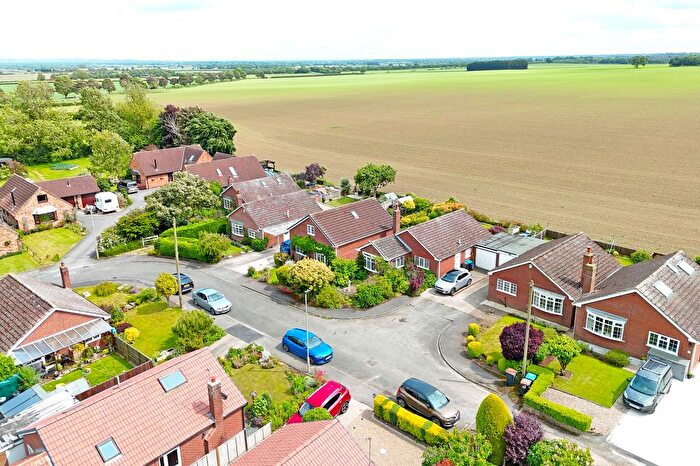
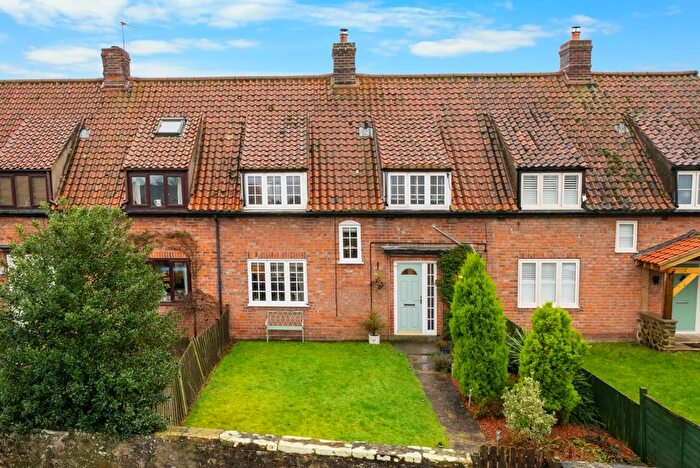
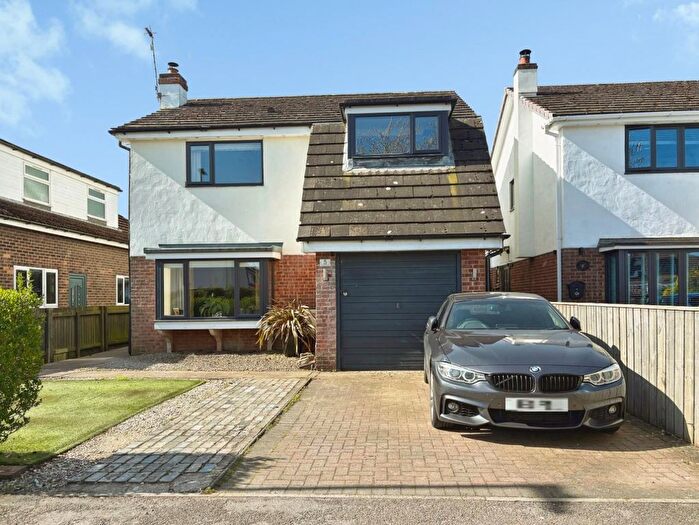
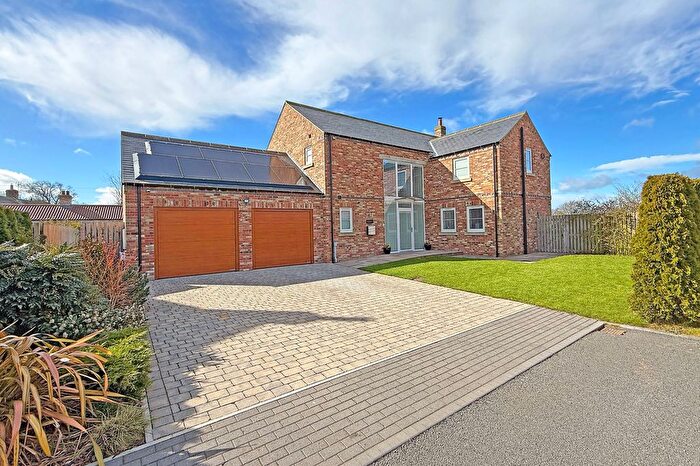
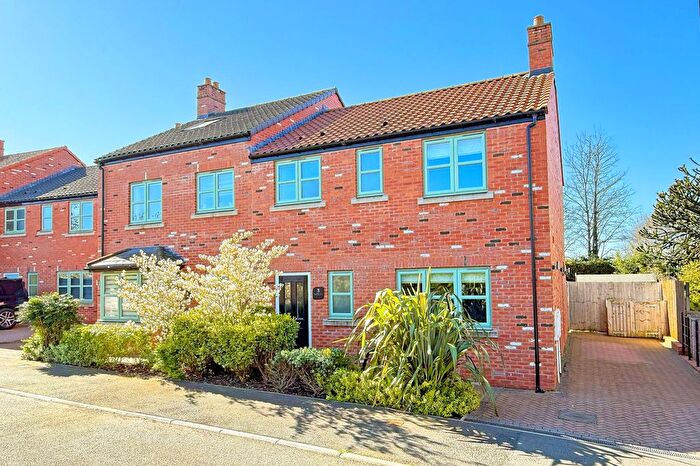
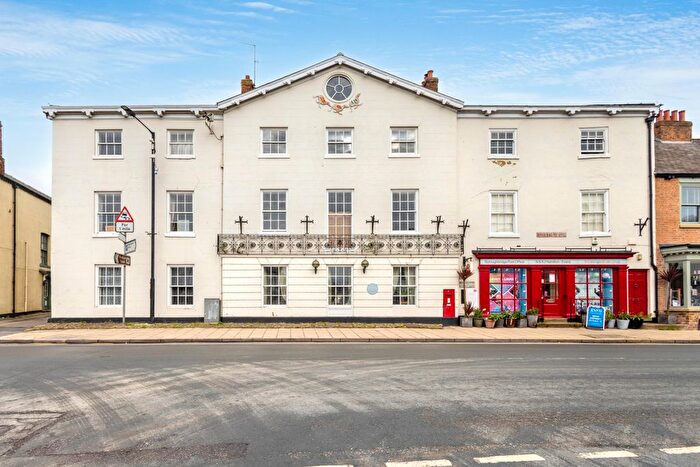
Previously listed properties in Newby
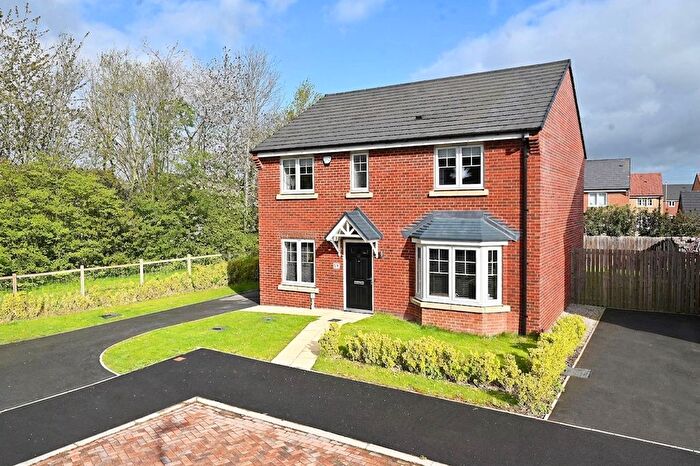
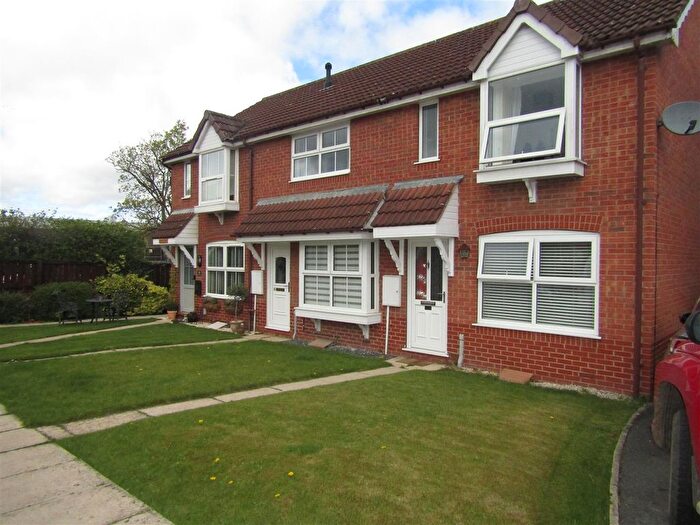
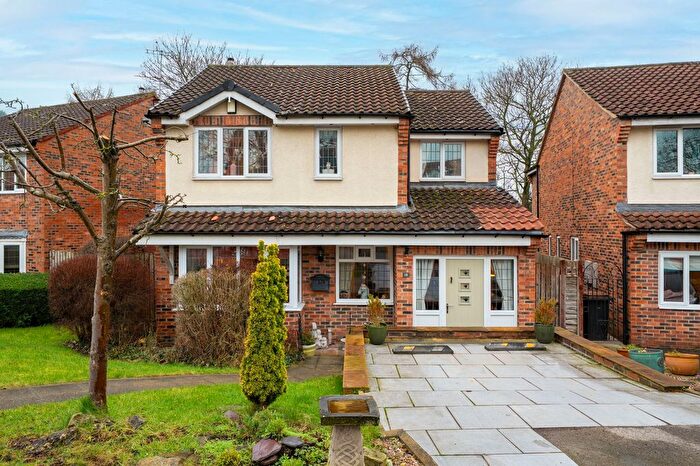
![]()
If you are looking to sell your house, let it out, or receive a property valuation, an expert can help you.
Click the button below to get started.
Roads and Postcodes in Newby
Navigate through our locations to find the location of your next house in Newby, York for sale or to rent.
| Streets | Postcodes |
|---|---|
| All Saints Close | YO51 9DW |
| Anchor Terrace | YO51 9BT |
| Back Lane | YO51 9FE |
| Bar Lane | YO51 9LS |
| Barrowgates | YO51 9NA |
| Becklands Close | YO51 9NR |
| Burton Cottages | YO61 2RZ |
| Church Close | YO51 9DT |
| Church Lane | YO51 9DX |
| Church View | YO51 9BG YO51 9NB |
| East View | YO51 9DG |
| Glebe Close | YO51 9BQ |
| Greenholme Close | YO51 9GA |
| Hill View | YO51 9BE |
| Humberton | YO61 2RX |
| Kirby Hill | YO51 9DH YO51 9DN YO51 9DR YO51 9DS |
| Langthorpe | YO51 9BH YO51 9BP YO51 9BZ YO51 9DZ |
| Leeming Lane | YO51 9DE |
| Manor Drive | YO51 9DY |
| Market Hill | YO51 9JU |
| Milby | YO51 9BL YO51 9HH YO51 9HQ |
| Minerva Court | YO51 9PB |
| Norwood Terrace | YO51 9BJ |
| Orchard Cottages | YO51 9LX |
| Ripon Road | YO51 9DP |
| Riverside Gardens | YO51 9GB |
| Skelton Road | YO51 9GD |
| St Johns Avenue | YO51 9DL |
| St Johns Walk | YO51 9DJ |
| Station Court | YO51 9JR |
| Station Terrace | YO51 9BU |
| Station View | YO51 9BX |
| The Croft | YO51 9YA |
| The Grange | YO51 9YB |
| The Terrace | YO51 9DQ |
| Thornton Bridge | YO61 2RH |
| Victory Terrace | YO51 9BY |
| Waterside | YO51 9GE YO51 9GY |
| Westwick | YO51 9NH |
| YO51 9LY YO61 2RY |
Transport near Newby
-
 Knaresborough Station
 -
Cattal Station
-
Starbeck Station
-
Thirsk Station
-
Hammerton Station
-
Harrogate Station
-
Hornbeam Park Station
- FAQ
- Price Paid By Year
- Property Type Price
Frequently asked questions about Newby
What is the average price for a property for sale in Newby?
The average price for a property for sale in Newby is £371,038. This amount is 12% lower than the average price in York. There are 515 property listings for sale in Newby.
What streets have the most expensive properties for sale in Newby?
The streets with the most expensive properties for sale in Newby are The Croft at an average of £647,000, Riverside Gardens at an average of £580,000 and Burton Cottages at an average of £530,000.
What streets have the most affordable properties for sale in Newby?
The streets with the most affordable properties for sale in Newby are Minerva Court at an average of £114,975, Anchor Terrace at an average of £200,562 and Church View at an average of £206,666.
Which train stations are available in or near Newby?
Some of the train stations available in or near Newby are Knaresborough, Cattal and Starbeck.
Property Price Paid in Newby by Year
The average sold property price by year was:
| Year | Average Sold Price | Price Change |
Sold Properties
|
|---|---|---|---|
| 2026 | £450,000 | 12% |
1 Property |
| 2025 | £394,050 | 14% |
30 Properties |
| 2024 | £337,597 | -9% |
20 Properties |
| 2023 | £367,316 | -19% |
27 Properties |
| 2022 | £437,578 | 24% |
30 Properties |
| 2021 | £332,753 | 15% |
38 Properties |
| 2020 | £283,052 | -36% |
19 Properties |
| 2019 | £386,089 | 9% |
25 Properties |
| 2018 | £352,914 | 21% |
35 Properties |
| 2017 | £277,939 | 6% |
28 Properties |
| 2016 | £262,230 | -26% |
29 Properties |
| 2015 | £329,243 | 7% |
32 Properties |
| 2014 | £305,438 | 28% |
30 Properties |
| 2013 | £220,104 | -1% |
27 Properties |
| 2012 | £222,497 | -4% |
20 Properties |
| 2011 | £230,338 | -11% |
22 Properties |
| 2010 | £255,028 | 1% |
25 Properties |
| 2009 | £252,869 | -6% |
20 Properties |
| 2008 | £267,860 | 19% |
14 Properties |
| 2007 | £217,395 | -37% |
46 Properties |
| 2006 | £296,814 | 15% |
47 Properties |
| 2005 | £252,772 | -9% |
22 Properties |
| 2004 | £274,521 | 28% |
39 Properties |
| 2003 | £198,985 | 18% |
33 Properties |
| 2002 | £162,311 | 16% |
38 Properties |
| 2001 | £136,645 | 17% |
53 Properties |
| 2000 | £113,353 | 3% |
55 Properties |
| 1999 | £109,904 | 26% |
45 Properties |
| 1998 | £81,414 | -14% |
17 Properties |
| 1997 | £93,145 | 26% |
46 Properties |
| 1996 | £69,095 | -28% |
41 Properties |
| 1995 | £88,655 | - |
17 Properties |
Property Price per Property Type in Newby
Here you can find historic sold price data in order to help with your property search.
The average Property Paid Price for specific property types in the last three years are:
| Property Type | Average Sold Price | Sold Properties |
|---|---|---|
| Semi Detached House | £315,941.00 | 13 Semi Detached Houses |
| Detached House | £475,594.00 | 38 Detached Houses |
| Terraced House | £252,622.00 | 18 Terraced Houses |
| Flat | £245,994.00 | 9 Flats |