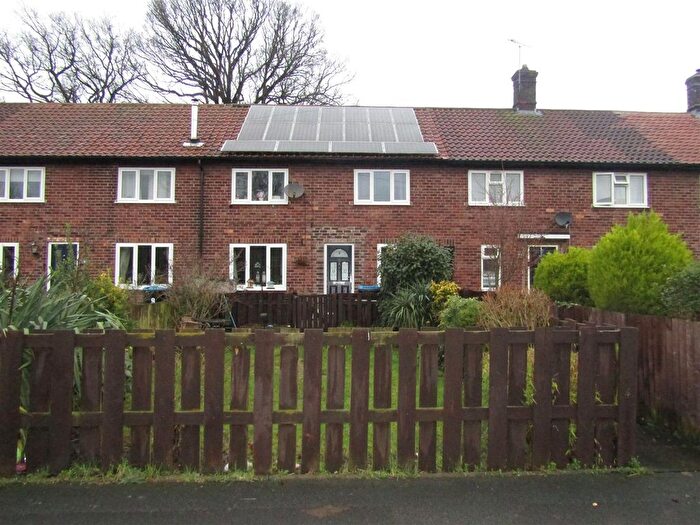
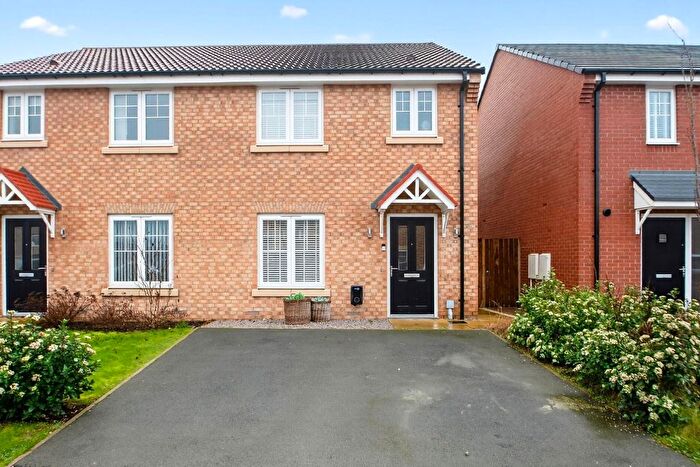
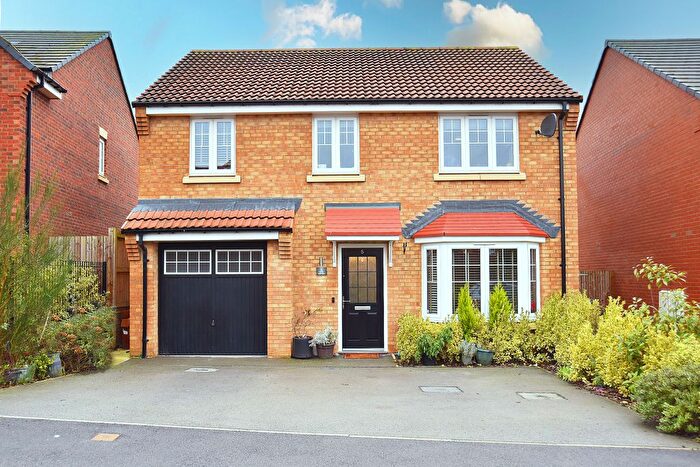
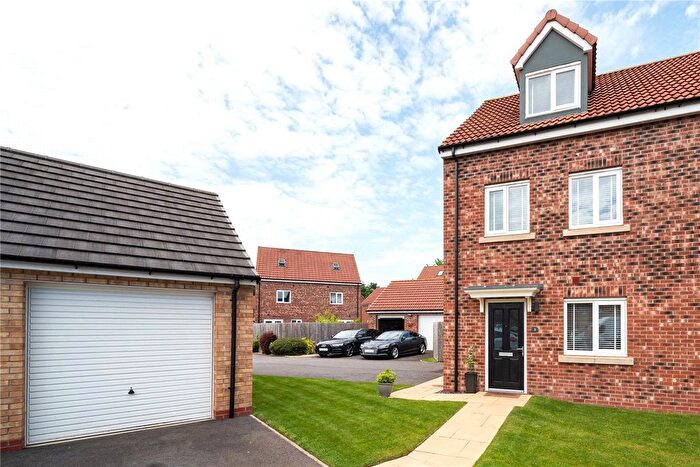
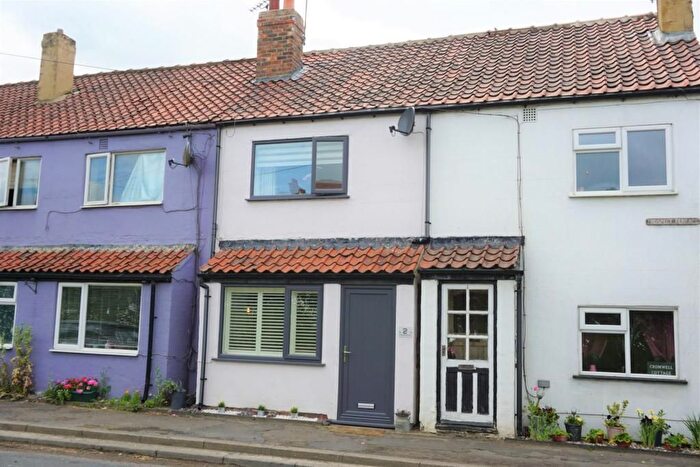
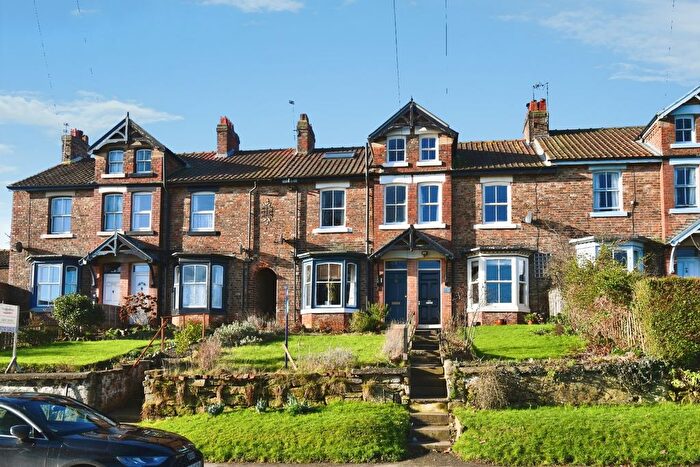
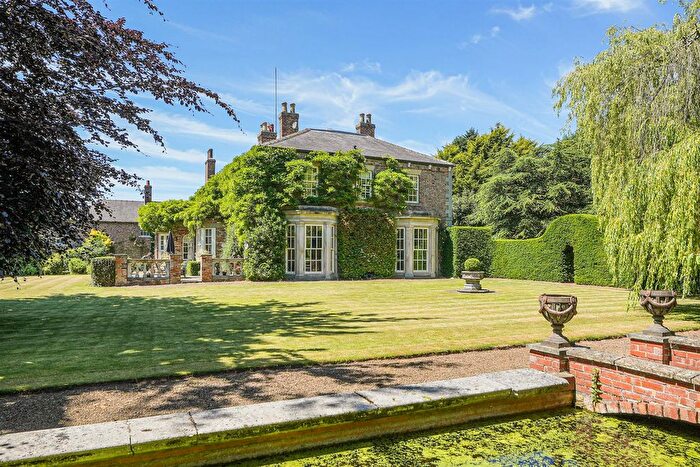
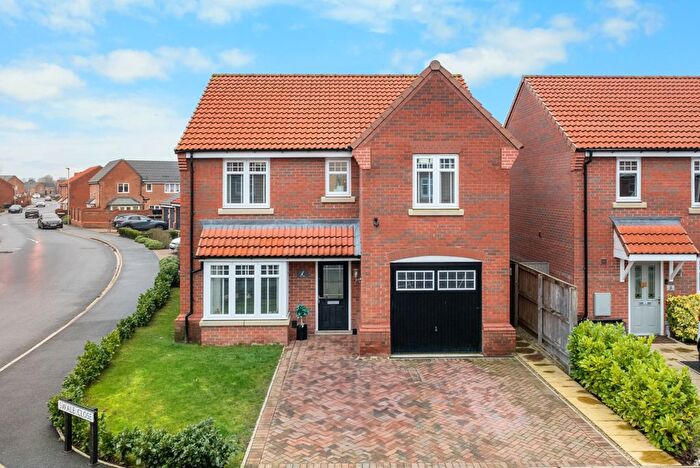
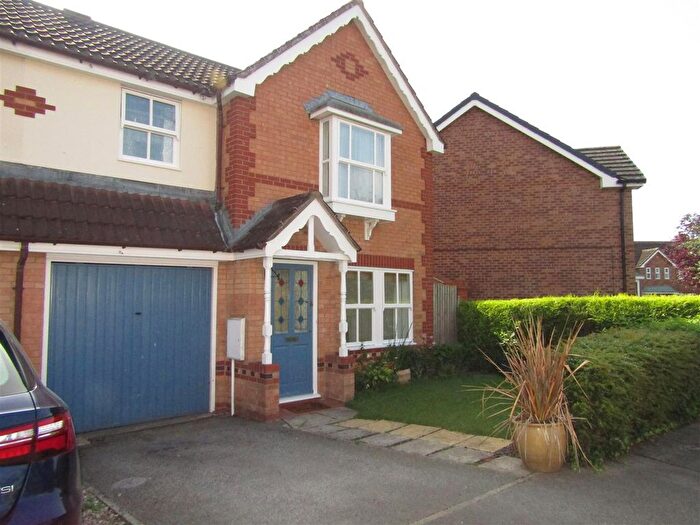
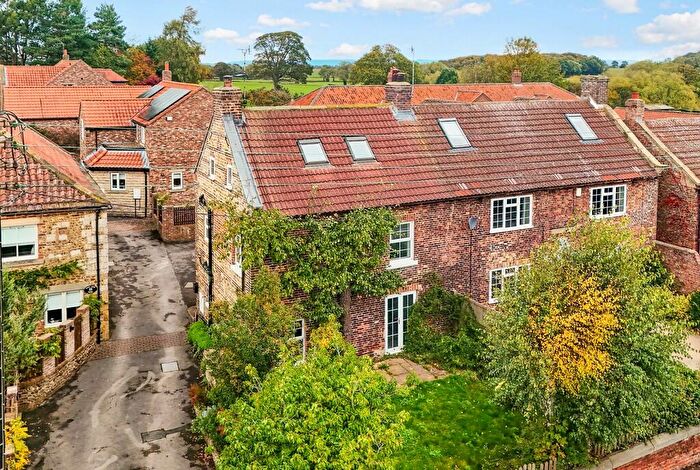
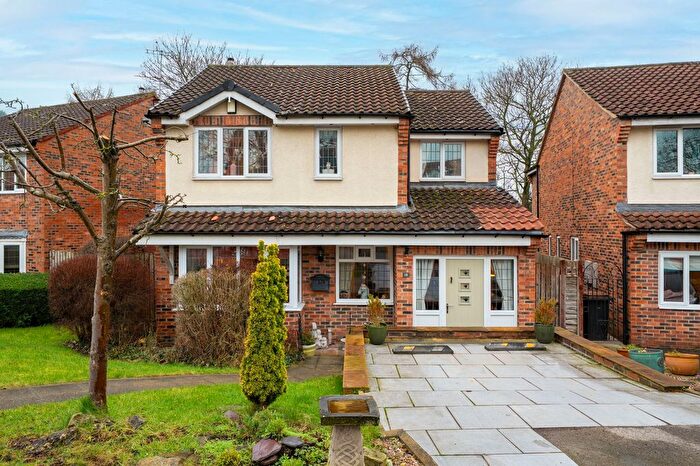
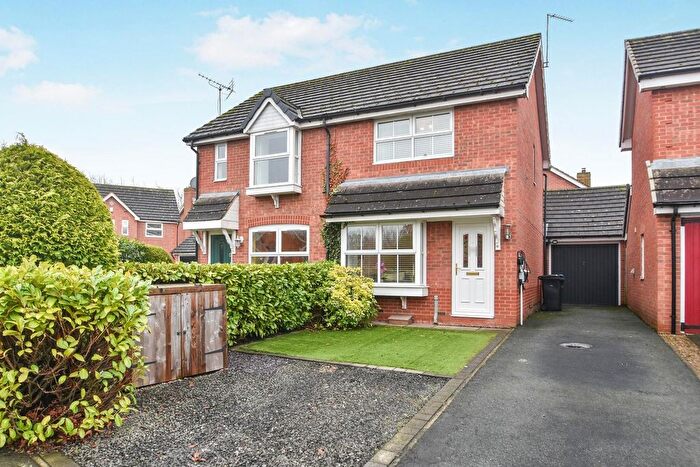
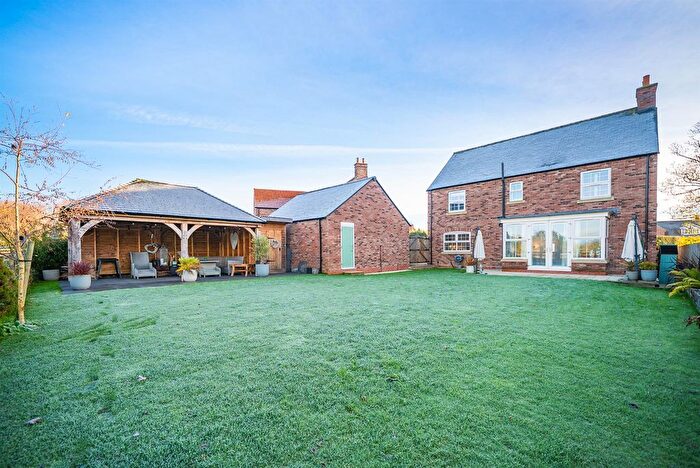
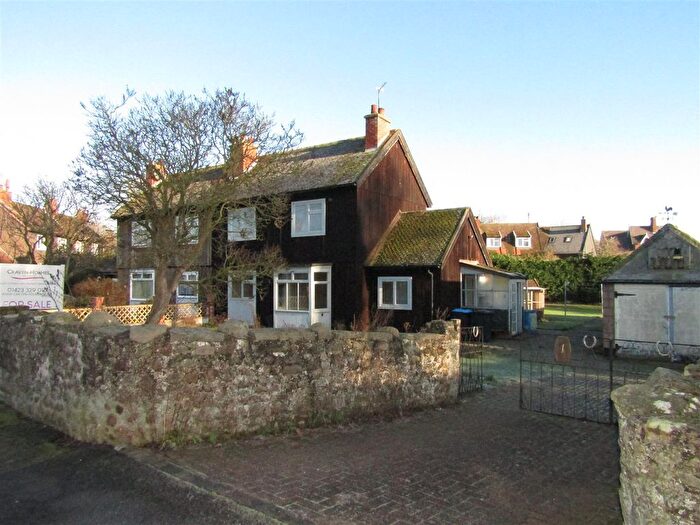
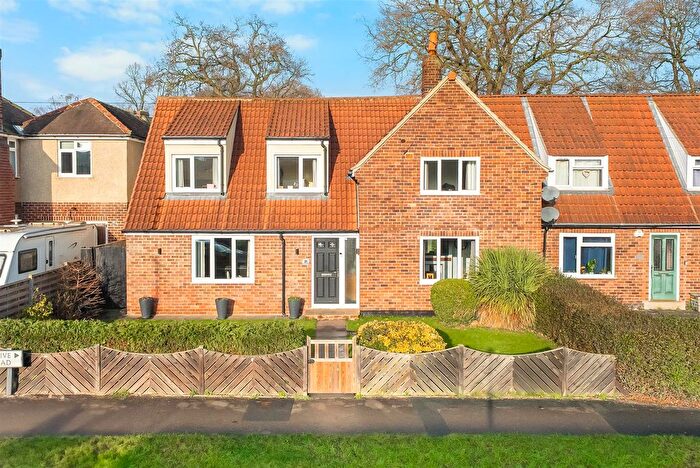
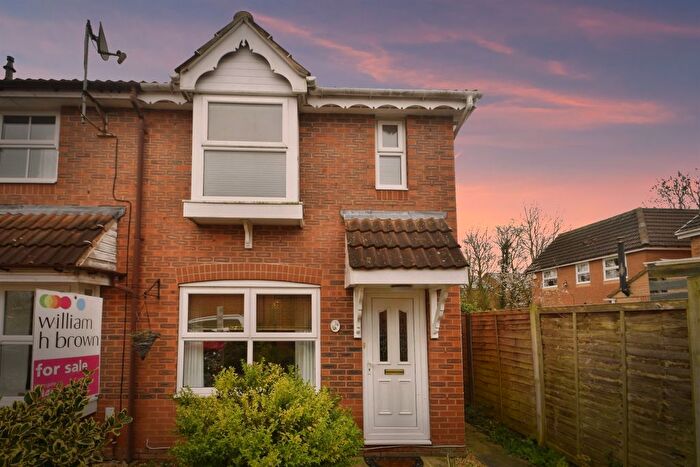
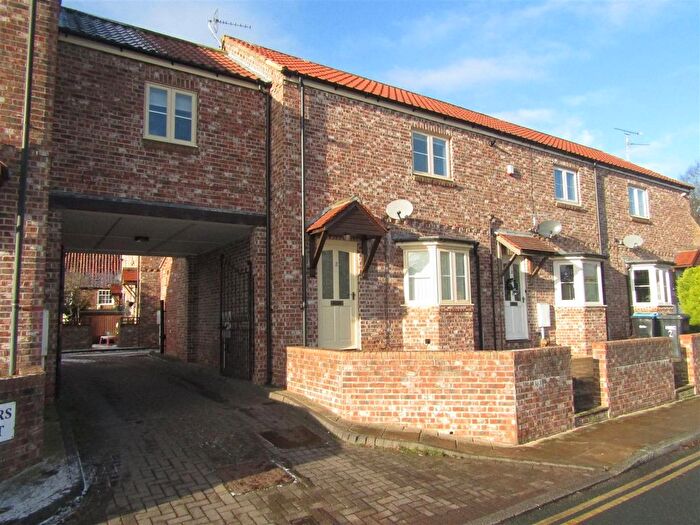
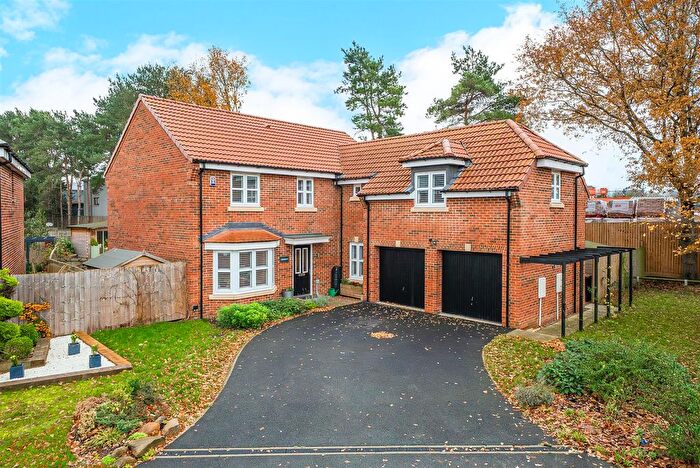
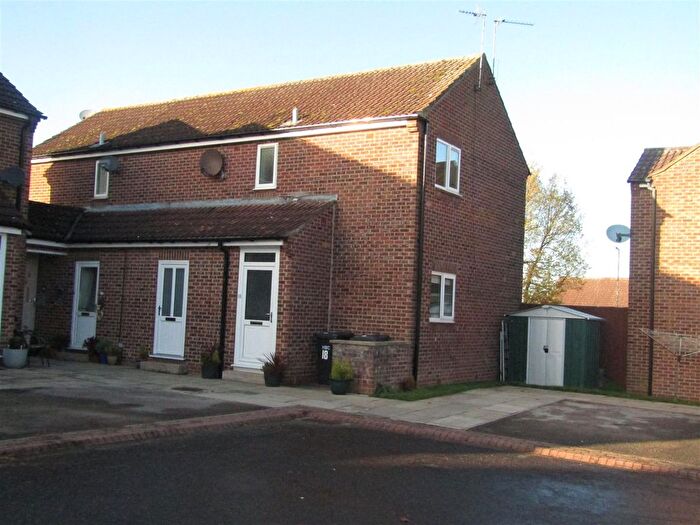
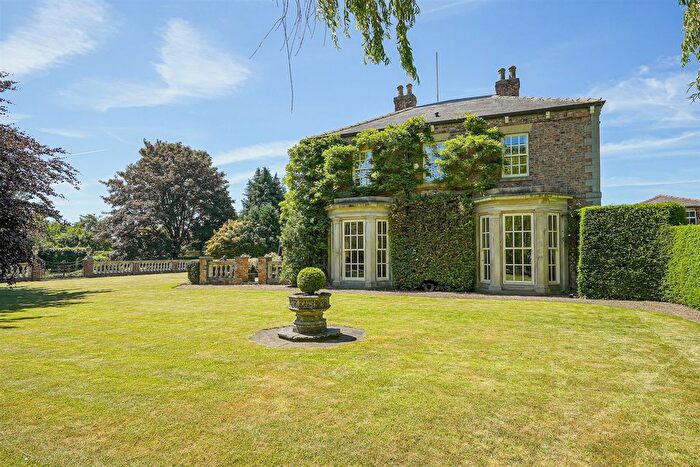
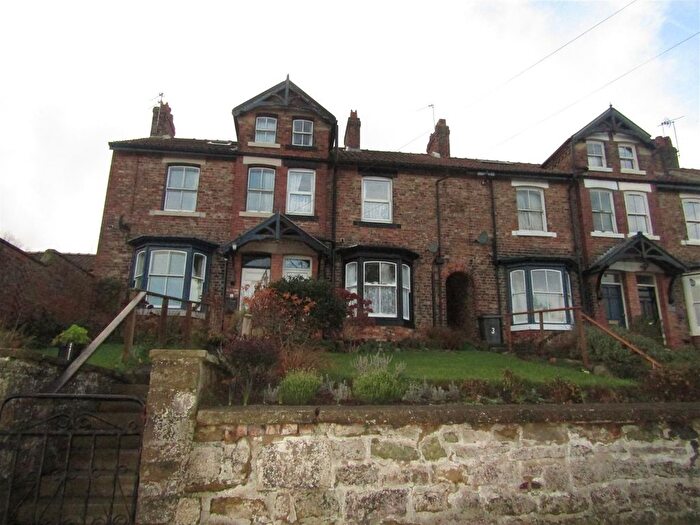
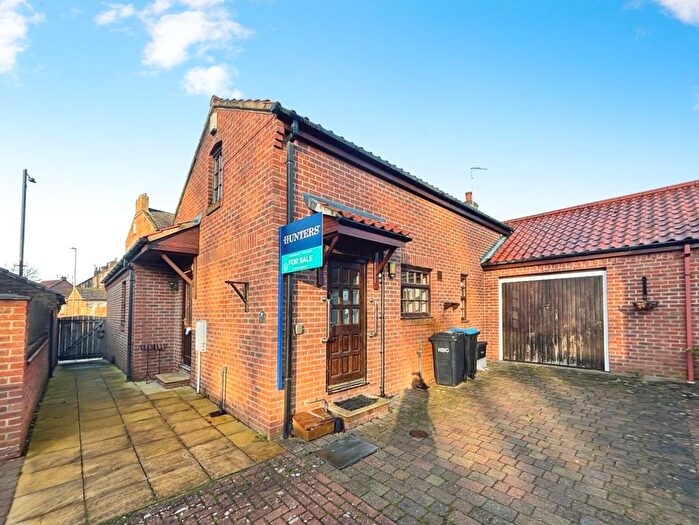
Houses for sale & to rent in Claro, York
House Prices in Claro
Properties in Claro have an average house price of £556,500.00 and had 20 Property Transactions within the last 3 years¹.
Claro is an area in York, North Yorkshire with 385 households², where the most expensive property was sold for £1,700,000.00.
Properties for sale in Claro
Previously listed properties in Claro
Roads and Postcodes in Claro
Navigate through our locations to find the location of your next house in Claro, York for sale or to rent.
| Streets | Postcodes |
|---|---|
| Braimber Lane | YO51 9QG |
| Church Lane | YO51 9QX |
| Harrogate Road | YO51 9JD |
| Henthorne Cottages | YO51 9JA |
| Hill Top | YO51 9QA |
| Legram Lane | YO51 9PS |
| Lodge Yard | YO51 9JL |
| Marton | YO51 9QY |
| Marton Court | YO51 9PY |
| Mill Field | YO51 9PT |
| Minskip Road | YO51 9HY |
| Priestcarr Lane | YO51 9QF |
| Prospect Terrace | YO51 9JE |
| Reas Lane | YO51 9QB YO51 9QD |
| Spring Bank | YO51 9QZ |
| Stockfield Lane | YO51 9PZ |
| The Close | YO51 9JG |
| The Croft | YO51 9PR |
| The Nookin | YO51 9QW |
| Thorny Hill Lane | YO51 9QJ |
| Wincup Lane | YO51 9JN |
| YO26 9RU YO26 9RZ YO26 9SA YO51 9HZ YO51 9JB YO51 9JF YO51 9QL YO51 9QQ YO51 9QS YO51 9QU |
Transport near Claro
-
Cattal Station
-
Knaresborough Station
-
Hammerton Station
-
Starbeck Station
-
Harrogate Station
-
Hornbeam Park Station
-
Pannal Station
- FAQ
- Price Paid By Year
- Property Type Price
Frequently asked questions about Claro
What is the average price for a property for sale in Claro?
The average price for a property for sale in Claro is £556,500. This amount is 32% higher than the average price in York. There are 390 property listings for sale in Claro.
What streets have the most expensive properties for sale in Claro?
The streets with the most expensive properties for sale in Claro are The Croft at an average of £987,500, Thorny Hill Lane at an average of £725,000 and Marton at an average of £471,250.
What streets have the most affordable properties for sale in Claro?
The streets with the most affordable properties for sale in Claro are Henthorne Cottages at an average of £230,000, Reas Lane at an average of £240,000 and Lodge Yard at an average of £330,000.
Which train stations are available in or near Claro?
Some of the train stations available in or near Claro are Cattal, Knaresborough and Hammerton.
Property Price Paid in Claro by Year
The average sold property price by year was:
| Year | Average Sold Price | Price Change |
Sold Properties
|
|---|---|---|---|
| 2025 | £492,250 | -32% |
10 Properties |
| 2024 | £647,500 | 14% |
7 Properties |
| 2023 | £558,333 | -16% |
3 Properties |
| 2022 | £647,100 | 17% |
15 Properties |
| 2021 | £538,228 | -22% |
21 Properties |
| 2020 | £659,029 | 46% |
17 Properties |
| 2019 | £358,328 | -29% |
9 Properties |
| 2018 | £462,550 | 23% |
10 Properties |
| 2017 | £357,283 | -47% |
12 Properties |
| 2016 | £526,529 | 31% |
18 Properties |
| 2015 | £362,071 | -4% |
14 Properties |
| 2014 | £376,347 | 8% |
18 Properties |
| 2013 | £346,607 | -11% |
14 Properties |
| 2012 | £383,630 | -18% |
13 Properties |
| 2011 | £452,416 | 1% |
13 Properties |
| 2010 | £448,818 | -5% |
11 Properties |
| 2009 | £470,777 | -15% |
9 Properties |
| 2008 | £542,295 | 29% |
10 Properties |
| 2007 | £384,685 | -6% |
14 Properties |
| 2006 | £408,270 | 7% |
22 Properties |
| 2005 | £378,031 | -19% |
21 Properties |
| 2004 | £449,342 | 27% |
13 Properties |
| 2003 | £325,911 | 26% |
12 Properties |
| 2002 | £242,058 | 6% |
17 Properties |
| 2001 | £227,123 | 27% |
25 Properties |
| 2000 | £166,370 | 7% |
17 Properties |
| 1999 | £154,173 | 4% |
23 Properties |
| 1998 | £148,544 | 4% |
11 Properties |
| 1997 | £143,270 | 20% |
10 Properties |
| 1996 | £115,312 | -15% |
16 Properties |
| 1995 | £133,083 | - |
6 Properties |
Property Price per Property Type in Claro
Here you can find historic sold price data in order to help with your property search.
The average Property Paid Price for specific property types in the last three years are:
| Property Type | Average Sold Price | Sold Properties |
|---|---|---|
| Semi Detached House | £350,625.00 | 4 Semi Detached Houses |
| Terraced House | £281,000.00 | 5 Terraced Houses |
| Detached House | £756,590.00 | 11 Detached Houses |

