
Houses for sale in Ouseburn, York
House Prices in Ouseburn
Properties in Ouseburn have an average house price of £560k and had 135 Property Transactions within the last 3 years¹.
Ouseburn is an area in York, North Yorkshire with 1,452 households², where the most expensive property was sold for £4.8M.
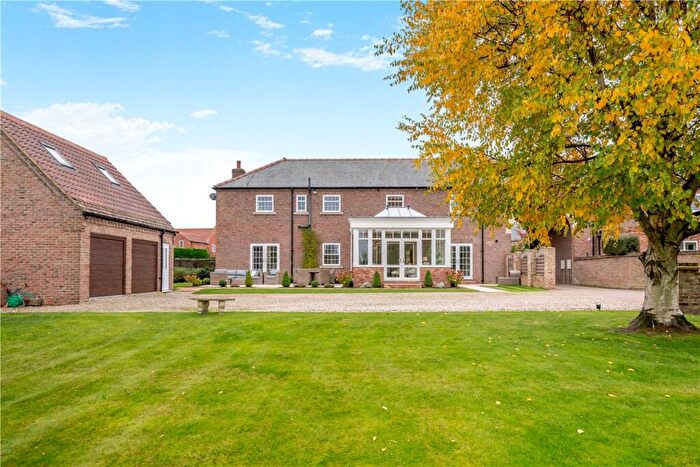
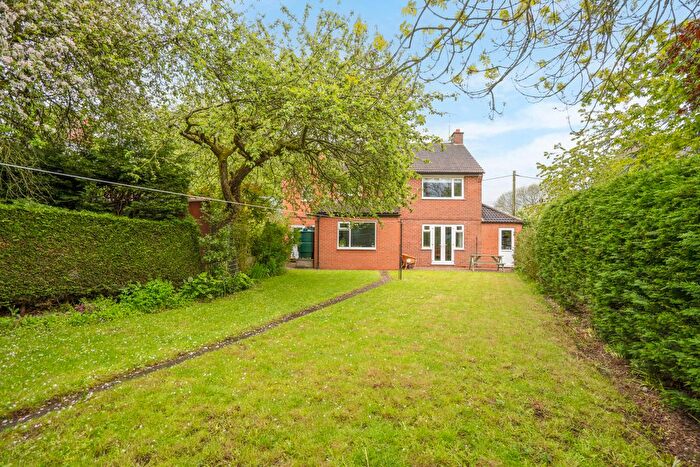
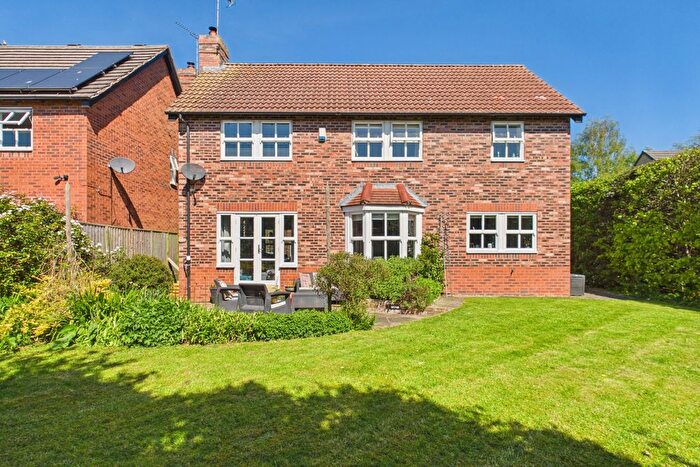
Properties for sale in Ouseburn
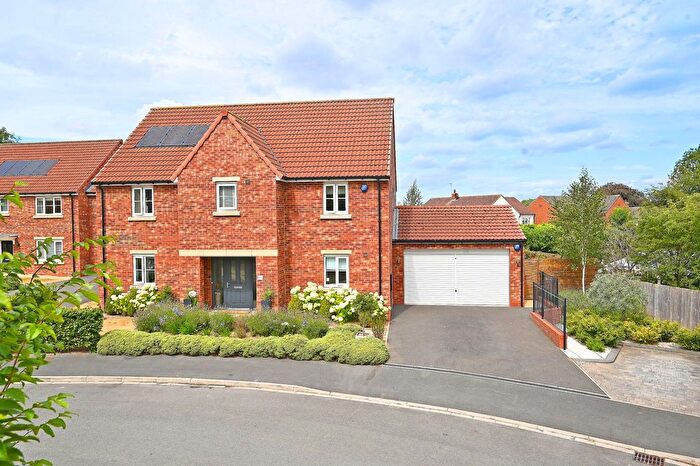
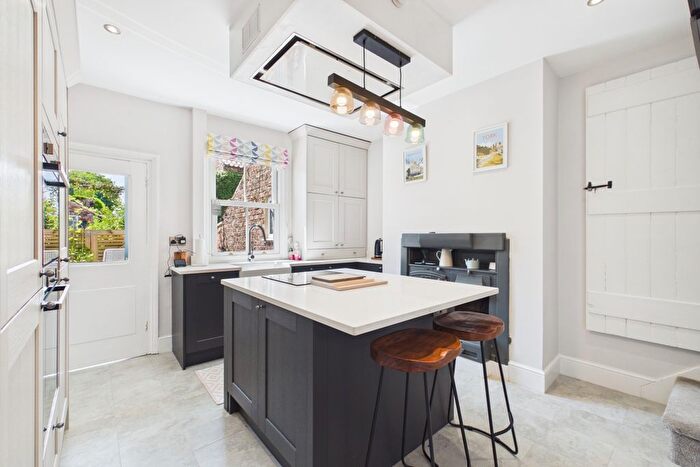
![]()
If you are looking to sell your house, let it out, or receive a property valuation, an expert can help you.
Click the button below to get started.
Roads and Postcodes in Ouseburn
Navigate through our locations to find the location of your next house in Ouseburn, York for sale or to rent.
| Streets | Postcodes |
|---|---|
| Ainsty View | YO26 8AJ |
| Back Lane | YO26 8BG YO26 8BH YO26 9TH |
| Bernard Lane | YO26 8BP |
| Boat Lane | YO26 9SJ |
| Boroughbridge Road | YO26 8AD YO26 8AE YO26 8AY YO26 8AZ YO26 8BA YO26 9TJ YO26 9TN YO26 9TP YO26 9TU YO26 9TW |
| Branton Close | YO26 9SF |
| Branton Court | YO26 9RJ |
| Branton Green | YO26 9RT |
| Branton Lane | YO26 9RP YO26 9RR YO26 9RS |
| Carr Side Road | YO26 9AE |
| Carrfield Lane | YO26 9SD |
| Carrside | YO26 9RW |
| Church Field Lane | YO26 9SG |
| Church Lane | YO26 8JH YO26 8LA |
| Church Street | YO26 8AR |
| Clockhill Field Lane | YO26 8DR |
| Cormorant Mews | YO26 8FT |
| Cowley Mews | YO26 8HF |
| Ebor View | YO26 8BR |
| Fairfax Mews | YO26 8FF |
| Farrers Close | YO26 8FE |
| Frank Lane | YO26 8EJ |
| Franks Lane | YO26 8AP |
| Gilsforth Lane | YO26 8BF |
| Gilsthwaite Lane | YO26 8FN |
| Grassgills | YO26 9TR |
| Great North Road | HG5 0FF HG5 0RD HG5 0RA HG5 0RB |
| Green Lane | YO26 8JN |
| Harewood Close | YO26 8FG |
| Harrogate Road | YO26 8AA YO26 8AB YO26 8DP |
| High Street | YO26 8AW |
| Hughlings Close | YO26 8FL |
| Ings Road | YO26 9SU |
| Ivy Close | YO51 9PU |
| Kestrel Drive | YO26 8FR |
| Kirby Villas | YO26 9SP |
| Kirk Hammerton Lane | YO26 8BS |
| Lightmire Lane | YO26 9RL |
| Lime Tree Court | YO26 9AD |
| Limebar Bank Road | YO51 9PJ |
| Longland Lane | YO26 8BB |
| Main Street | YO26 9RE YO26 9RF YO26 9RG YO26 9RQ YO26 9TB YO26 9TD YO26 9TE YO26 9TF YO26 9TG |
| Marton | YO51 9QE |
| Meadow Gardens | YO26 9AF |
| Meadow Vale | YO26 8BJ |
| Mistle Thrush Road | YO26 8FS |
| Moor Lane | LS22 5FQ YO26 9TT |
| Moss Hill Lane | YO26 9SY |
| New Lane | YO26 8BL YO26 8EP |
| New Road | YO26 8AG |
| Paddock Way | YO26 8FB YO26 8FD |
| Park View | YO26 8AT |
| Planetree Lane | YO26 8FQ |
| Pool Lane | YO26 8FP YO26 8EH YO26 8EL |
| Princess Corner | YO26 8EE |
| Priory Estate | YO26 8ES |
| Priory View | YO26 8JB |
| Red House Lane | YO26 8JE |
| Rudgate | YO26 8AL |
| Rudgate Grove | YO26 8AN |
| Scagglethorpe Lane | YO26 8LB |
| Scate Moor Lane | YO26 8FJ |
| Seggans Lane | YO26 9RN |
| Sleeper Lane | YO26 9TL |
| Springfield Rise | YO26 9SE |
| St Thomass Way | YO26 8BE |
| Starra Lane | YO26 8AU |
| Station Road | YO26 8AH |
| Stonegate | YO26 8AS |
| Stoneleigh Gate | YO26 8HG |
| The Cherry Orchard | YO26 8BU |
| The Cobbles | YO26 8EY |
| The Crescent | YO26 8BW |
| The Green | YO26 8BQ YO26 8ER YO26 8EW |
| Thorny Hill Lane | YO51 9PP |
| Thorpe Green Lane | YO26 9AA YO26 9SS YO26 9TA |
| Townend Court | YO26 9RD |
| Vine Farm Close | YO26 8YZ |
| West End | YO26 9TQ |
| West Lane | YO26 8AX |
| Widdington | YO26 8EX |
| Witherans Lane | YO26 9SQ |
| Wood Hill Close | YO51 9QP |
| York Road | YO26 8BN YO26 8EZ |
| YO26 8AQ YO26 8WE YO26 8WQ YO26 8WW YO26 8YD YO26 9SN YO26 9YQ YO26 9YR YO26 8AF YO26 8ED YO26 8EF YO26 8EG YO26 8EN YO26 8ET YO26 8EU YO26 8FA YO26 8HE YO26 8JA YO26 8JD YO26 8JF YO26 8JG YO26 8JJ YO26 8JL YO26 8JQ YO26 8JZ YO26 9AB YO26 9RX YO26 9RY YO26 9SB YO26 9SH YO26 9SR YO26 9ST YO26 9SW YO51 9PW YO51 9QH YO51 9QR YO51 9QT |
Property price trends in Ouseburn
According to the latest Land Registry data, the average home in Ouseburn sold for £1,559,000 in 2026. That figure comes from 1,724 sales logged over the past 31 years.
Prices have continued to climb over the last three years. Compared with 2023, when the typical sale came in around £511,725, that's a rise of roughly 204.7%.
Looking back five years, average prices are up about 217.7% since 2021, a gain of around £1,068,297 in cash terms.
Zoom out to the past decade for the fuller picture. Back in 2016, homes here averaged £465,768, so the typical sold price has climbed about 234.7% since then, roughly 12.8% a year. Stretch the view to fifteen years and that annual pace eases back to about 9.6%.
Frequently asked questions about Ouseburn
What is the average price for a property for sale in Ouseburn?
The average price for a property for sale in Ouseburn is £559,971. This amount is 33% higher than the average price in York. There are 640 property listings for sale in Ouseburn.
What streets have the most expensive properties for sale in Ouseburn?
The streets with the most expensive properties for sale in Ouseburn are Clockhill Field Lane at an average of £1,450,000, High Street at an average of £1,176,162 and Kirk Hammerton Lane at an average of £1,012,500.
What streets have the most affordable properties for sale in Ouseburn?
The streets with the most affordable properties for sale in Ouseburn are Cowley Mews at an average of £204,000, The Cobbles at an average of £266,250 and Carrside at an average of £269,166.
Which train stations are available in or near Ouseburn?
Some of the train stations available in or near Ouseburn are Cattal, Hammerton and Knaresborough.
Property Price Paid in Ouseburn by Year
The average sold property price by year was:
| Year | Average Sold Price | Price Change |
Sold Properties
|
|---|---|---|---|
| 2026 | £1,559,000 | 68% |
5 Properties |
| 2025 | £491,964 | -13% |
43 Properties |
| 2024 | £557,956 | 8% |
46 Properties |
| 2023 | £511,725 | 1% |
41 Properties |
| 2022 | £505,957 | 3% |
45 Properties |
| 2021 | £490,703 | 12% |
81 Properties |
| 2020 | £431,292 | 7% |
99 Properties |
| 2019 | £399,008 | 3% |
70 Properties |
| 2018 | £388,195 | 1% |
64 Properties |
| 2017 | £385,636 | -21% |
46 Properties |
Property Price per Property Type in Ouseburn
Here you can find historic sold price data in order to help with your property search.
The average Property Paid Price for specific property types in the last three years are:
| Property Type | Average Sold Price | Sold Properties |
|---|---|---|
| Semi Detached House | £385,843.00 | 32 Semi Detached Houses |
| Detached House | £698,783.00 | 82 Detached Houses |
| Terraced House | £283,284.00 | 21 Terraced Houses |
