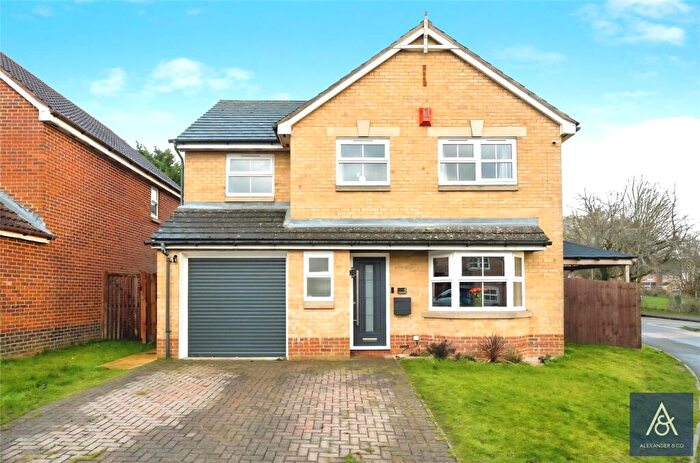
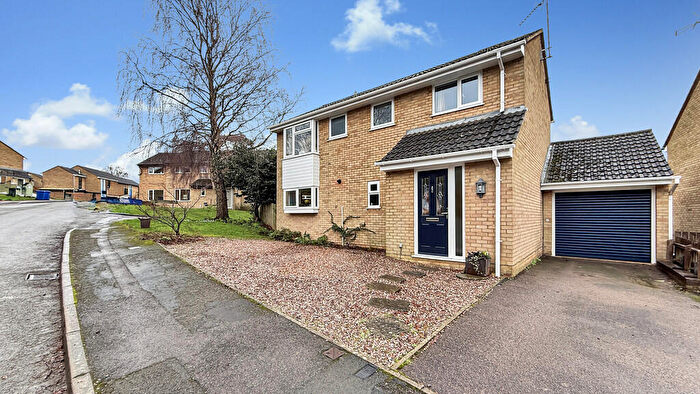
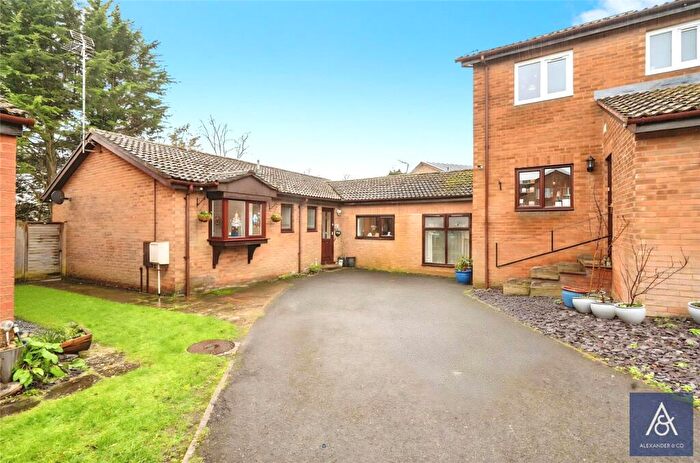
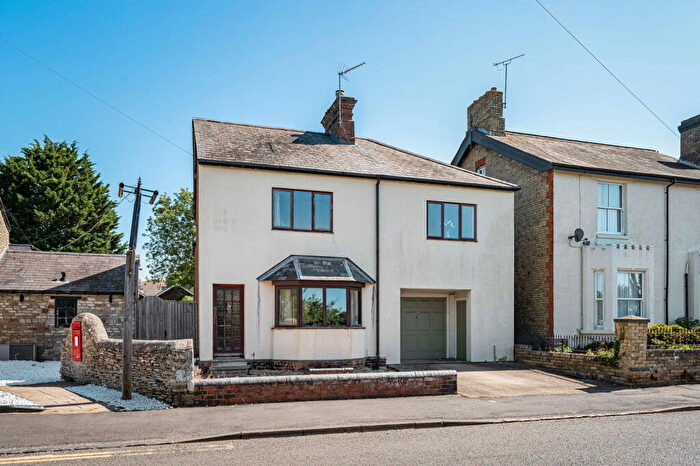
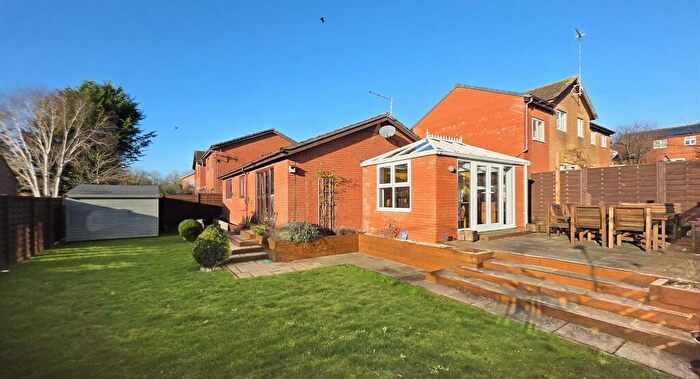
Houses for sale & to rent in Little Brook, Brackley
House Prices in Little Brook
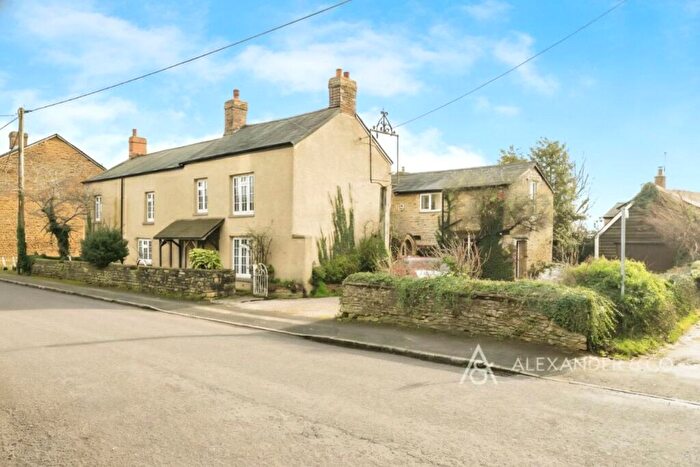
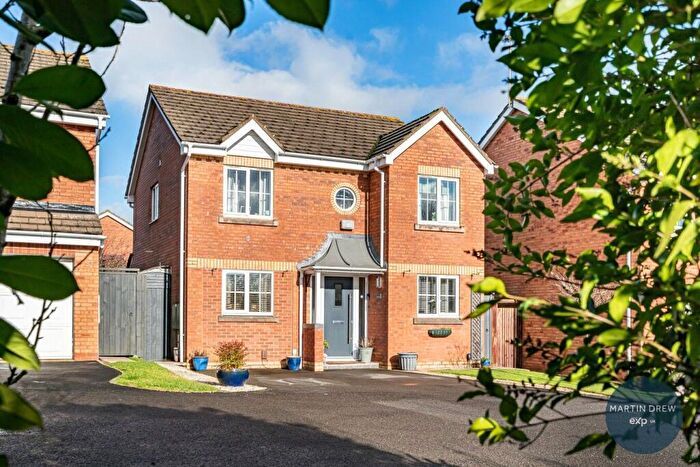
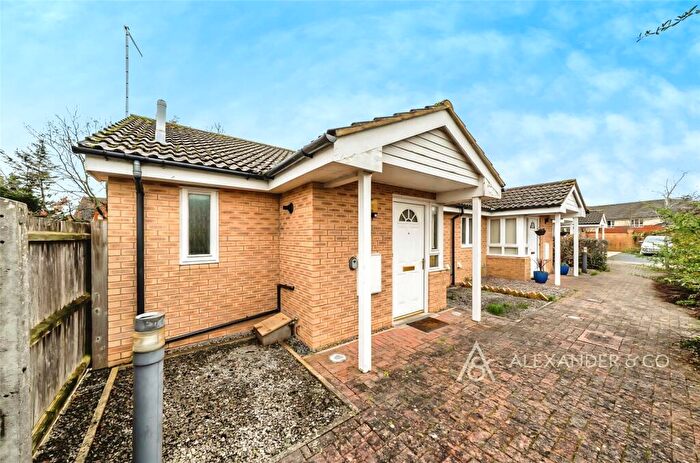
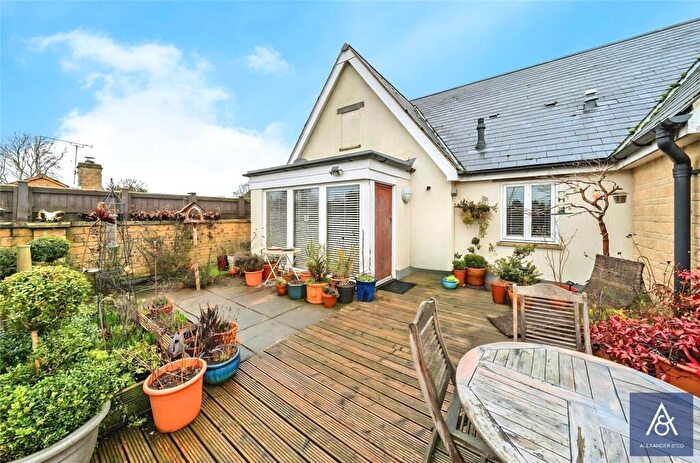
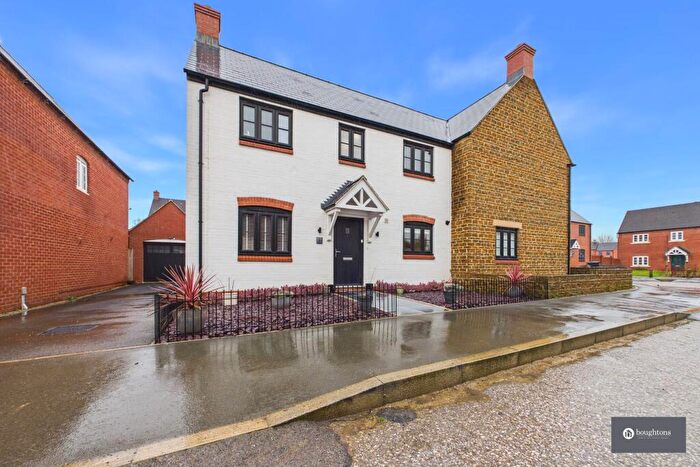
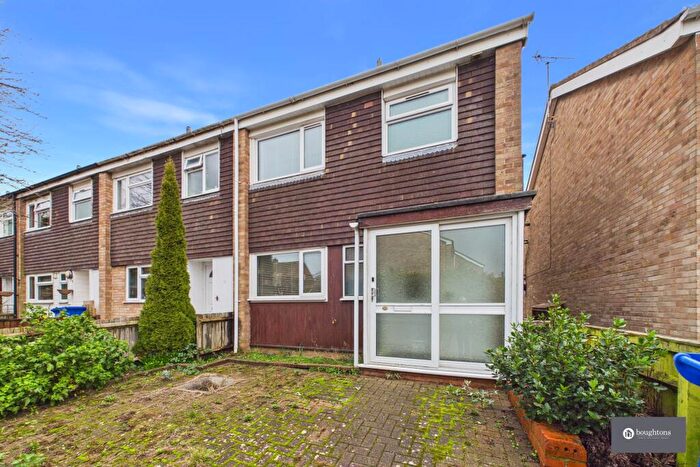
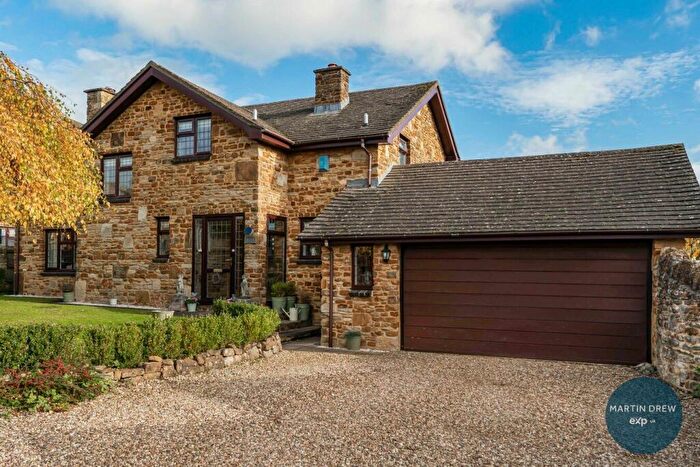
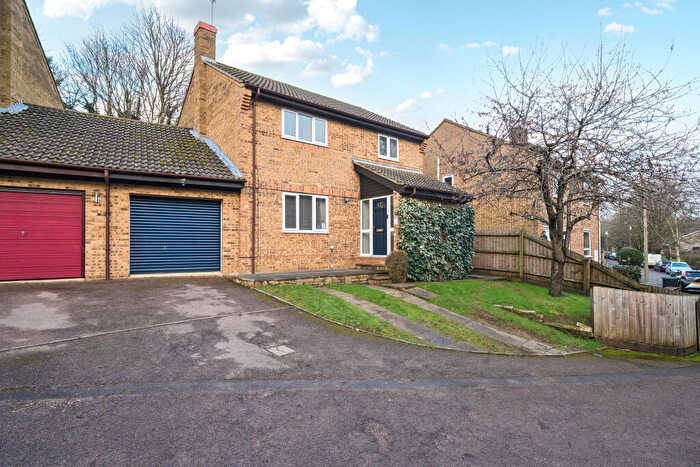
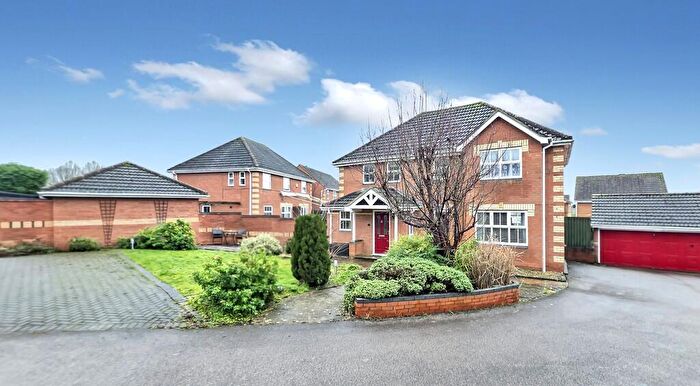
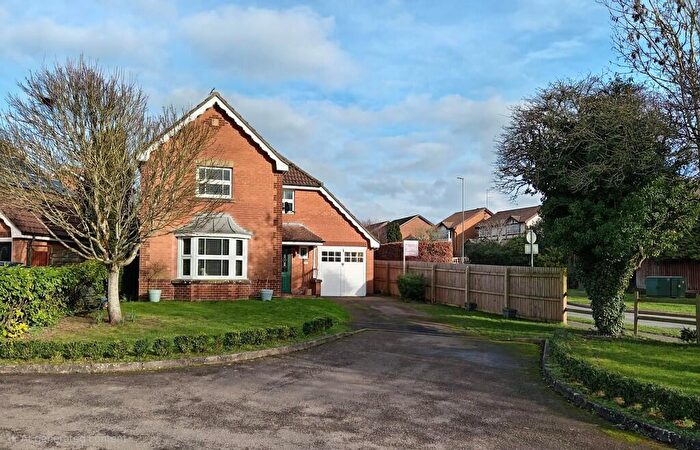
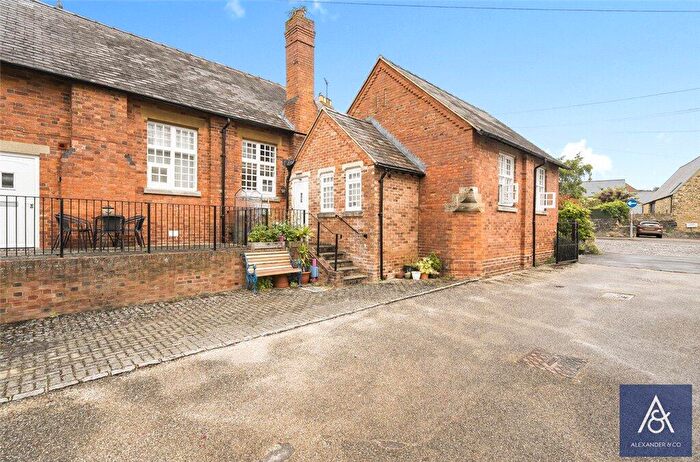
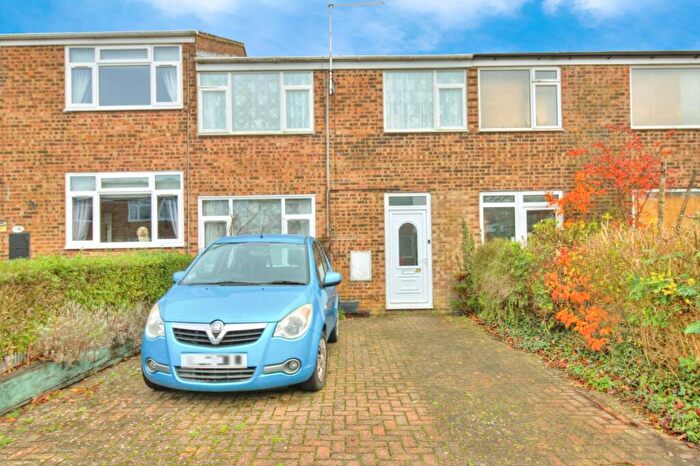
Properties in Little Brook have an average house price of £556,638.00 and had 47 Property Transactions within the last 3 years¹.
Little Brook is an area in Brackley, Northamptonshire with 630 households², where the most expensive property was sold for £2,000,000.00.
Properties for sale in Little Brook
Roads and Postcodes in Little Brook
Navigate through our locations to find the location of your next house in Little Brook, Brackley for sale or to rent.
| Streets | Postcodes |
|---|---|
| Andrews Avenue | NN13 5XL |
| Barksdale Avenue | NN13 5XB |
| Bicester Hill | NN13 5SD |
| Blenheim | NN13 5LP |
| Boughton Terrace | NN13 5SE |
| Brackley Road | NN13 5PP |
| Broad Lane | NN13 5SF |
| Chapel Lane | NN13 5LR |
| Charlton Road | NN13 5GH NN13 5LJ NN13 5XZ |
| Church End | NN13 5NW |
| Church Lane | NN13 5LS NN13 5SG |
| Church Leys | NN13 5SX |
| Fifth Avenue | NN13 5XN |
| Fifth Street | NN13 5XQ |
| Fifth Street East | NN13 5XR |
| Fourth Avenue | NN13 5XF |
| Fourth Street | NN13 5XE |
| High Street | NN13 5LT |
| Lawyers Close | NN13 5SJ |
| Manor Farm Cottages | NN13 5LD |
| Mill Lane | NN13 5LU |
| Mixbury Road | NN13 5SL |
| Oxford Road | NN13 5RU NN13 5RX |
| Park End | NN13 5LX NN13 5RD |
| Portway | NN13 5LY |
| Portway Crescent | NN13 5LZ |
| Portway Drive | NN13 5NA |
| Raf Croughton | NN13 5NQ NN13 5XP |
| Reynard Park | NN13 7RP |
| Rudgeway | NN13 5RQ |
| School Lane | NN13 5RY |
| Second Street | NN13 5XA |
| Sixth Street | NN13 5XJ |
| Spencer Close | NN13 5WA |
| The Green | NN13 5SH NN13 5SQ |
| Third Street | NN13 5XD |
| Townend Close | NN13 5FR |
| Wheelers Rise | NN13 5ND |
| Yew Tree Rise | NN13 5UW |
| NN13 5LL NN13 5SA NN13 5SB NN13 5GR NN13 5LN NN13 5LQ NN13 5LW NN13 5RZ NN13 5SU |
Transport near Little Brook
-
King's Sutton Station
-
Bicester North Station
-
Banbury Station
-
Heyford Station
-
Bicester Village Station
-
Tackley Station
- FAQ
- Price Paid By Year
- Property Type Price
Frequently asked questions about Little Brook
What is the average price for a property for sale in Little Brook?
The average price for a property for sale in Little Brook is £556,638. This amount is 48% higher than the average price in Brackley. There are 563 property listings for sale in Little Brook.
What streets have the most expensive properties for sale in Little Brook?
The streets with the most expensive properties for sale in Little Brook are Church Lane at an average of £949,250, Broad Lane at an average of £730,000 and High Street at an average of £680,777.
What streets have the most affordable properties for sale in Little Brook?
The streets with the most affordable properties for sale in Little Brook are Brackley Road at an average of £174,000, School Lane at an average of £255,833 and The Green at an average of £339,000.
Which train stations are available in or near Little Brook?
Some of the train stations available in or near Little Brook are King's Sutton, Bicester North and Banbury.
Property Price Paid in Little Brook by Year
The average sold property price by year was:
| Year | Average Sold Price | Price Change |
Sold Properties
|
|---|---|---|---|
| 2025 | £531,406 | -11% |
16 Properties |
| 2024 | £591,045 | 6% |
11 Properties |
| 2023 | £557,900 | 21% |
20 Properties |
| 2022 | £441,166 | 1% |
15 Properties |
| 2021 | £436,656 | -2% |
24 Properties |
| 2020 | £444,961 | -4% |
13 Properties |
| 2019 | £463,134 | 17% |
25 Properties |
| 2018 | £384,656 | -19% |
8 Properties |
| 2017 | £456,666 | 9% |
18 Properties |
| 2016 | £414,847 | 5% |
19 Properties |
| 2015 | £392,507 | 12% |
26 Properties |
| 2014 | £345,742 | 17% |
15 Properties |
| 2013 | £288,222 | 1% |
25 Properties |
| 2012 | £286,218 | -50% |
16 Properties |
| 2011 | £429,493 | 25% |
23 Properties |
| 2010 | £320,096 | 23% |
12 Properties |
| 2009 | £245,571 | -44% |
14 Properties |
| 2008 | £353,052 | -6% |
18 Properties |
| 2007 | £374,112 | 25% |
37 Properties |
| 2006 | £281,807 | -21% |
26 Properties |
| 2005 | £340,022 | 12% |
22 Properties |
| 2004 | £298,310 | 23% |
42 Properties |
| 2003 | £228,873 | -7% |
28 Properties |
| 2002 | £245,084 | 21% |
35 Properties |
| 2001 | £193,649 | -10% |
30 Properties |
| 2000 | £212,109 | 25% |
27 Properties |
| 1999 | £159,675 | 15% |
44 Properties |
| 1998 | £135,782 | 3% |
31 Properties |
| 1997 | £131,345 | 23% |
40 Properties |
| 1996 | £100,496 | -4% |
38 Properties |
| 1995 | £104,913 | - |
30 Properties |
Property Price per Property Type in Little Brook
Here you can find historic sold price data in order to help with your property search.
The average Property Paid Price for specific property types in the last three years are:
| Property Type | Average Sold Price | Sold Properties |
|---|---|---|
| Semi Detached House | £374,727.00 | 11 Semi Detached Houses |
| Detached House | £712,230.00 | 26 Detached Houses |
| Terraced House | £352,200.00 | 10 Terraced Houses |

