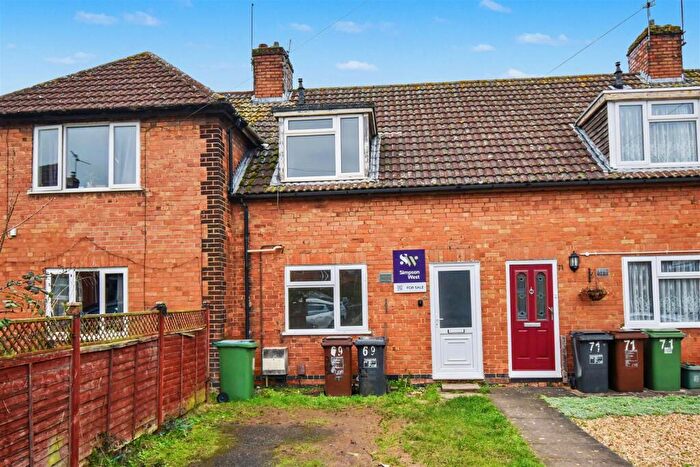
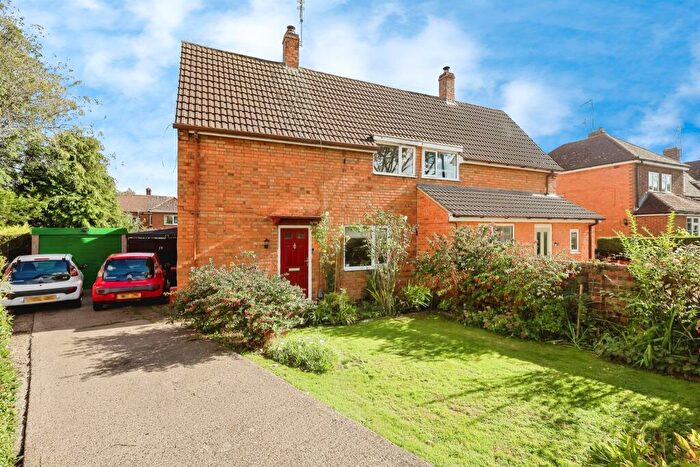
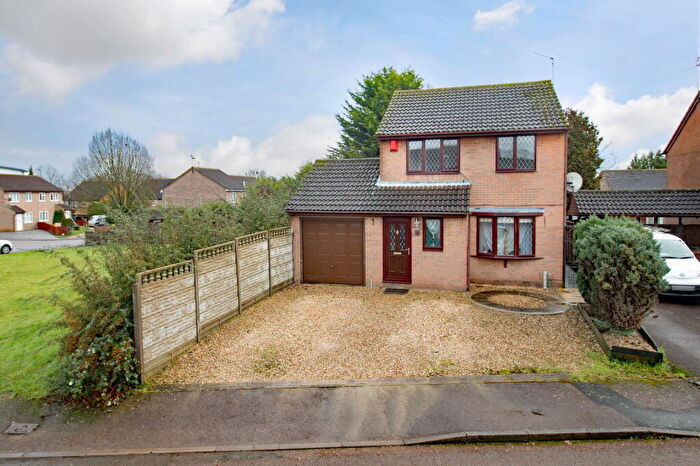
Houses for sale & to rent in East, Corby
House Prices in East
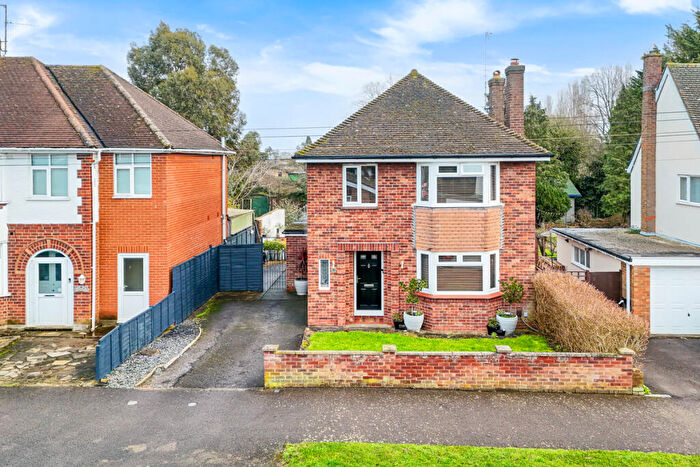
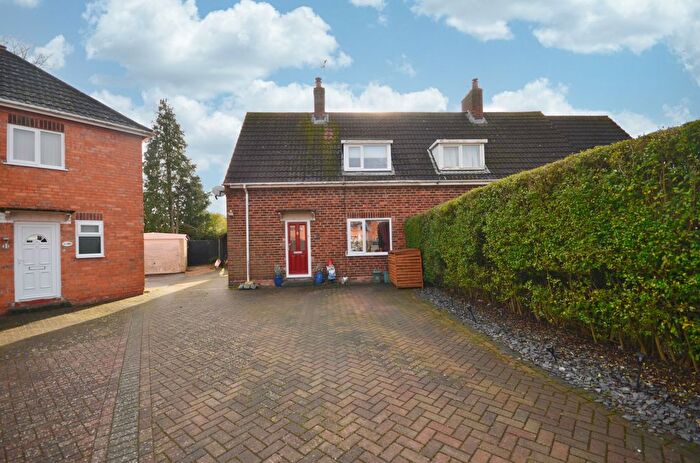
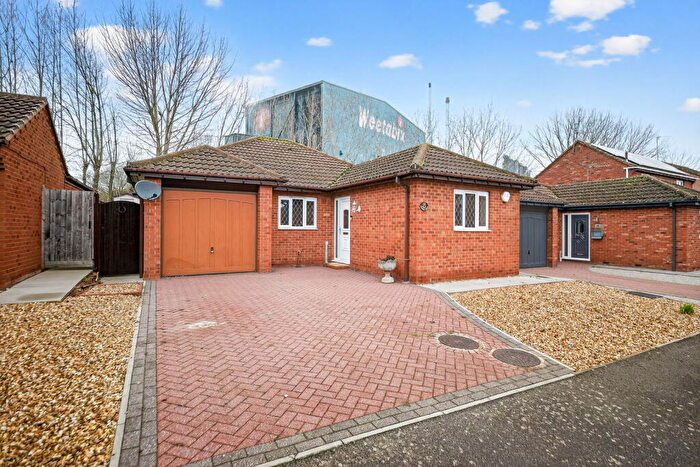
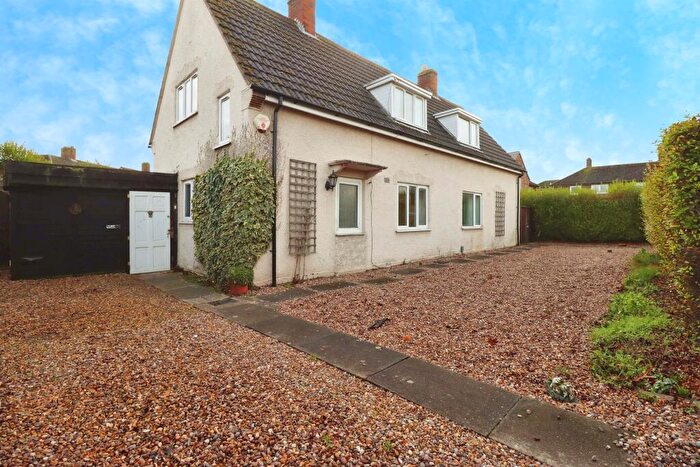
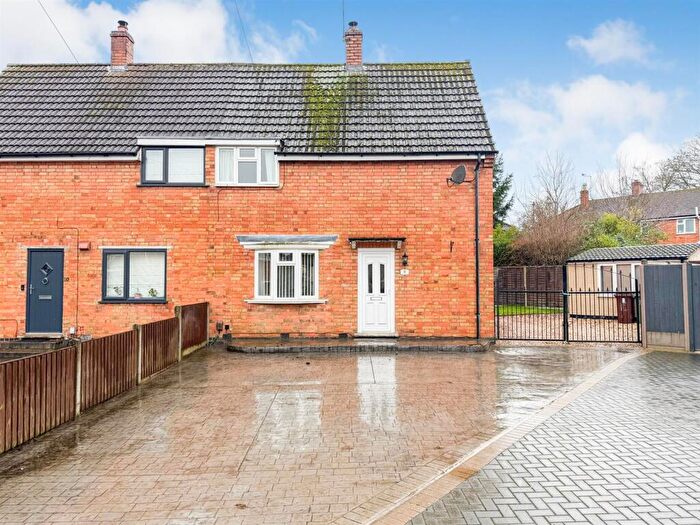
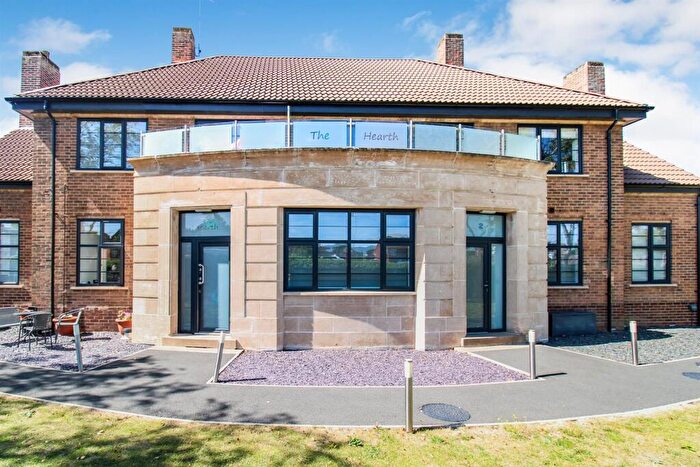
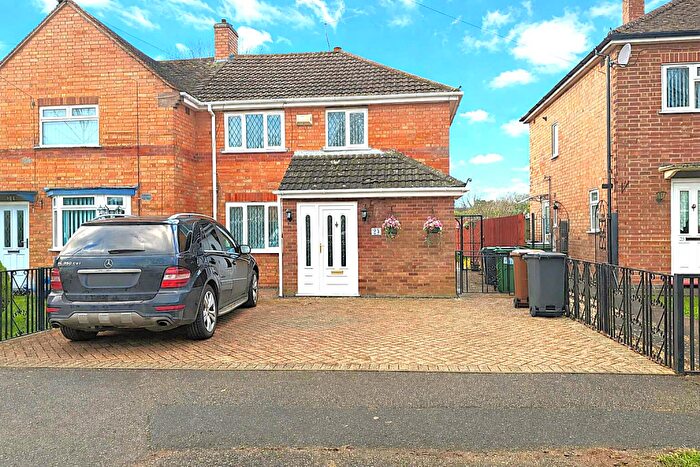
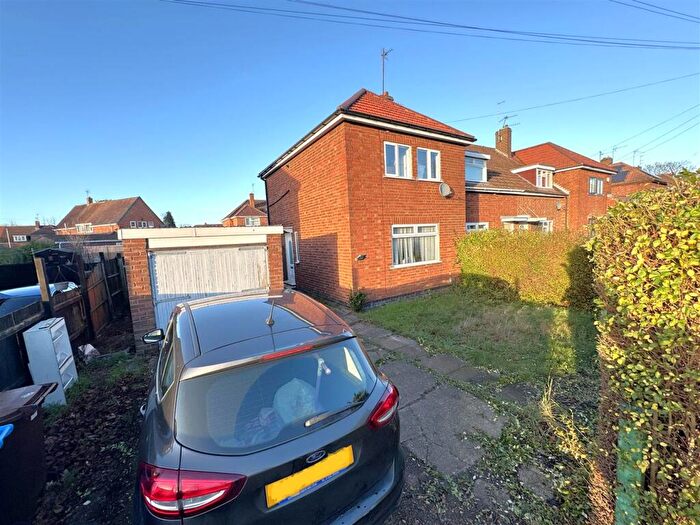
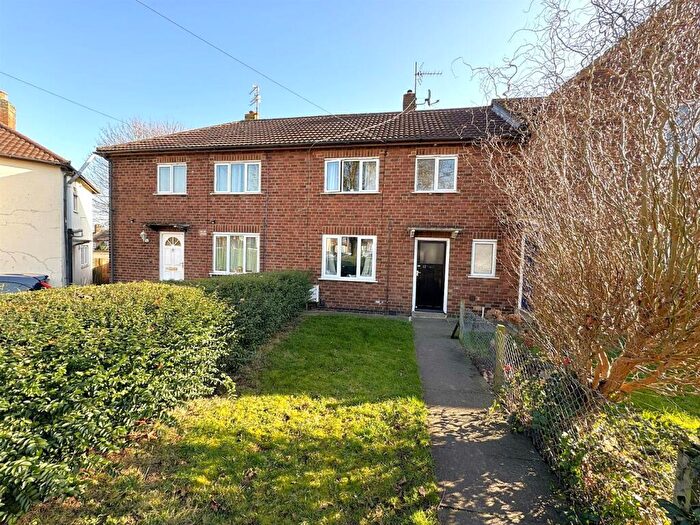
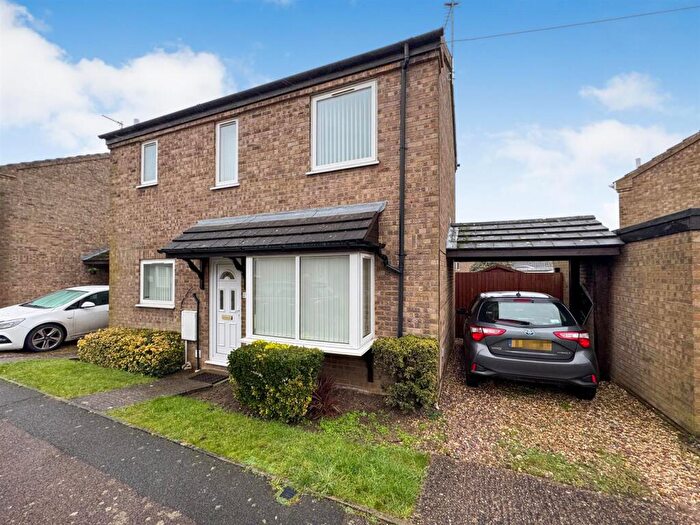
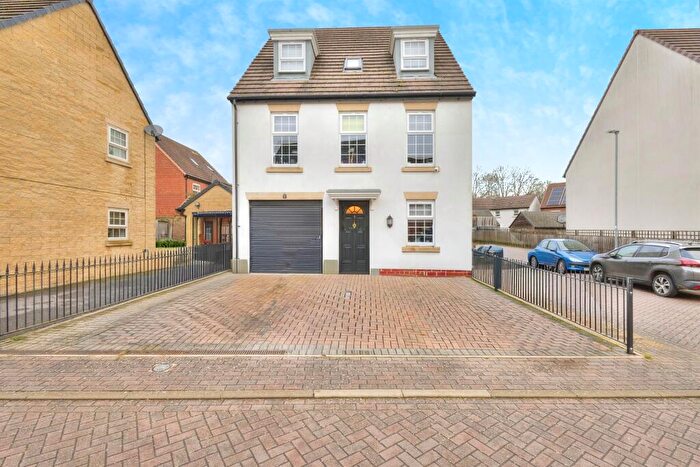
Properties in East have an average house price of £196,188.00 and had 211 Property Transactions within the last 3 years¹.
East is an area in Corby, Northamptonshire with 2,775 households², where the most expensive property was sold for £370,000.00.
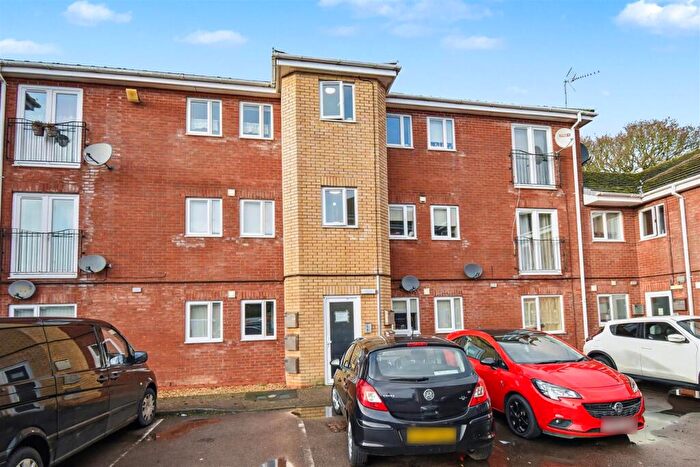
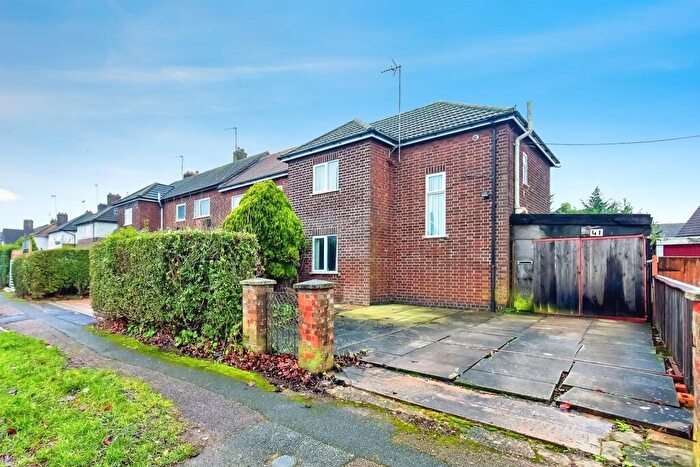
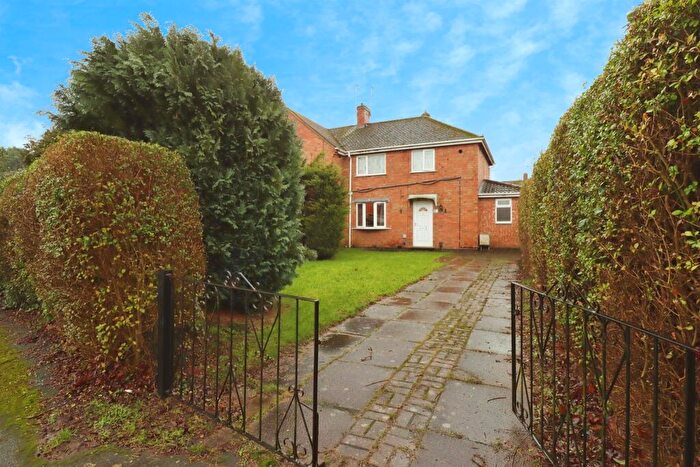
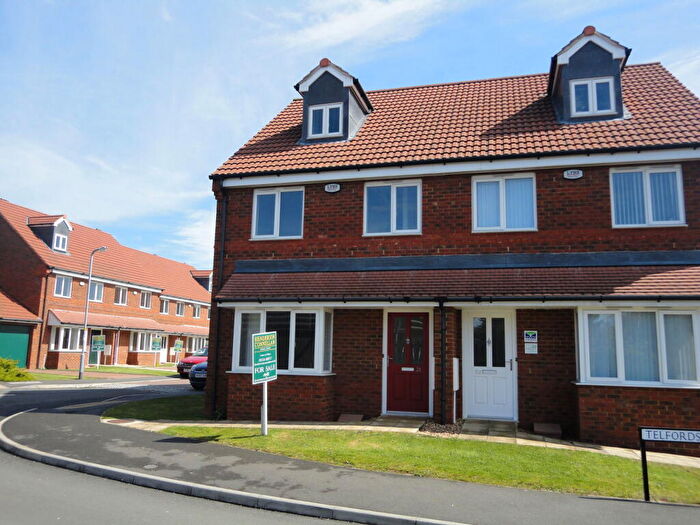
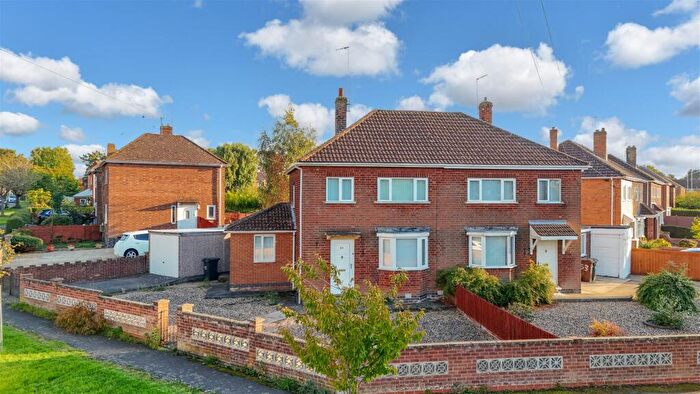
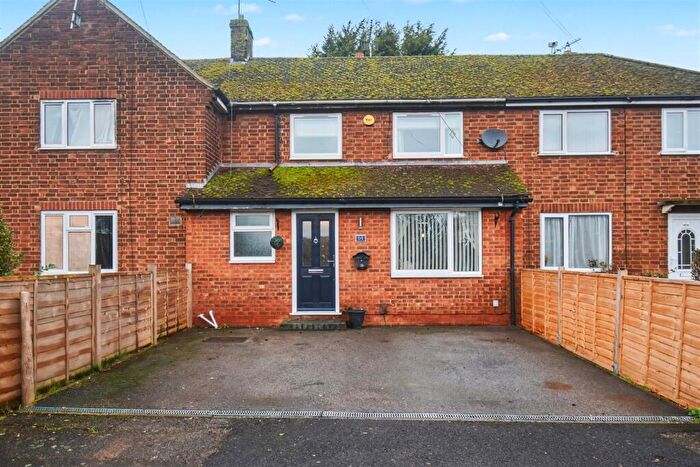
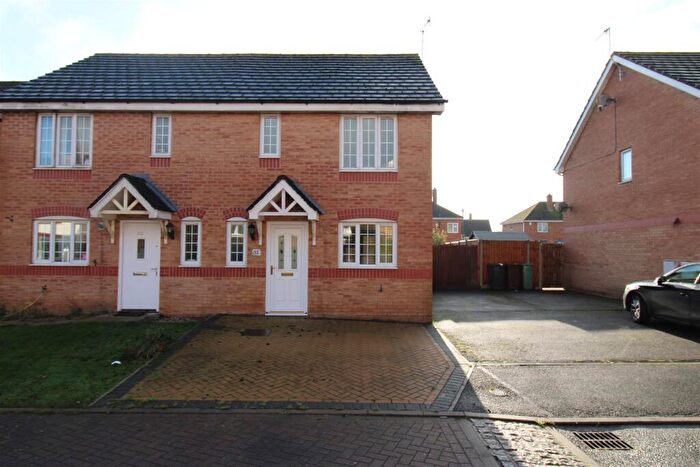
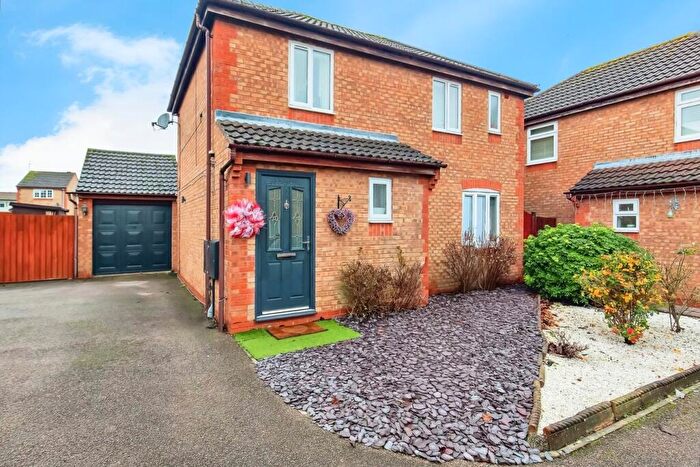
Properties for sale in East
Roads and Postcodes in East
Navigate through our locations to find the location of your next house in East, Corby for sale or to rent.
| Streets | Postcodes |
|---|---|
| Annandale Road | NN17 1EU |
| Ashdown Place | NN17 1FH |
| Borrowdale Road | NN17 2DQ |
| Cannock Road | NN17 1BS NN17 1YQ |
| Chapman Grove | NN17 1HL |
| Charnwood Road | NN17 1XS NN17 1YR |
| Clydesdale Road | NN17 2DW |
| Crick Close | NN17 1XQ |
| Dale Street | NN17 2BQ |
| Deene Close | NN17 1HY |
| Dovedale Road | NN17 1LP |
| Driffield Grove | NN17 1HA |
| East Glebe Close | NN17 1FF |
| Faraday Grove | NN17 1BP |
| Fineshade Grove | NN17 1HR |
| Franklin Fields | NN17 1DJ |
| Gilchrist Avenue | NN17 1BA |
| Grays Close | NN17 1JY |
| Hazelwood Road | NN17 1HS |
| Highfield Grove | NN17 1EW |
| Hubble Road | NN17 1JD |
| James Watt Avenue | NN17 1BT NN17 1BU NN17 1BX |
| Kelvin Grove | NN17 1AZ |
| Langdale Grove | NN17 2DG |
| Lister Close | NN17 1XR |
| Lodge Green Road | NN17 1HP NN17 1HW |
| Nasmith Avenue | NN17 1DR |
| Netherfield Grove | NN17 1EP |
| Newton Grove | NN17 1DP |
| Nithsdale Road | NN17 1LR |
| Occupation Road | NN17 1EB NN17 1ED NN17 1EE NN17 1EF NN17 1EG NN17 1FB |
| Ollis Close | NN17 1HX |
| Parsons Grove | NN17 1DS |
| Pen Green Lane | NN17 1BJ NN17 1BL NN17 1BN NN17 1BW |
| Regal Close | NN17 1EZ |
| Rockingham Mews | NN17 1BB |
| Rockingham Road | NN17 1AD NN17 1AE NN17 1AG NN17 1AH NN17 1AJ NN17 1AQ NN17 1JW |
| Royce Close | NN17 1YL |
| Rutherglen Road | NN17 1ER |
| Samuel Place | NN17 1BQ |
| Sarrington Road | NN17 1JZ |
| Shrubfield Grove | NN17 1HD |
| Spinney Grove | NN17 1HT |
| Springfield Grove | NN17 1EN |
| Stanier Road | NN17 1XP |
| Stephenson Way | NN17 1DA NN17 1DB NN17 1DD NN17 1DE NN17 1DF NN17 1DG NN17 1DH NN17 1DQ |
| Stockwood Drive | NN17 1JL |
| Streather Drive | NN17 1TN |
| Studfall Avenue | NN17 1LB NN17 1LG NN17 1LH NN17 1LJ NN17 1LQ |
| Tanfields Grove | NN17 1HH NN17 1HJ |
| Teesdale Road | NN17 1LN NN17 1LW |
| Telfords Close | NN17 1BF |
| Telfords Lane | NN17 1BY |
| The Octagon | NN17 1DW |
| Thoroughsale Road | NN17 1HZ NN17 1JA NN17 1JB |
| Upperfield Grove | NN17 1HN |
| West Glebe Road | NN17 1EJ NN17 1EL |
| Westfields Road | NN17 1HE NN17 1HF NN17 1HG NN17 1HQ |
| Whitworth Avenue | NN17 1DL NN17 1DN |
| Willetts Close | NN17 1HU |
| Woodfield Grove | NN17 1ES |
| Woodlands Avenue | NN17 1JH |
Transport near East
- FAQ
- Price Paid By Year
- Property Type Price
Frequently asked questions about East
What is the average price for a property for sale in East?
The average price for a property for sale in East is £196,188. This amount is 18% lower than the average price in Corby. There are 482 property listings for sale in East.
What streets have the most expensive properties for sale in East?
The streets with the most expensive properties for sale in East are Crick Close at an average of £329,666, Hubble Road at an average of £311,250 and Lister Close at an average of £286,500.
What streets have the most affordable properties for sale in East?
The streets with the most affordable properties for sale in East are Ashdown Place at an average of £73,333, Rockingham Mews at an average of £103,928 and Langdale Grove at an average of £115,294.
Which train stations are available in or near East?
Some of the train stations available in or near East are Corby, Kettering and Market Harborough.
Property Price Paid in East by Year
The average sold property price by year was:
| Year | Average Sold Price | Price Change |
Sold Properties
|
|---|---|---|---|
| 2025 | £195,683 | -0,1% |
53 Properties |
| 2024 | £195,797 | -1% |
78 Properties |
| 2023 | £196,904 | -3% |
80 Properties |
| 2022 | £203,458 | 14% |
95 Properties |
| 2021 | £175,058 | 0,5% |
103 Properties |
| 2020 | £174,211 | 10% |
75 Properties |
| 2019 | £156,883 | 0,1% |
115 Properties |
| 2018 | £156,702 | 11% |
108 Properties |
| 2017 | £140,122 | 8% |
107 Properties |
| 2016 | £128,569 | 9% |
112 Properties |
| 2015 | £116,740 | -3% |
95 Properties |
| 2014 | £120,414 | -2% |
117 Properties |
| 2013 | £122,267 | 15% |
101 Properties |
| 2012 | £103,349 | 5% |
59 Properties |
| 2011 | £98,184 | 0,4% |
50 Properties |
| 2010 | £97,814 | -8% |
46 Properties |
| 2009 | £105,517 | -5% |
38 Properties |
| 2008 | £110,641 | -6% |
111 Properties |
| 2007 | £117,711 | 18% |
151 Properties |
| 2006 | £97,074 | -1% |
214 Properties |
| 2005 | £97,882 | 15% |
126 Properties |
| 2004 | £82,803 | 13% |
158 Properties |
| 2003 | £72,450 | 19% |
161 Properties |
| 2002 | £58,500 | 17% |
158 Properties |
| 2001 | £48,364 | 6% |
129 Properties |
| 2000 | £45,546 | 5% |
146 Properties |
| 1999 | £43,083 | 13% |
131 Properties |
| 1998 | £37,285 | 4% |
96 Properties |
| 1997 | £35,789 | -1% |
116 Properties |
| 1996 | £36,218 | 7% |
75 Properties |
| 1995 | £33,540 | - |
70 Properties |
Property Price per Property Type in East
Here you can find historic sold price data in order to help with your property search.
The average Property Paid Price for specific property types in the last three years are:
| Property Type | Average Sold Price | Sold Properties |
|---|---|---|
| Semi Detached House | £202,477.00 | 96 Semi Detached Houses |
| Detached House | £288,157.00 | 19 Detached Houses |
| Terraced House | £191,888.00 | 72 Terraced Houses |
| Flat | £111,128.00 | 24 Flats |

