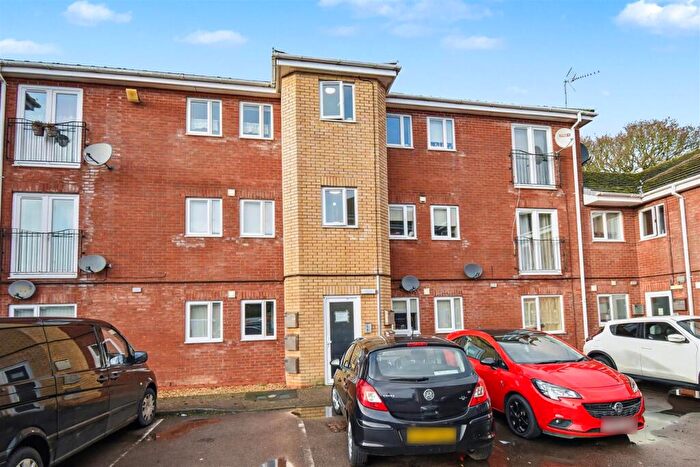
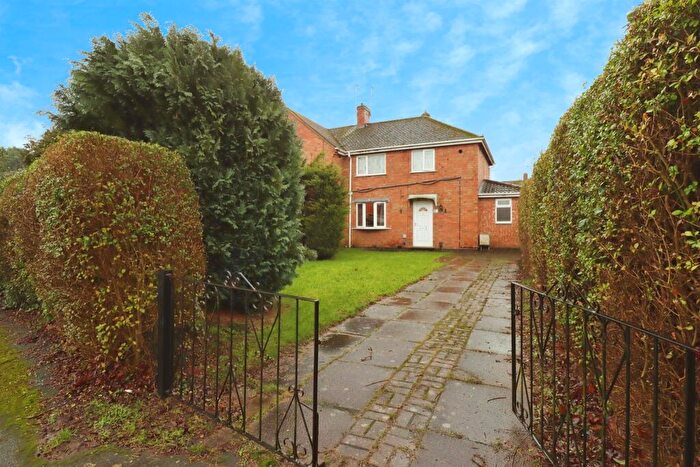
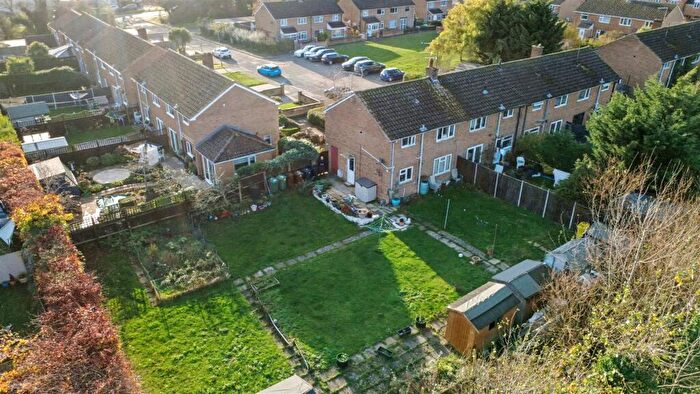
Houses for sale & to rent in Rowlett, Corby
House Prices in Rowlett
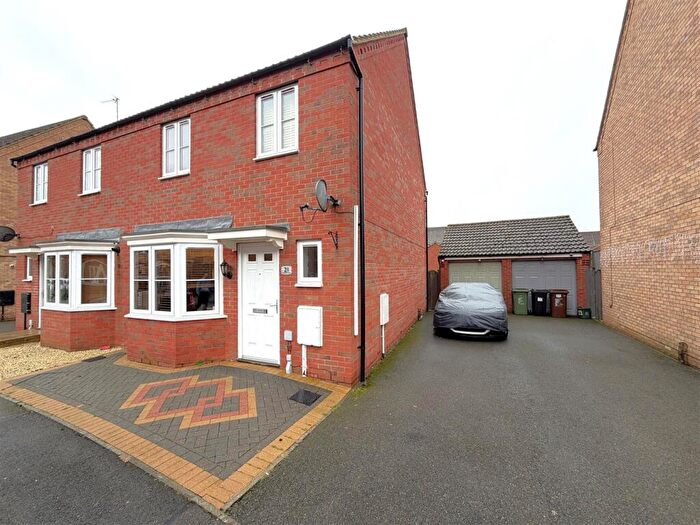
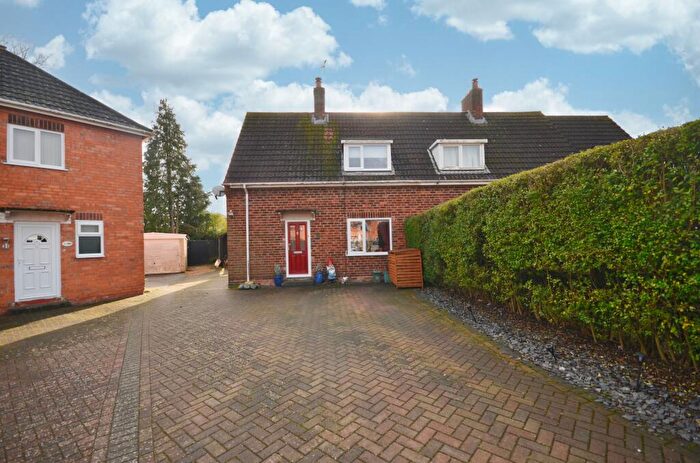
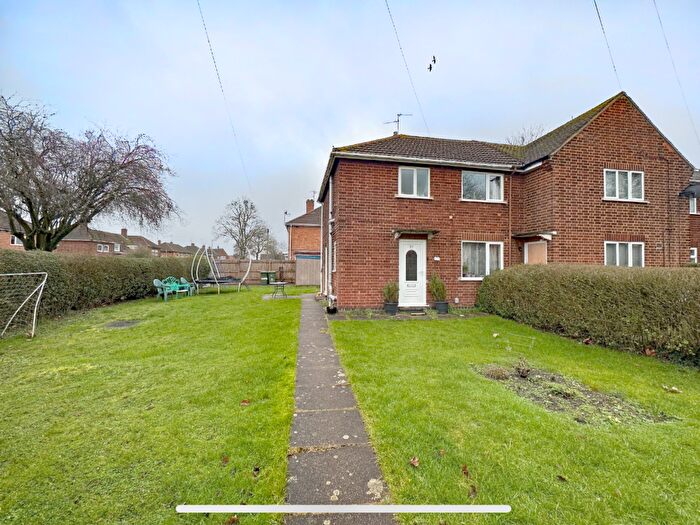
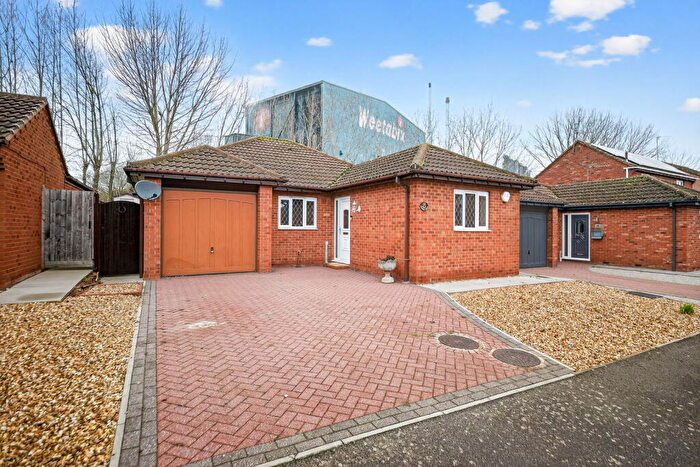
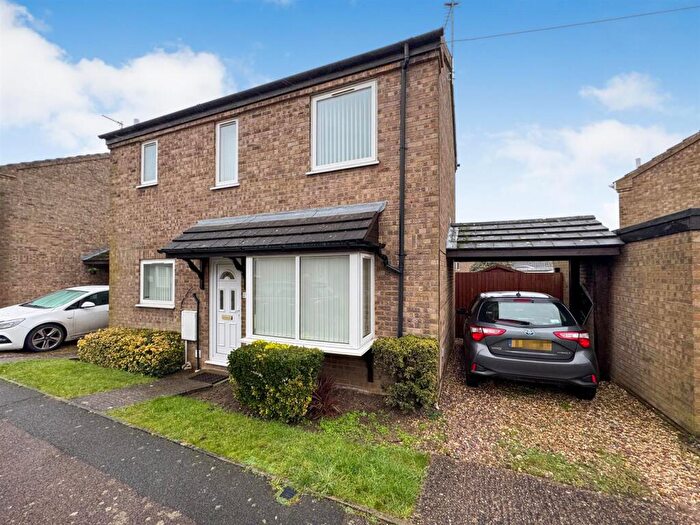
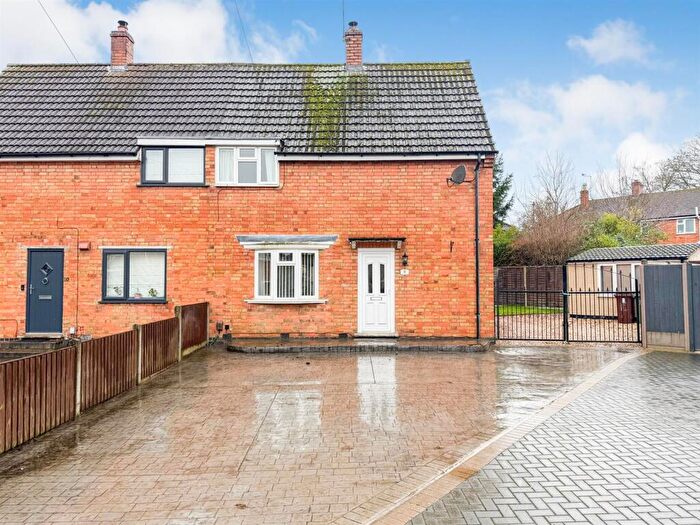
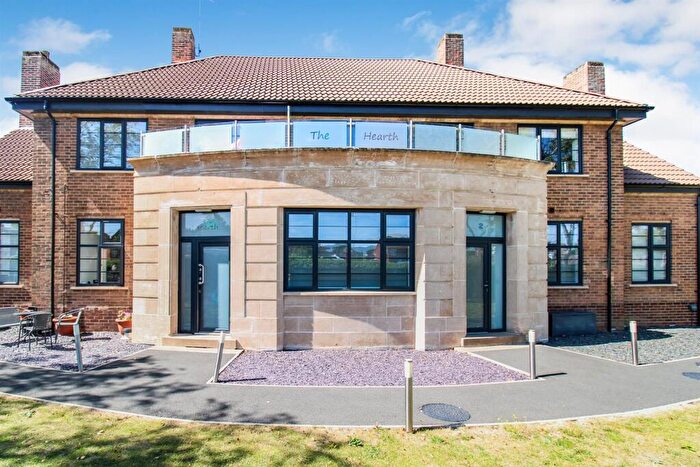
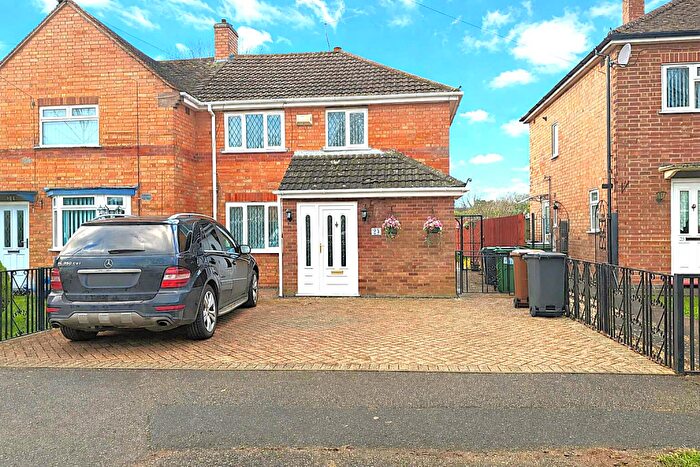
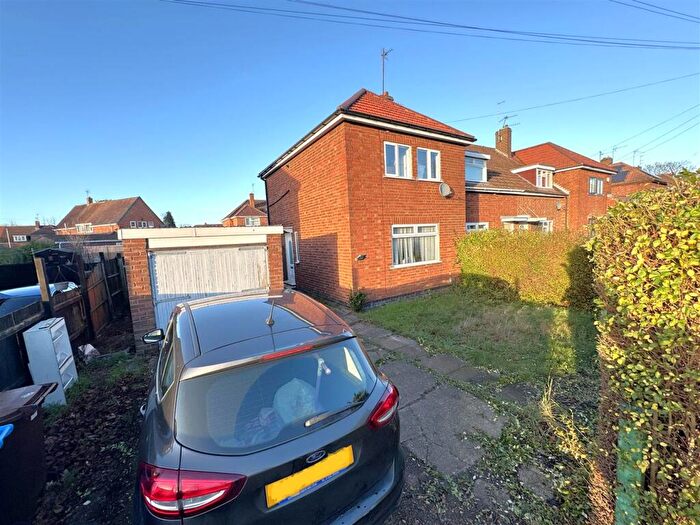
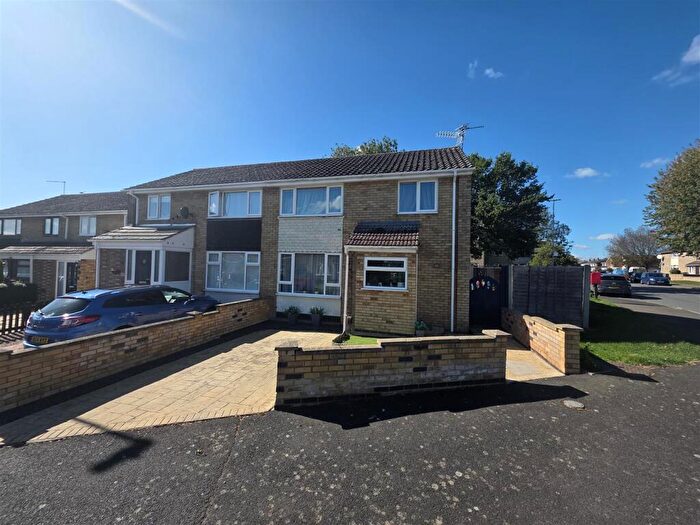
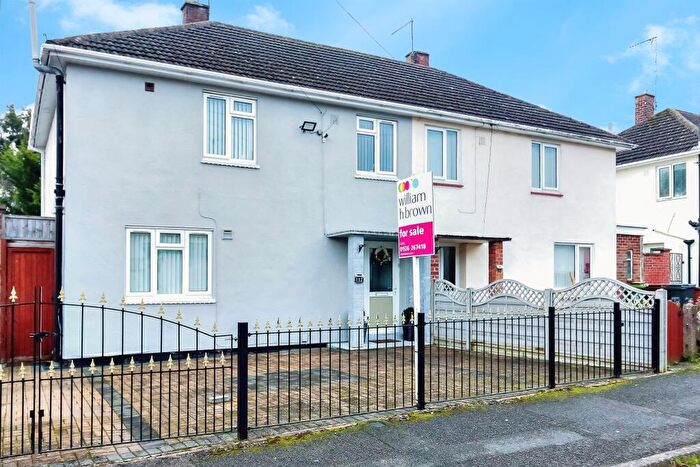
Properties in Rowlett have an average house price of £203,323.00 and had 141 Property Transactions within the last 3 years¹.
Rowlett is an area in Corby, Northamptonshire with 2,036 households², where the most expensive property was sold for £350,000.00.
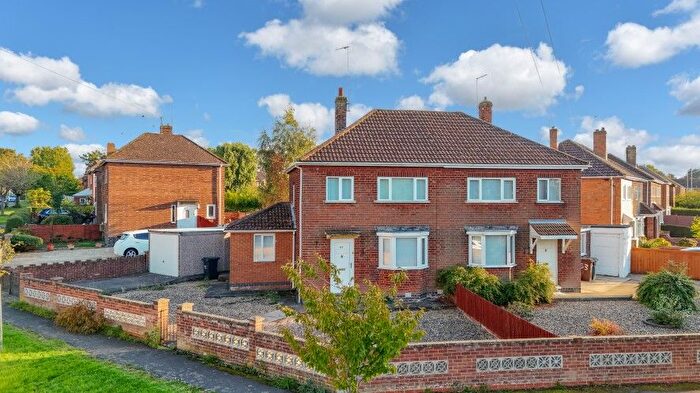
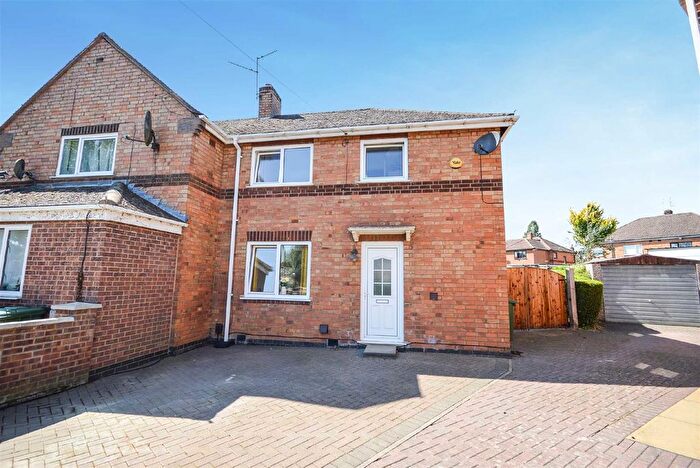
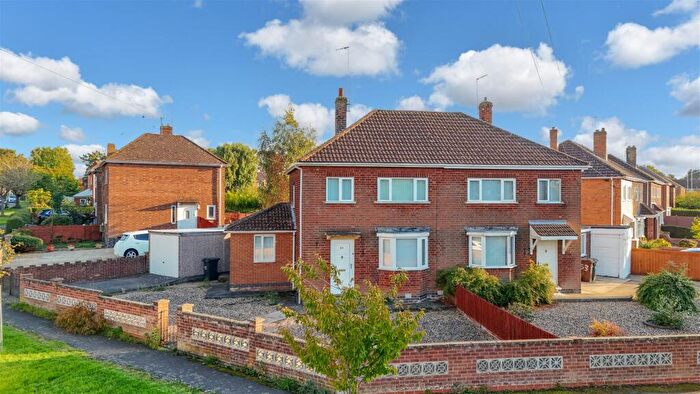
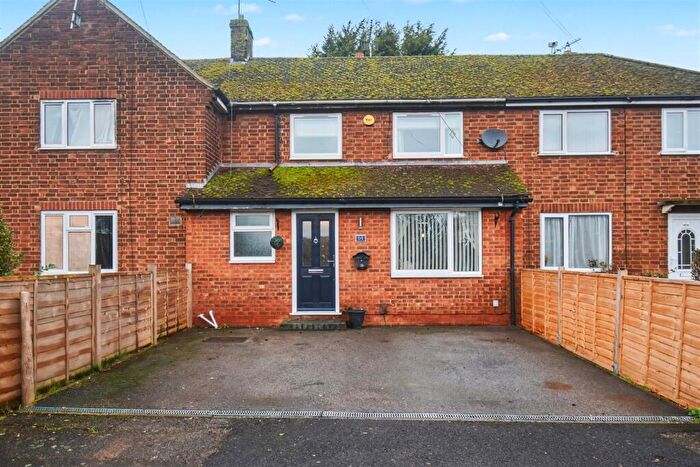
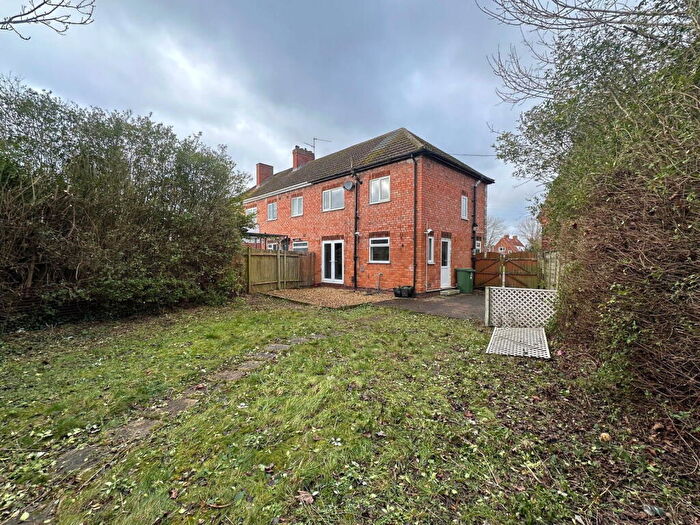
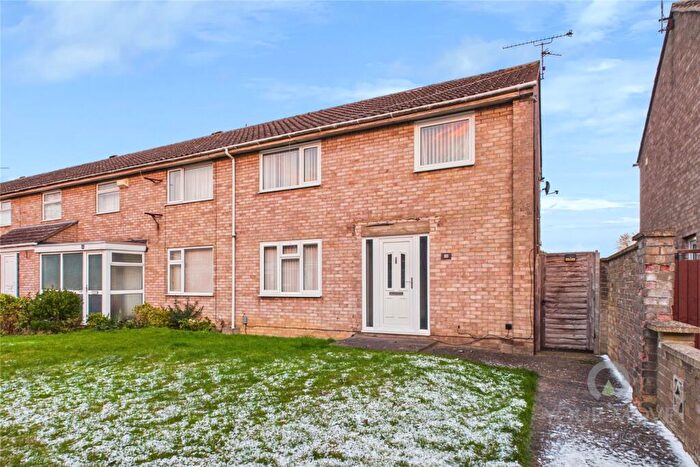
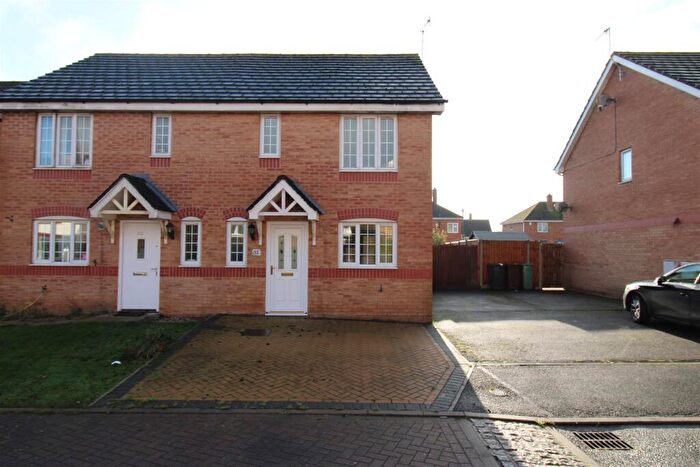
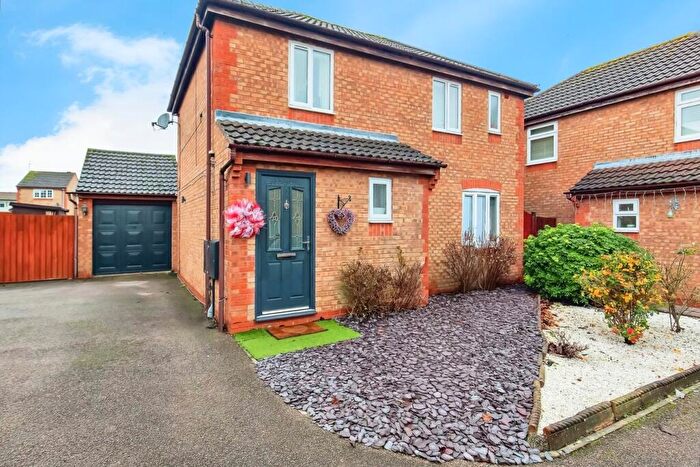
Properties for sale in Rowlett
Roads and Postcodes in Rowlett
Navigate through our locations to find the location of your next house in Rowlett, Corby for sale or to rent.
| Streets | Postcodes |
|---|---|
| Beech Close | NN17 2AF |
| Brookes Grove | NN17 2AQ |
| Browning Walk | NN17 2NF |
| Brunel Court | NN17 4UB |
| Brunel Road | NN17 4SL NN17 4UX |
| Burns Drive | NN17 2NN NN17 2NP |
| Byron Road | NN17 2NE |
| Carey Drive | NN17 2DH |
| Causeway Road | NN17 4DU |
| Cedar Court | NN17 2EY |
| Chaucer Close | NN17 2BF |
| Chestnut Avenue | NN17 2ER |
| Clarke Road | NN17 2BG |
| Clifton Square | NN17 2DB |
| Coleridge Way | NN17 2NZ |
| Crawford Grove | NN17 2DD |
| Dalton Road | NN17 4AE |
| Dryden Way | NN17 2NX |
| Earlstrees Court | NN17 4AX |
| Earlstrees Road | NN17 4AW NN17 4AZ NN17 4NP |
| Edison Courtyard | NN17 4LS |
| Elm Walk | NN17 2UZ |
| Ennerdale Road | NN17 2EA NN17 2ES |
| Fleming Road | NN17 4SW |
| George Blackhall Court | NN17 2DP |
| Grizedale Close | NN17 2YJ |
| Hawthorn Walk | NN17 2UU |
| Irving Grove | NN17 2BL |
| John Clare Way | NN17 2NQ |
| Kingsley Drive | NN17 2NJ |
| Kipling Road | NN17 2DJ |
| Landor Close | NN17 2LU NN17 2LY |
| Larch Road | NN17 2UT |
| Latimer Road | NN17 2DA |
| Macadam Road | NN17 4JN |
| Manton Road | NN17 4JL |
| Maple Court | NN17 2EZ |
| Masefield Way | NN17 2NL |
| Milton Road | NN17 2NY |
| Moore Close | NN17 2NW |
| Pine Walk | NN17 2YA |
| Poplar Road | NN17 2UY |
| Rockingham Road | NN17 2AA NN17 2AB NN17 2AD |
| Rowan Court | NN17 2EX |
| Rowlett Road | NN17 2BP NN17 2BS NN17 2BT NN17 2BU NN17 2BW NN17 2BX NN17 2BY NN17 2BZ NN17 2BH |
| Rutherford Court | NN17 4SJ |
| Shakespeare Way | NN17 2NA NN17 2NB NN17 2ND |
| Sherwood Close | NN17 2YH |
| Studfall Avenue | NN17 1LA NN17 1LD NN17 1LE NN17 1LF |
| Sycamore Close | NN17 2YB |
| Tanfields Grove | NN17 2BN |
| The Brontes | NN17 2NH |
| Waltham Close | NN17 2YF NN17 2YG |
| Welland Vale Road | NN17 2AJ NN17 2AL NN17 2AN NN17 2AW |
| Wensleydale Park | NN17 2UE |
| Wharfedale Road | NN17 2AH |
| Willow Brook Road | NN17 2EB NN17 2ED NN17 2EE NN17 2EF NN17 2EG NN17 2EH NN17 2EJ NN17 2EQ |
| Wordsworth Avenue | NN17 2NG |
| Yardley Close | NN17 2YE |
| Yew Close | NN17 2YD |
| NN17 4LT |
Transport near Rowlett
- FAQ
- Price Paid By Year
- Property Type Price
Frequently asked questions about Rowlett
What is the average price for a property for sale in Rowlett?
The average price for a property for sale in Rowlett is £203,323. This amount is 15% lower than the average price in Corby. There are 434 property listings for sale in Rowlett.
What streets have the most expensive properties for sale in Rowlett?
The streets with the most expensive properties for sale in Rowlett are Yardley Close at an average of £274,000, Kingsley Drive at an average of £245,500 and Wensleydale Park at an average of £243,714.
What streets have the most affordable properties for sale in Rowlett?
The streets with the most affordable properties for sale in Rowlett are Hawthorn Walk at an average of £147,000, John Clare Way at an average of £158,333 and Carey Drive at an average of £163,333.
Which train stations are available in or near Rowlett?
Some of the train stations available in or near Rowlett are Corby, Kettering and Market Harborough.
Property Price Paid in Rowlett by Year
The average sold property price by year was:
| Year | Average Sold Price | Price Change |
Sold Properties
|
|---|---|---|---|
| 2025 | £210,044 | 4% |
36 Properties |
| 2024 | £200,992 | - |
57 Properties |
| 2023 | £201,052 | -6% |
48 Properties |
| 2022 | £212,879 | 17% |
66 Properties |
| 2021 | £177,715 | 9% |
65 Properties |
| 2020 | £161,997 | 5% |
50 Properties |
| 2019 | £153,491 | -2% |
69 Properties |
| 2018 | £156,881 | 8% |
86 Properties |
| 2017 | £144,310 | 8% |
51 Properties |
| 2016 | £133,030 | 12% |
69 Properties |
| 2015 | £116,440 | 5% |
78 Properties |
| 2014 | £110,414 | 1% |
67 Properties |
| 2013 | £109,816 | 7% |
30 Properties |
| 2012 | £102,049 | 8% |
43 Properties |
| 2011 | £93,629 | -9% |
24 Properties |
| 2010 | £101,855 | 0,1% |
37 Properties |
| 2009 | £101,734 | -19% |
27 Properties |
| 2008 | £121,157 | -1% |
41 Properties |
| 2007 | £122,457 | 18% |
90 Properties |
| 2006 | £99,994 | 4% |
99 Properties |
| 2005 | £95,639 | 4% |
85 Properties |
| 2004 | £91,520 | 8% |
101 Properties |
| 2003 | £84,007 | 30% |
127 Properties |
| 2002 | £58,486 | 21% |
80 Properties |
| 2001 | £46,337 | 10% |
84 Properties |
| 2000 | £41,480 | -13% |
72 Properties |
| 1999 | £47,037 | -1% |
80 Properties |
| 1998 | £47,374 | 20% |
59 Properties |
| 1997 | £37,797 | 3% |
72 Properties |
| 1996 | £36,816 | 7% |
84 Properties |
| 1995 | £34,089 | - |
45 Properties |
Property Price per Property Type in Rowlett
Here you can find historic sold price data in order to help with your property search.
The average Property Paid Price for specific property types in the last three years are:
| Property Type | Average Sold Price | Sold Properties |
|---|---|---|
| Semi Detached House | £204,601.00 | 73 Semi Detached Houses |
| Detached House | £274,000.00 | 18 Detached Houses |
| Terraced House | £182,531.00 | 41 Terraced Houses |
| Flat | £146,333.00 | 9 Flats |

