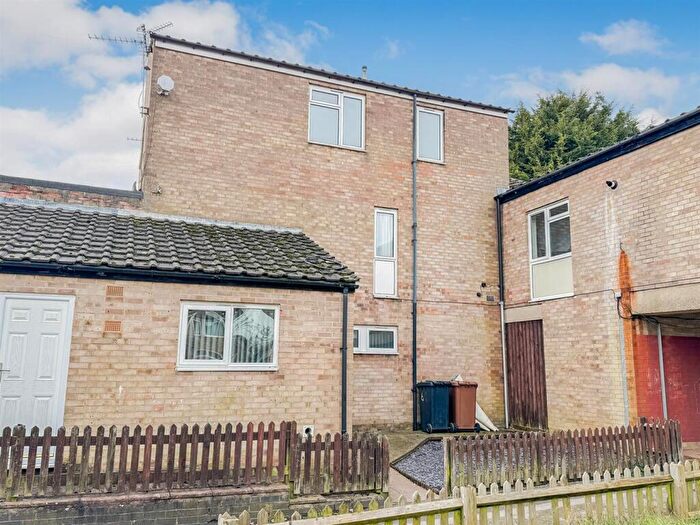
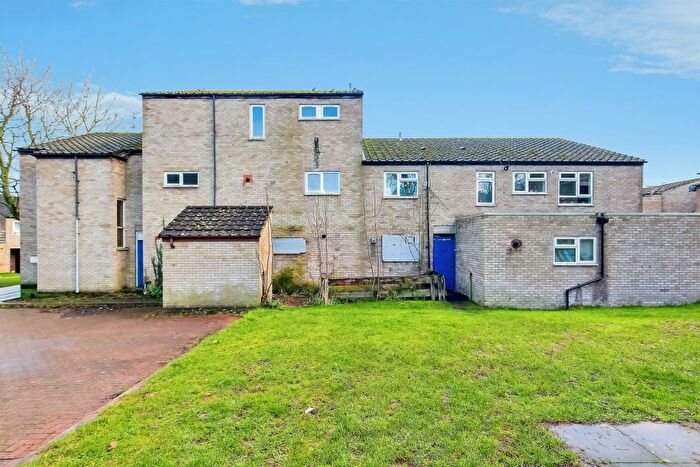
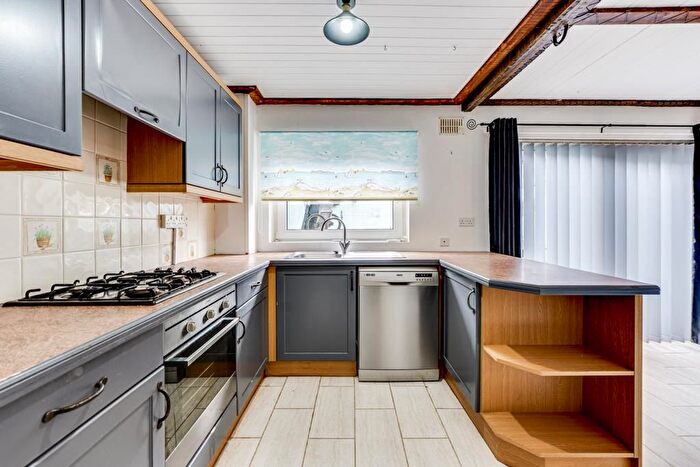
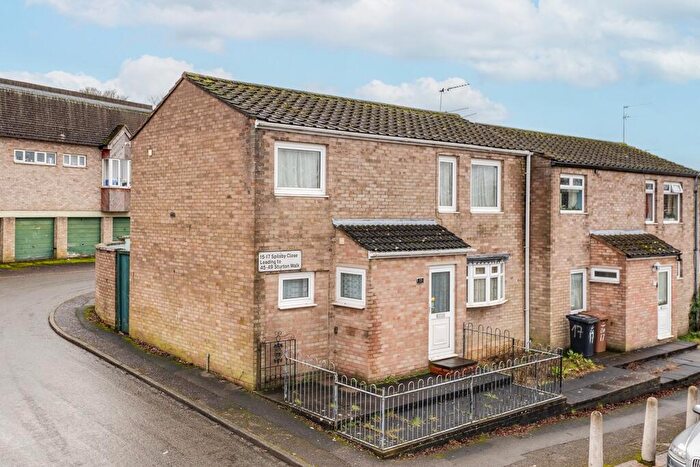
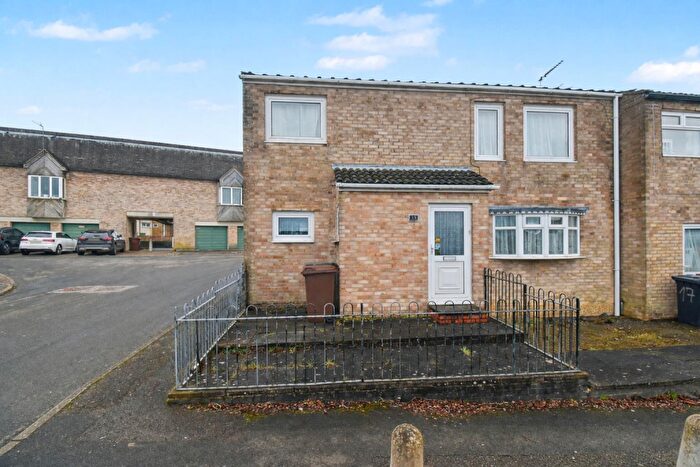
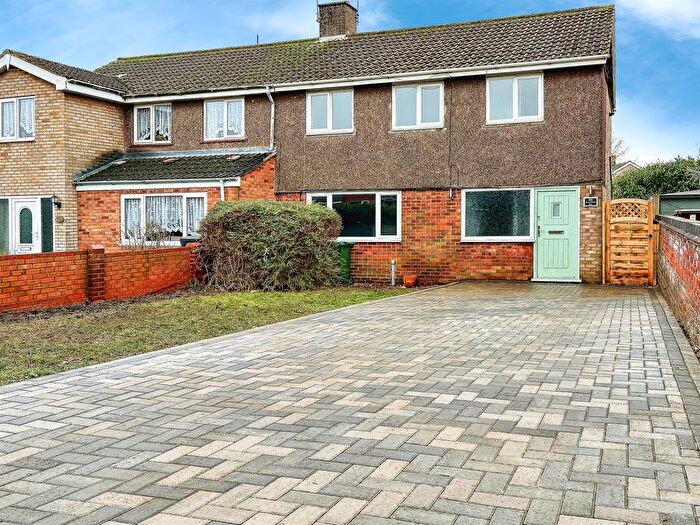
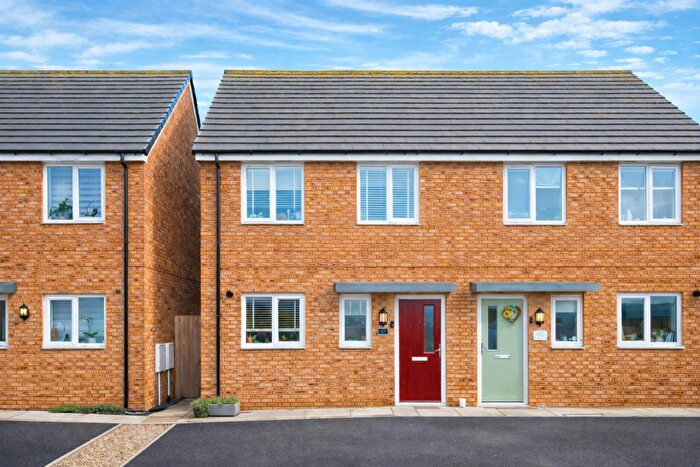
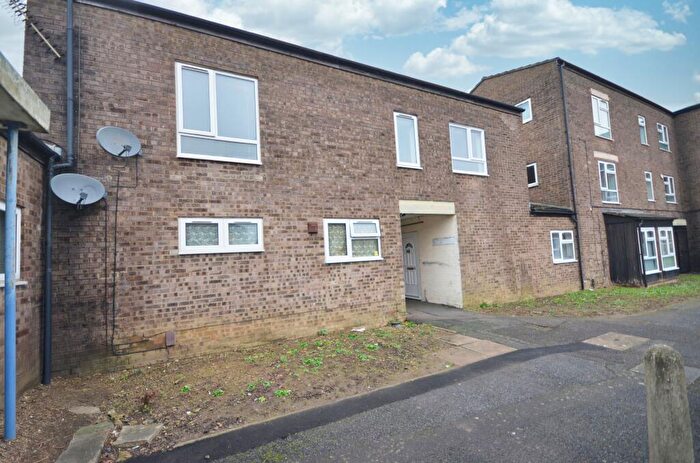
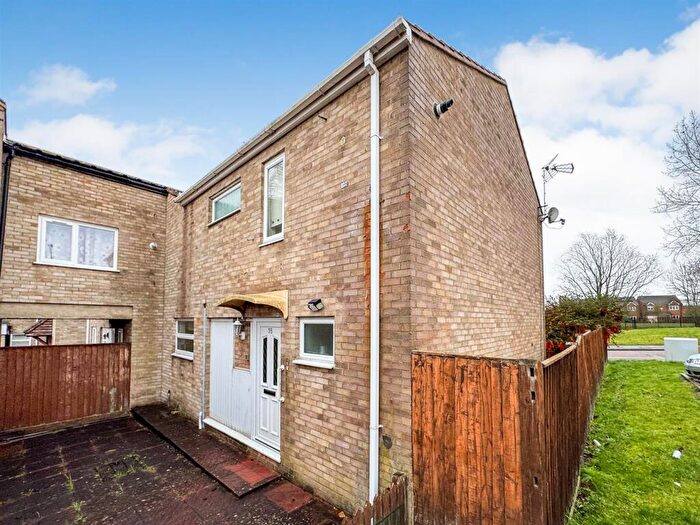
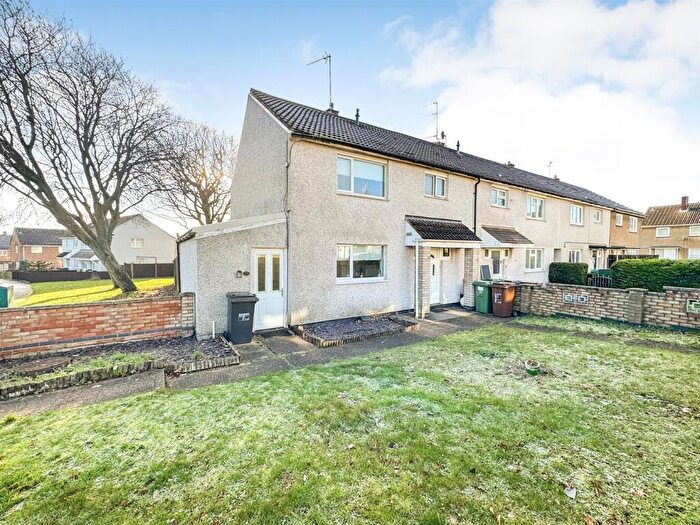
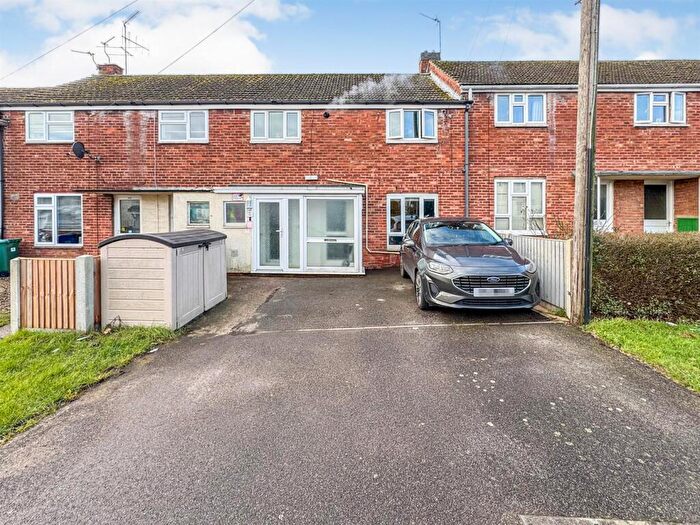
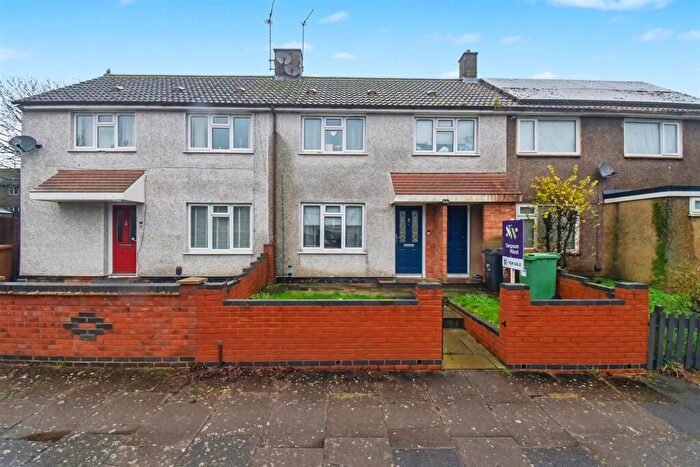
Houses for sale & to rent in Tower Hill, Corby
House Prices in Tower Hill
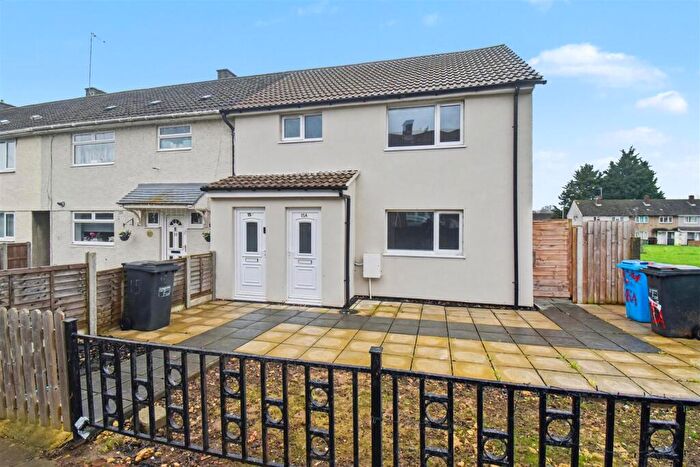
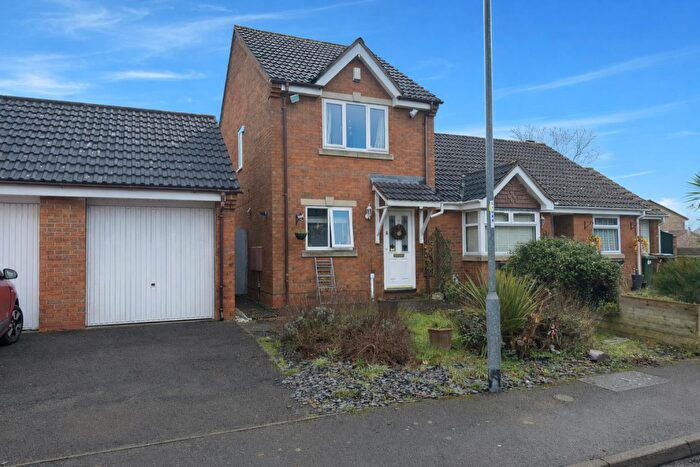
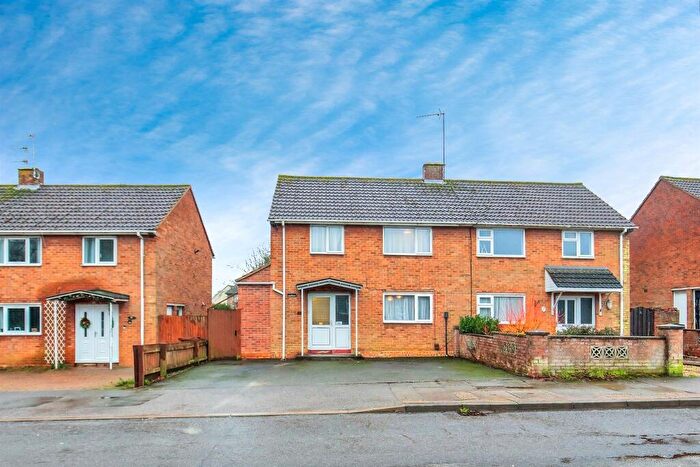
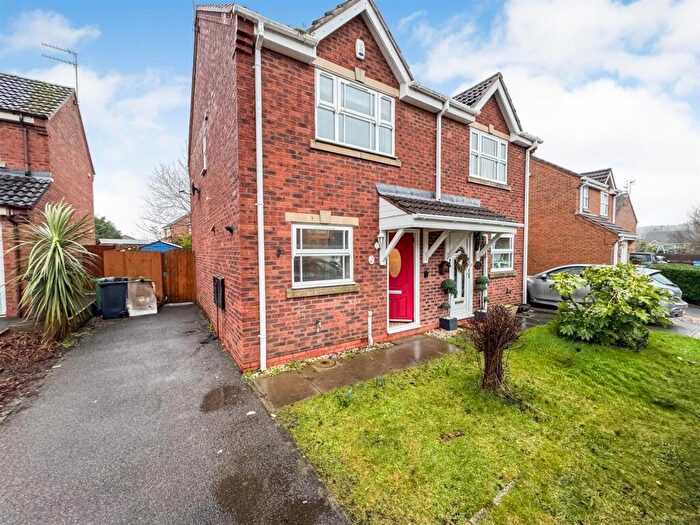
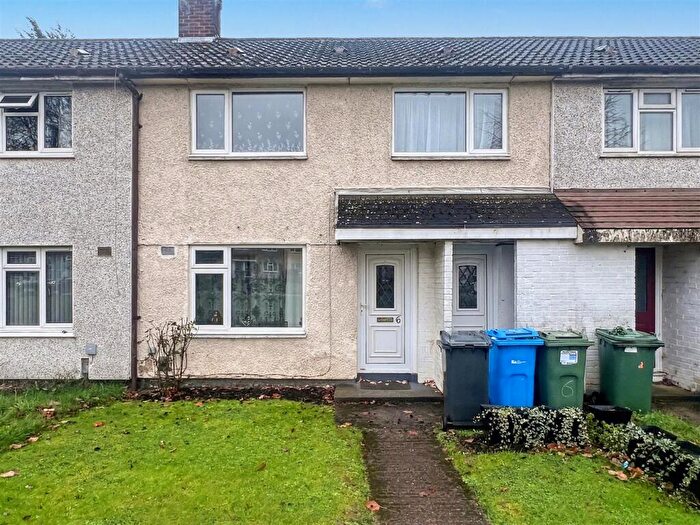
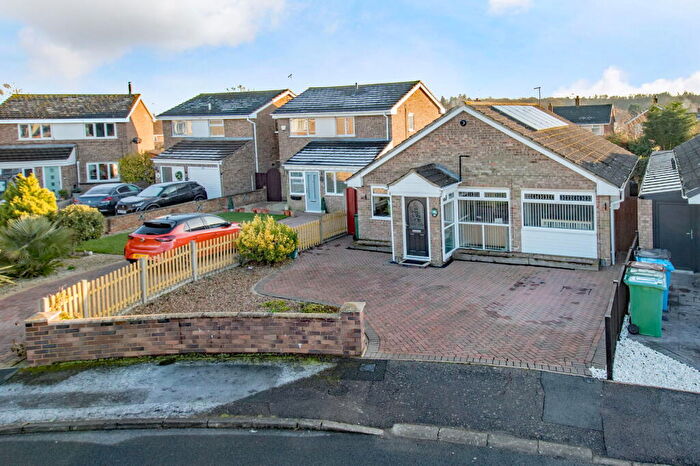
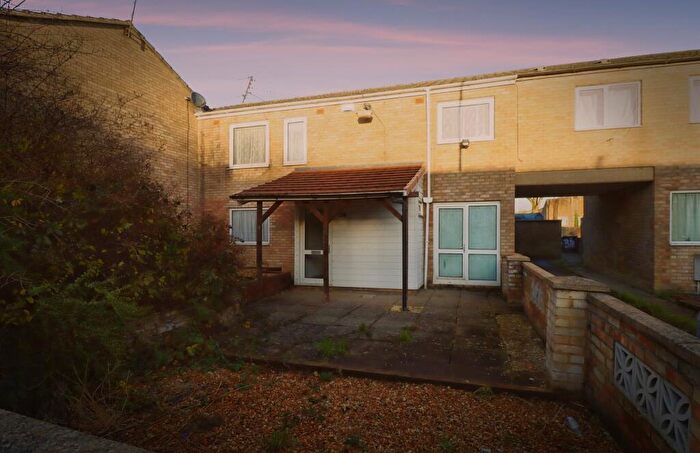
Properties in Tower Hill have an average house price of £210,115.00 and had 140 Property Transactions within the last 3 years¹.
Tower Hill is an area in Corby, Northamptonshire with 1,679 households², where the most expensive property was sold for £460,000.00.
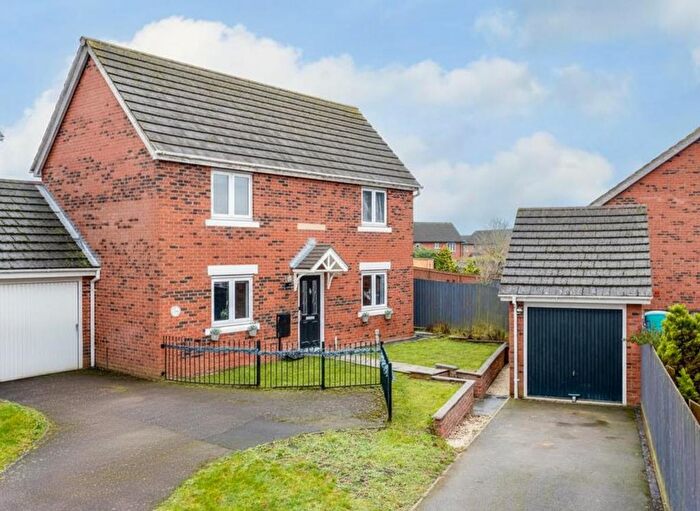
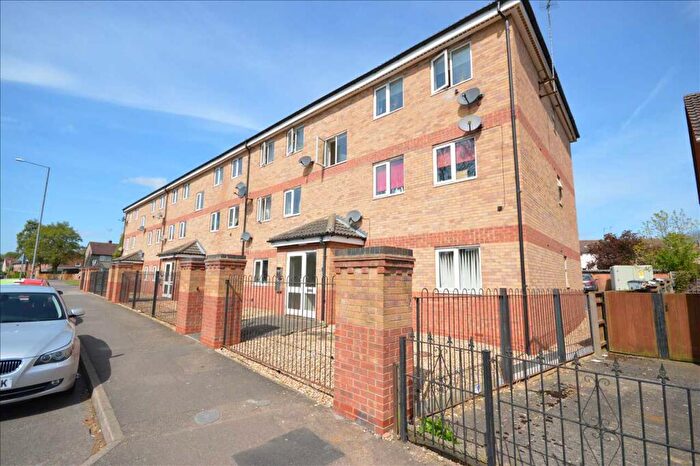
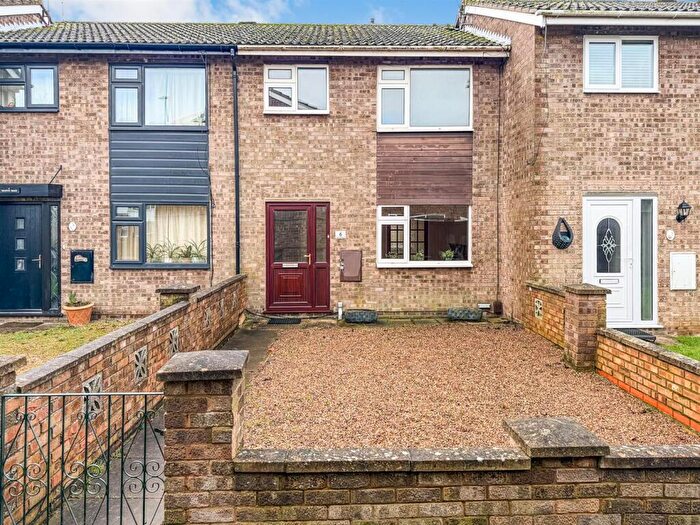
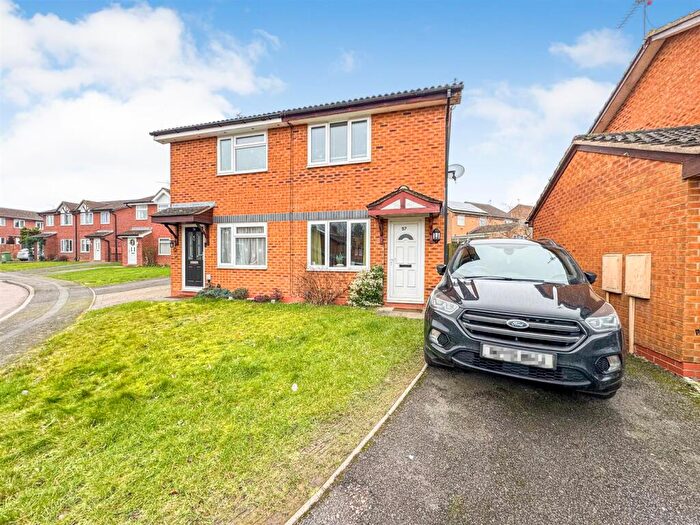
Properties for sale in Tower Hill
Roads and Postcodes in Tower Hill
Navigate through our locations to find the location of your next house in Tower Hill, Corby for sale or to rent.
| Streets | Postcodes |
|---|---|
| Althorp Place | NN18 9AQ |
| Arundel Walk | NN18 0JG |
| Ashurst Crescent | NN18 0JF |
| Balcombe Place | NN18 0NA |
| Barnsley Square | NN18 0PQ |
| Beanfield Avenue | NN18 0EG NN18 0EH NN18 0EQ |
| Bentley Walk | NN18 0PG |
| Beverley Walk | NN18 0PE |
| Bexhill Walk | NN18 0PY |
| Birling Place | NN18 0LZ |
| Bishops Way | NN18 0TJ |
| Bognor Road | NN18 0PX |
| Boughton Close | NN18 9AB |
| Bradford Walk | NN18 0PF |
| Brighton Road | NN18 0QB |
| Burgess Court | NN18 0LX |
| Castle Close | NN18 0TE |
| Coldermeadow Avenue | NN18 9AJ |
| Delapre Place | NN18 9AG |
| Drayton Close | NN18 9AD |
| Eastbourne Avenue | NN18 0JH NN18 0JJ NN18 0JQ |
| Fairlight Court | NN18 0LY |
| Falmer Walk | NN18 0LU |
| Farmstead Road | NN18 0LE NN18 0LF NN18 0LG |
| Fermyn Place | NN18 9AH |
| Filey Court | NN18 0QR |
| Gainsborough Road | NN18 0QD NN18 0QG NN18 0QH NN18 0QJ NN18 0QL NN18 0QN NN18 0QQ |
| Glyndebourne Gardens | NN18 0PZ NN18 0QA |
| Greenhill Rise | NN18 0LN NN18 0LP NN18 0LR NN18 0LS NN18 0LT NN18 0LW |
| Halifax Square | NN18 0NZ |
| Handcross Court | NN18 0HZ |
| Hastings Walk | NN18 0JE |
| Heathfield Walk | NN18 0JA |
| Helmsley Way | NN18 0PA |
| Hinton Avenue | NN18 9AA |
| Holmfirth Walk | NN18 0PB |
| Horsham Walk | NN18 0JD |
| Hove Street | NN18 0JB |
| Kingswood Place | NN18 9AF |
| Kirby Close | NN18 9AE |
| Knights Close | NN18 0TB |
| Malton Walk | NN18 0PJ |
| Manor Drive | NN18 0TN |
| Markham Walk | NN18 0PH |
| Norway Close | NN18 9EG |
| Petworth Gardens | NN18 0JL |
| Pevensey Walk | NN18 0JP |
| Pickering Court | NN18 0QS |
| Polegate Court | NN18 0JN |
| Scarborough Walk | NN18 0NR |
| Sedbergh Road | NN18 0NT |
| Selby Walk | NN18 0NP |
| Sheffield Walk | NN18 0NW |
| Skipton Close | NN18 0NS |
| Squire Close | NN18 0TL |
| Steyning Close | NN18 0NE NN18 0NF |
| Tavern Walk | NN18 0TD |
| The Lawns | NN18 0TA |
| Thirsk Road | NN18 0PN |
| Thorne Court | NN18 0PL |
| Todmorden Close | NN18 0PW |
| Tower Hill Road | NN18 0TH |
| Twickenham Court | NN18 0LA |
| York Road | NN18 0NU NN18 0NX NN18 0NY |
Transport near Tower Hill
- FAQ
- Price Paid By Year
- Property Type Price
Frequently asked questions about Tower Hill
What is the average price for a property for sale in Tower Hill?
The average price for a property for sale in Tower Hill is £210,115. This amount is 12% lower than the average price in Corby. There are 577 property listings for sale in Tower Hill.
What streets have the most expensive properties for sale in Tower Hill?
The streets with the most expensive properties for sale in Tower Hill are Coldermeadow Avenue at an average of £356,666, Hinton Avenue at an average of £347,500 and The Lawns at an average of £334,000.
What streets have the most affordable properties for sale in Tower Hill?
The streets with the most affordable properties for sale in Tower Hill are Pickering Court at an average of £97,333, Filey Court at an average of £125,000 and Selby Walk at an average of £131,000.
Which train stations are available in or near Tower Hill?
Some of the train stations available in or near Tower Hill are Corby, Kettering and Market Harborough.
Property Price Paid in Tower Hill by Year
The average sold property price by year was:
| Year | Average Sold Price | Price Change |
Sold Properties
|
|---|---|---|---|
| 2025 | £202,858 | -3% |
50 Properties |
| 2024 | £208,794 | -5% |
44 Properties |
| 2023 | £219,268 | 8% |
46 Properties |
| 2022 | £202,535 | 6% |
65 Properties |
| 2021 | £189,627 | 0,2% |
66 Properties |
| 2020 | £189,303 | 11% |
56 Properties |
| 2019 | £168,984 | -1% |
64 Properties |
| 2018 | £169,829 | 10% |
54 Properties |
| 2017 | £152,275 | 5% |
52 Properties |
| 2016 | £144,134 | 16% |
53 Properties |
| 2015 | £120,678 | 3% |
52 Properties |
| 2014 | £116,573 | 7% |
46 Properties |
| 2013 | £108,277 | 4% |
34 Properties |
| 2012 | £104,451 | 11% |
31 Properties |
| 2011 | £93,321 | -9% |
32 Properties |
| 2010 | £101,936 | -6% |
33 Properties |
| 2009 | £108,277 | 3% |
27 Properties |
| 2008 | £105,552 | -5% |
34 Properties |
| 2007 | £111,279 | 8% |
83 Properties |
| 2006 | £101,850 | 9% |
66 Properties |
| 2005 | £92,567 | 5% |
73 Properties |
| 2004 | £87,478 | 25% |
75 Properties |
| 2003 | £65,528 | 11% |
86 Properties |
| 2002 | £58,356 | 17% |
70 Properties |
| 2001 | £48,607 | -3% |
60 Properties |
| 2000 | £50,077 | 4% |
59 Properties |
| 1999 | £47,977 | 13% |
37 Properties |
| 1998 | £41,923 | 7% |
40 Properties |
| 1997 | £39,118 | 11% |
45 Properties |
| 1996 | £34,638 | -8% |
41 Properties |
| 1995 | £37,428 | - |
45 Properties |
Property Price per Property Type in Tower Hill
Here you can find historic sold price data in order to help with your property search.
The average Property Paid Price for specific property types in the last three years are:
| Property Type | Average Sold Price | Sold Properties |
|---|---|---|
| Semi Detached House | £210,329.00 | 46 Semi Detached Houses |
| Detached House | £328,915.00 | 20 Detached Houses |
| Terraced House | £183,580.00 | 69 Terraced Houses |
| Flat | £99,140.00 | 5 Flats |

