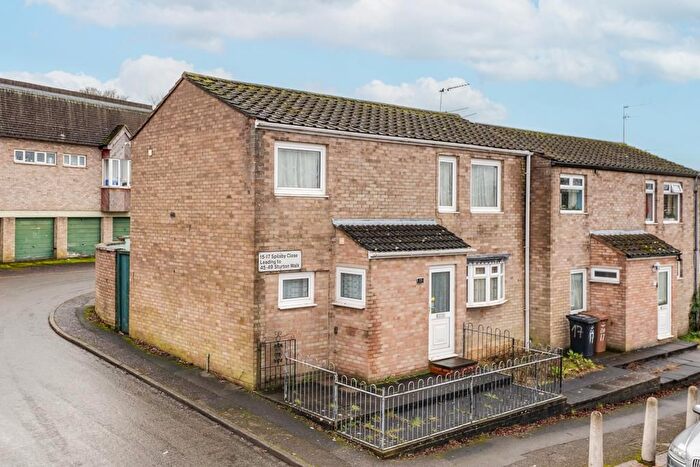
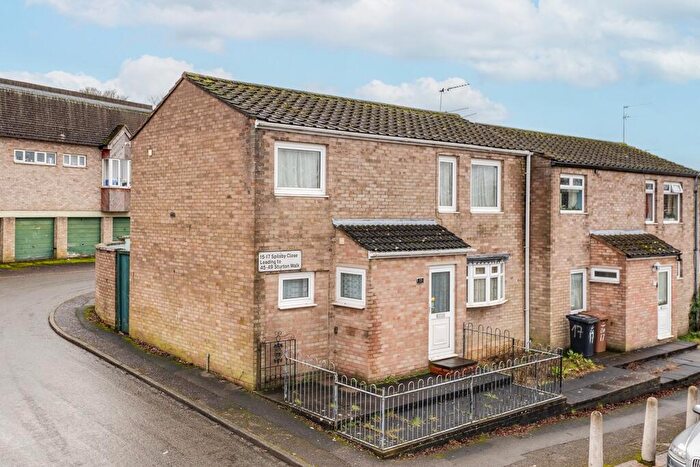
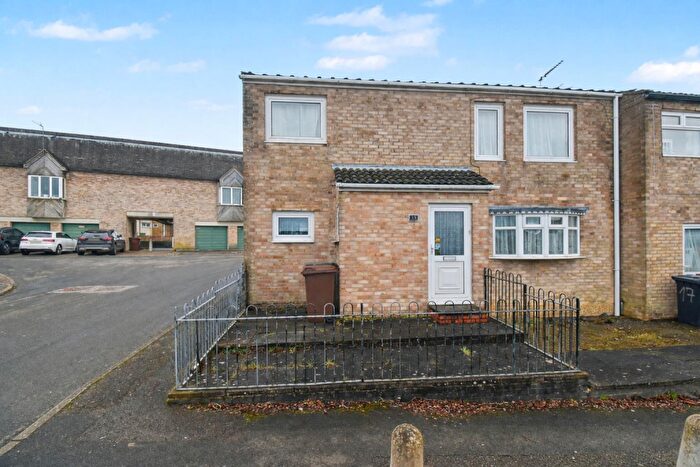
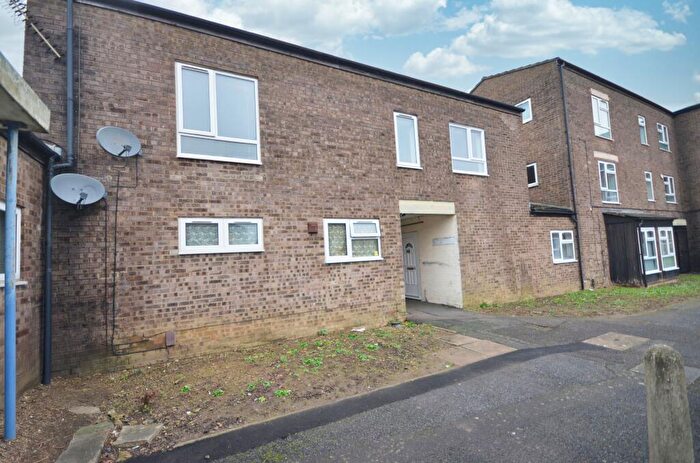
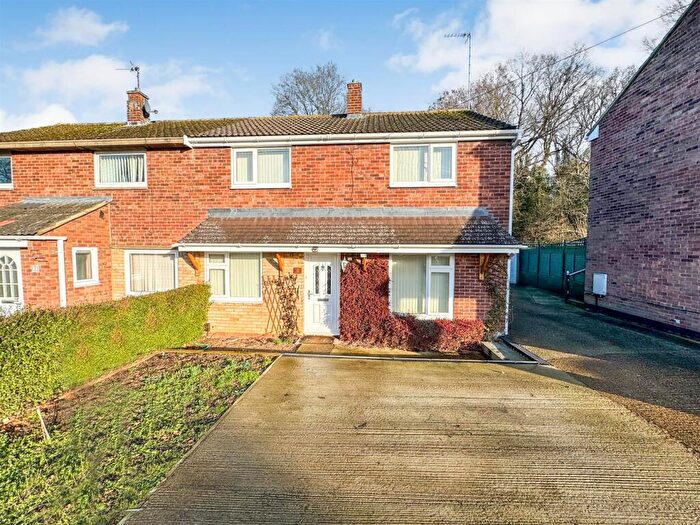
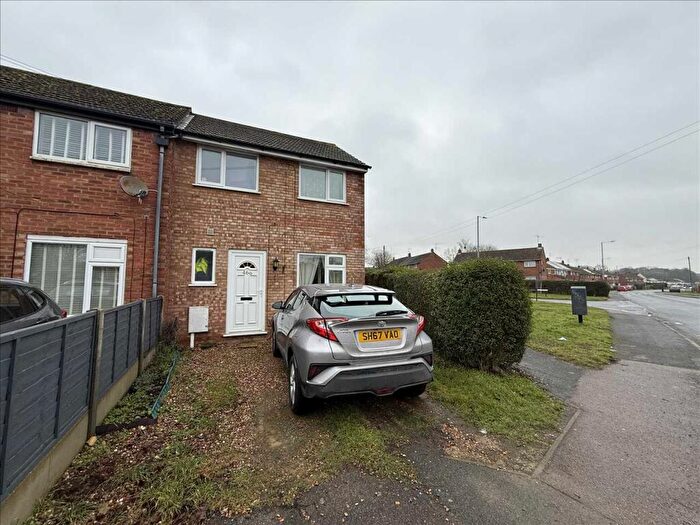
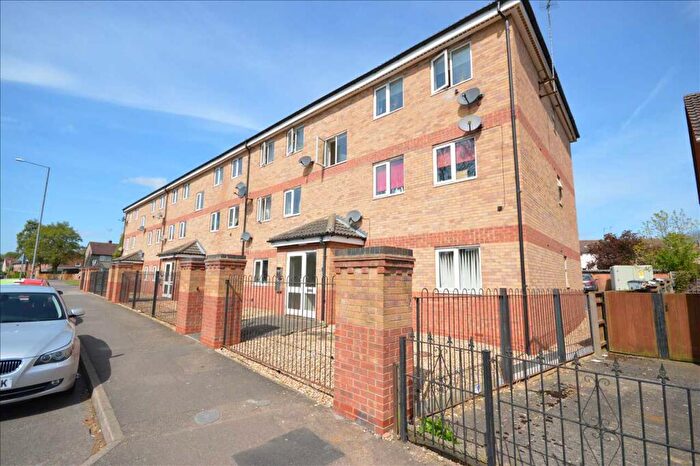
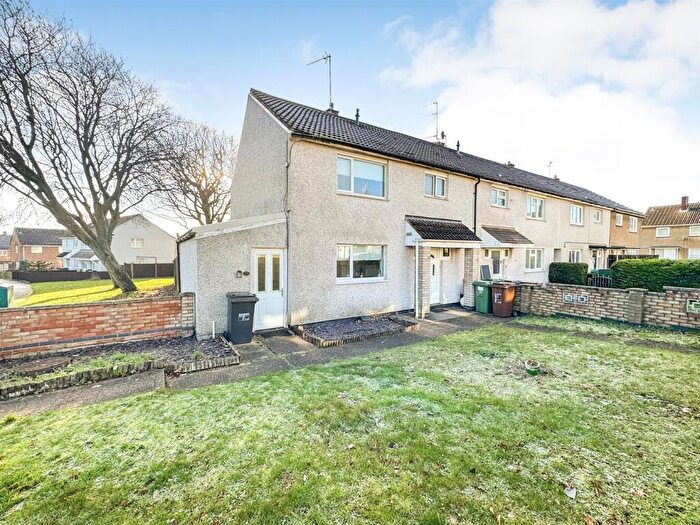
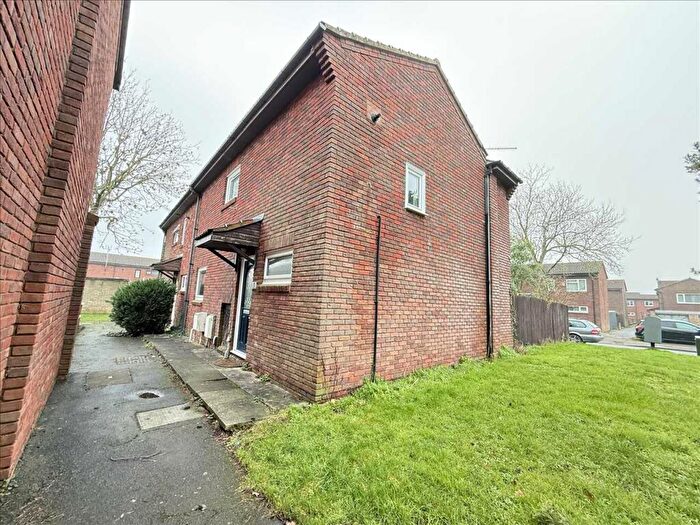
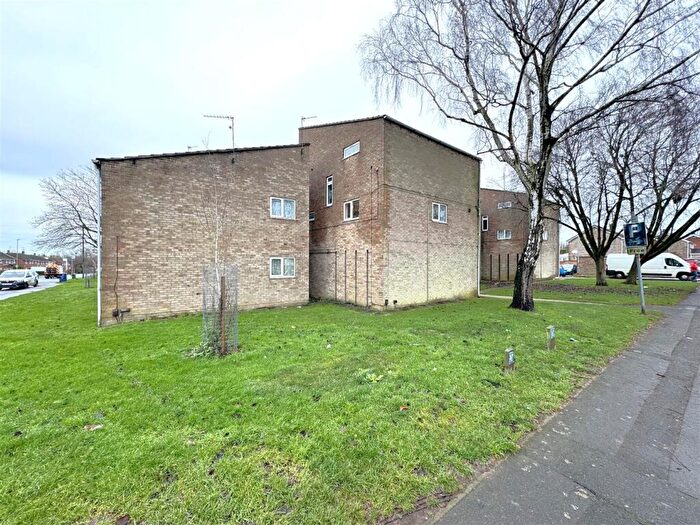
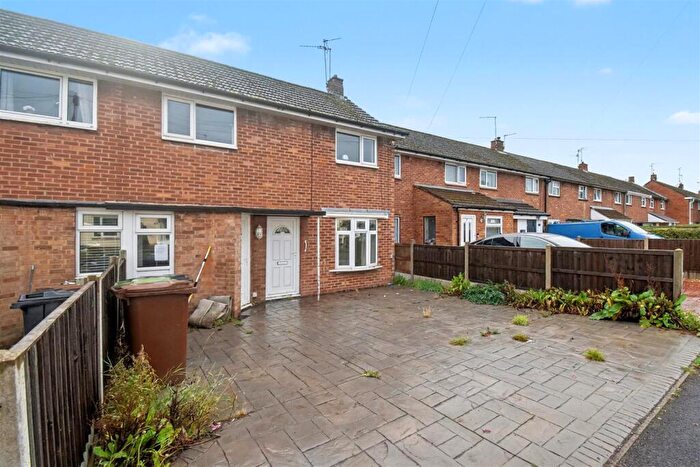
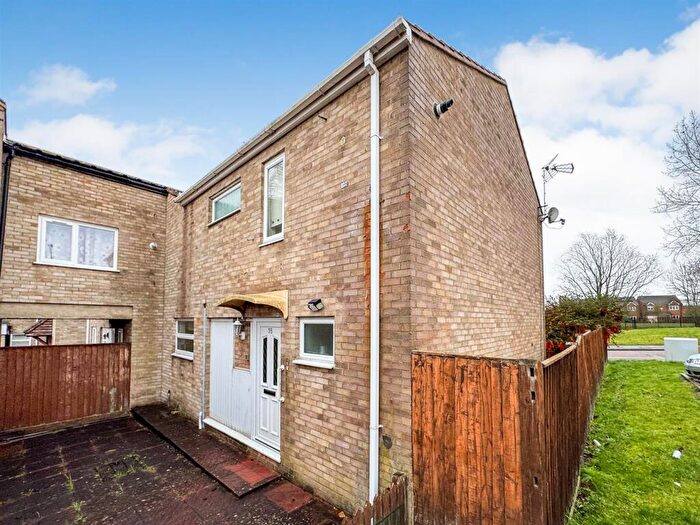
Houses for sale & to rent in Beanfield, Corby
House Prices in Beanfield
Properties in Beanfield have an average house price of £187,310.00 and had 108 Property Transactions within the last 3 years¹.
Beanfield is an area in Corby, Northamptonshire with 1,560 households², where the most expensive property was sold for £245,000.00.
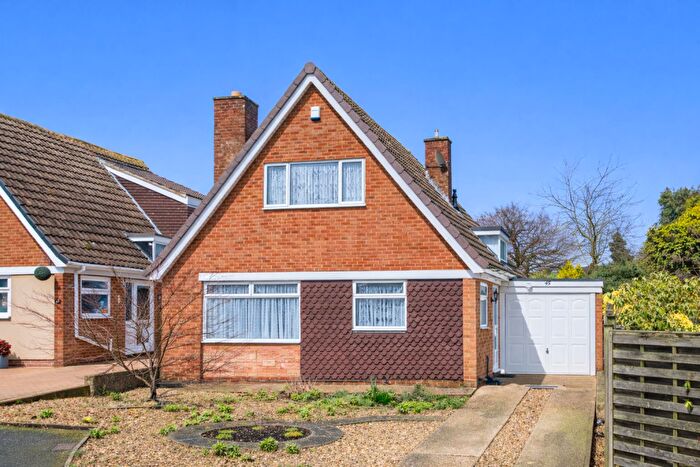
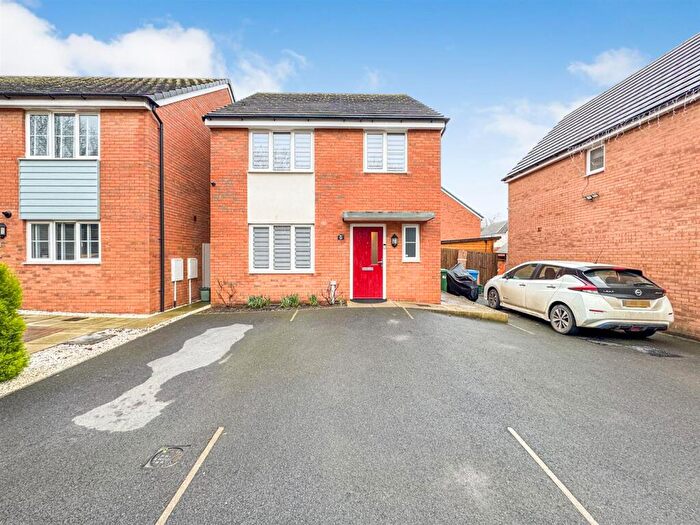
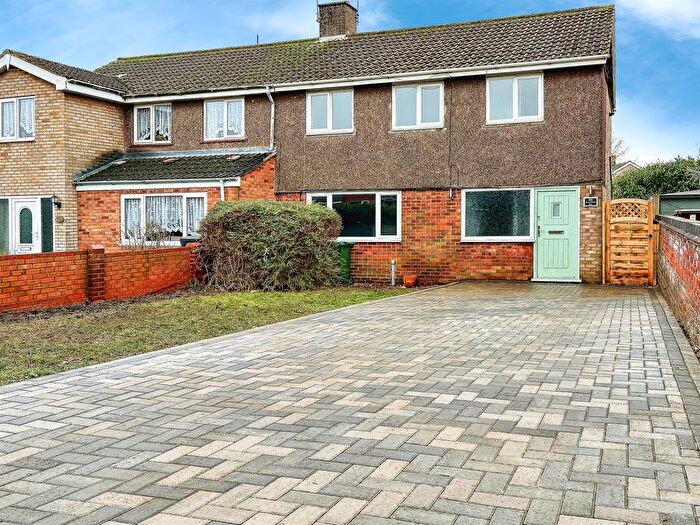
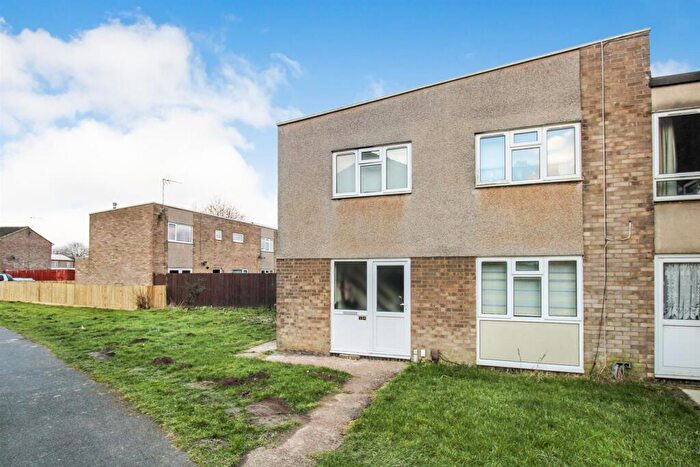
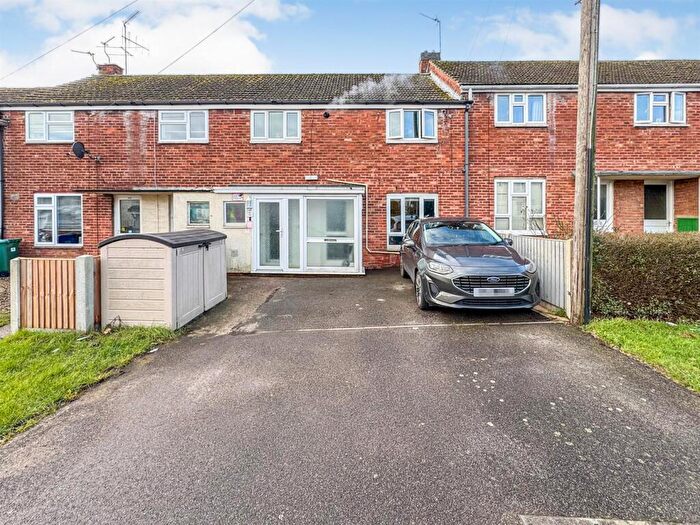
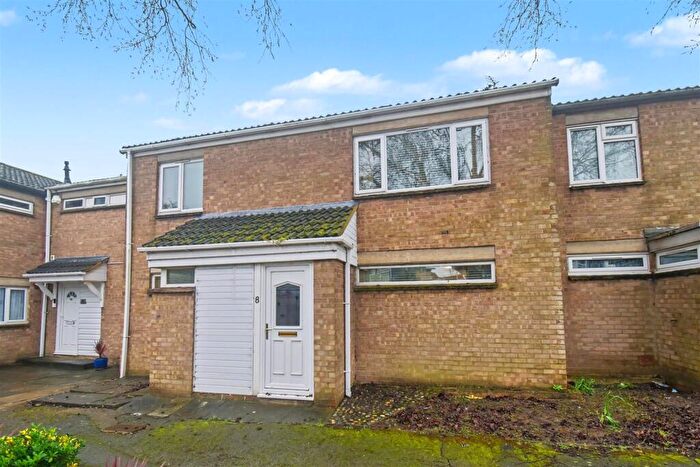
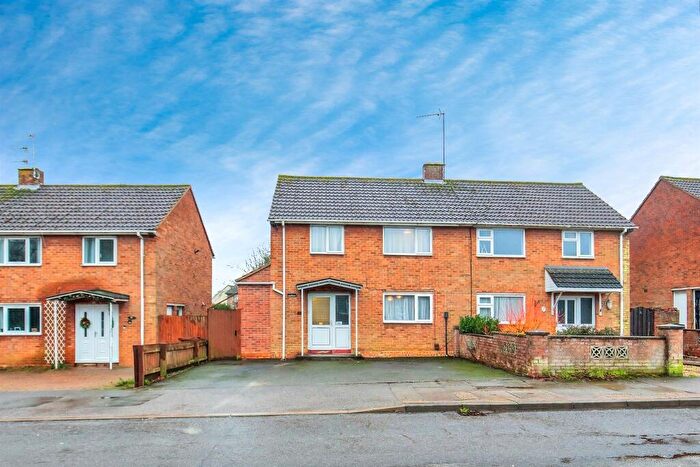
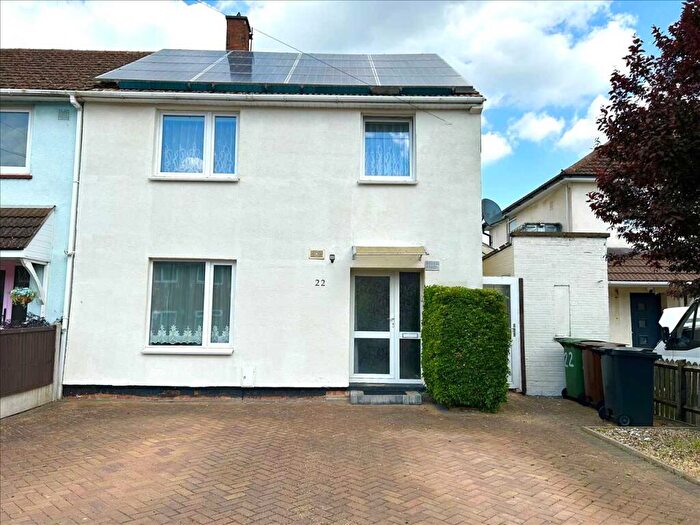
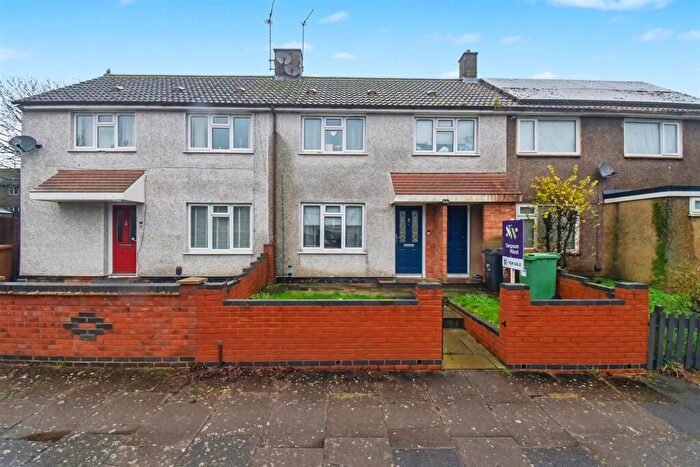
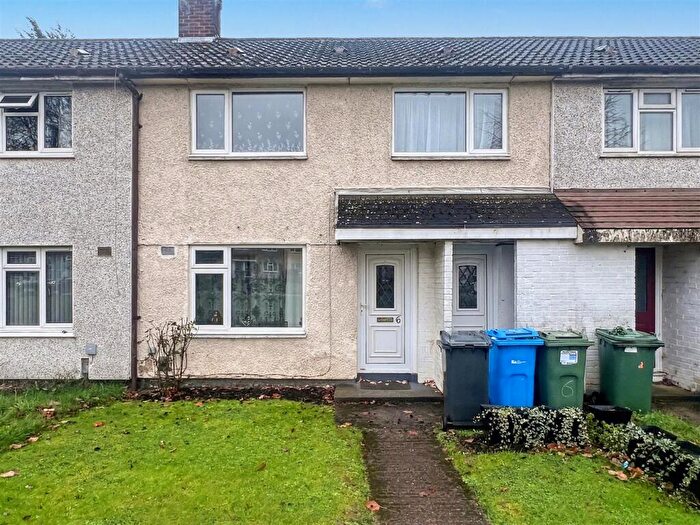
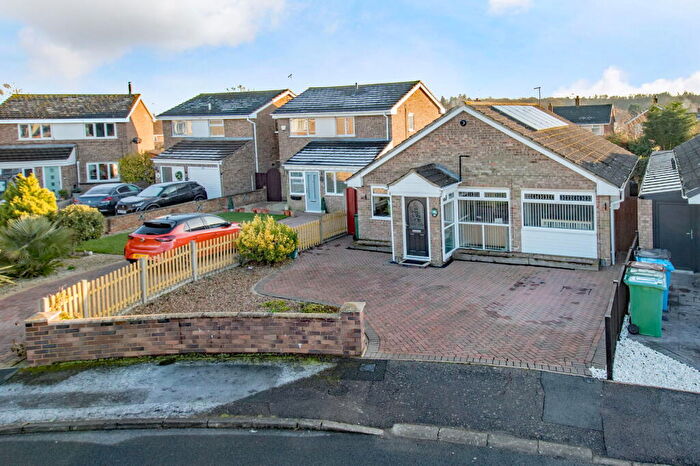
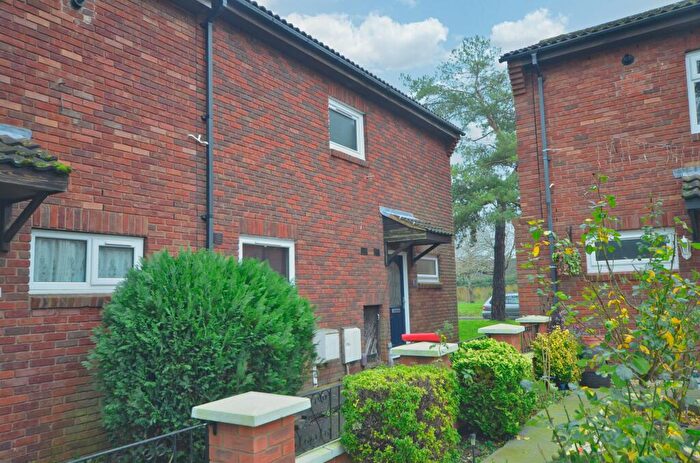
Properties for sale in Beanfield
Roads and Postcodes in Beanfield
Navigate through our locations to find the location of your next house in Beanfield, Corby for sale or to rent.
| Streets | Postcodes |
|---|---|
| Barton Square | NN18 0HQ |
| Beanfield Avenue | NN18 0AX NN18 0AY NN18 0AZ NN18 0BA NN18 0AU |
| Beeston Place | NN18 0EP |
| Bestwood Green | NN18 0ER |
| Bingham Walk | NN18 0HB |
| Bodiam Place | NN18 0NB |
| Bradmore Gardens | NN18 0HD |
| Bramber Court | NN18 0ND |
| Bridgford Place | NN18 0HE |
| Bridgwater Court | NN18 0DH |
| Brinsley Green | NN18 0HG |
| Bulwell Green | NN18 0HF |
| Canford Green | NN18 0DQ |
| Caythorpe Square | NN18 0HJ |
| Cheddar Walk | NN18 0DW |
| Chesil Walk | NN18 0DJ NN18 0DL NN18 0DN |
| Compton Green | NN18 0DP |
| Cottingham Road | NN18 0TW |
| Farmstead Road | NN18 0LH NN18 0LJ NN18 0LL NN18 0LQ NN18 0AF |
| Gamston Walk | NN18 0AL |
| Gateford Court | NN18 0AQ |
| Glastonbury Road | NN18 0DA NN18 0DB NN18 0DD NN18 0DE NN18 0DF NN18 0DG |
| Granby Close | NN18 0AG |
| Greasley Walk | NN18 0AJ |
| Gunthorpe Place | NN18 0AH |
| Harrogate Court | NN18 0PD |
| Langport Green | NN18 0DX |
| Lulworth Walk | NN18 0DY |
| Mantlefield Road | NN18 0AR NN18 0AS NN18 0AT NN18 0AW NN18 0BT NN18 0AN NN18 0AP |
| Minehead Close | NN18 0BU |
| Monks Way | NN18 0RA |
| Newark Drive | NN18 0ES NN18 0ET NN18 0EU NN18 0EX NN18 0EY NN18 0EZ NN18 0HA |
| Ollerton Walk | NN18 0HR |
| Plumpton Court | NN18 0JW |
| Purbeck Drive | NN18 0BX NN18 0BY |
| Rufford Walk | NN18 0HH |
| Seaford Walk | NN18 0JX |
| Selsey Road | NN18 0JT |
| Shaftesbury Road | NN18 0DU |
| Sherborne Walk | NN18 0DR |
| Shoreham Court | NN18 0JU |
| Stalbridge Walk | NN18 0DT |
| Stinsford Road | NN18 0BF |
| Sturminster Way | NN18 0BS |
| Swanage Court | NN18 0DS |
| Taunton Avenue | NN18 0BB NN18 0BD NN18 0BE NN18 0BG NN18 0BQ |
| Thatchers Barn Drive | NN18 0BJ |
| Thoresby Court | NN18 0EJ NN18 0EL |
| Wareham Green | NN18 0AD |
| Warminster Close | NN18 0BP |
| Wedmore Court | NN18 0DZ |
| Welbeck Court | NN18 0HP |
| Wells Green | NN18 0BH |
| Westbury Walk | NN18 0AE |
| Weston Walk | NN18 0HL |
| Westwood Walk | NN18 0EN NN18 0EW |
| Weymouth Close | NN18 0BL |
| Wilmington Walk | NN18 0JR |
| Wimborne Walk | NN18 0BN NN18 0BW |
| Winthorpe Way | NN18 0HW |
| Worksop Gardens | NN18 0HN |
| Worthing Road | NN18 0JS |
Transport near Beanfield
- FAQ
- Price Paid By Year
- Property Type Price
Frequently asked questions about Beanfield
What is the average price for a property for sale in Beanfield?
The average price for a property for sale in Beanfield is £187,310. This amount is 21% lower than the average price in Corby. There are 487 property listings for sale in Beanfield.
What streets have the most expensive properties for sale in Beanfield?
The streets with the most expensive properties for sale in Beanfield are Welbeck Court at an average of £230,000, Purbeck Drive at an average of £221,333 and Gamston Walk at an average of £220,000.
What streets have the most affordable properties for sale in Beanfield?
The streets with the most affordable properties for sale in Beanfield are Wedmore Court at an average of £112,000, Langport Green at an average of £138,000 and Caythorpe Square at an average of £155,000.
Which train stations are available in or near Beanfield?
Some of the train stations available in or near Beanfield are Corby, Kettering and Market Harborough.
Property Price Paid in Beanfield by Year
The average sold property price by year was:
| Year | Average Sold Price | Price Change |
Sold Properties
|
|---|---|---|---|
| 2025 | £187,500 | 4% |
30 Properties |
| 2024 | £180,906 | -9% |
48 Properties |
| 2023 | £197,366 | 2% |
30 Properties |
| 2022 | £192,950 | 14% |
69 Properties |
| 2021 | £165,142 | 6% |
59 Properties |
| 2020 | £154,474 | 0,4% |
37 Properties |
| 2019 | £153,814 | 1% |
64 Properties |
| 2018 | £152,681 | 11% |
132 Properties |
| 2017 | £136,558 | 10% |
56 Properties |
| 2016 | £122,806 | 10% |
58 Properties |
| 2015 | £110,929 | 11% |
51 Properties |
| 2014 | £98,677 | 7% |
49 Properties |
| 2013 | £92,163 | 7% |
30 Properties |
| 2012 | £85,575 | 4% |
26 Properties |
| 2011 | £82,557 | -6% |
32 Properties |
| 2010 | £87,152 | -4% |
20 Properties |
| 2009 | £90,735 | -23% |
17 Properties |
| 2008 | £112,036 | 4% |
34 Properties |
| 2007 | £107,981 | 13% |
93 Properties |
| 2006 | £93,819 | 7% |
57 Properties |
| 2005 | £87,423 | 10% |
54 Properties |
| 2004 | £78,803 | 24% |
89 Properties |
| 2003 | £60,143 | 16% |
78 Properties |
| 2002 | £50,320 | 17% |
78 Properties |
| 2001 | £41,576 | 9% |
49 Properties |
| 2000 | £37,815 | 4% |
42 Properties |
| 1999 | £36,288 | 7% |
47 Properties |
| 1998 | £33,569 | -2% |
42 Properties |
| 1997 | £34,346 | 1% |
45 Properties |
| 1996 | £34,087 | 13% |
36 Properties |
| 1995 | £29,602 | - |
30 Properties |
Property Price per Property Type in Beanfield
Here you can find historic sold price data in order to help with your property search.
The average Property Paid Price for specific property types in the last three years are:
| Property Type | Average Sold Price | Sold Properties |
|---|---|---|
| Semi Detached House | £199,410.00 | 41 Semi Detached Houses |
| Terraced House | £187,270.00 | 58 Terraced Houses |
| Flat | £132,444.00 | 9 Flats |

