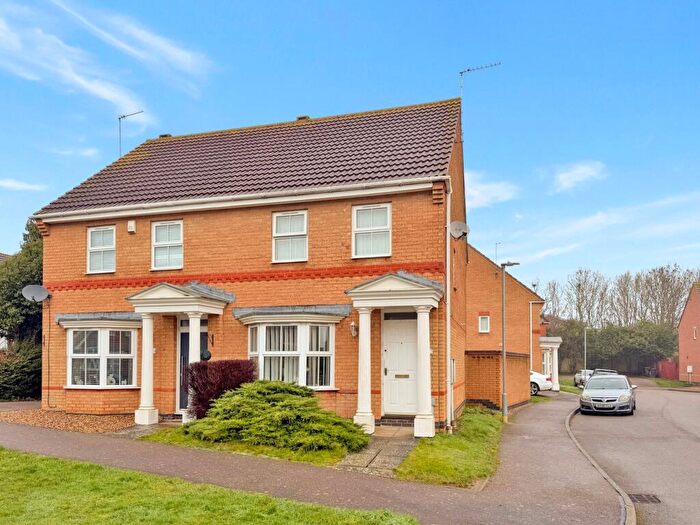
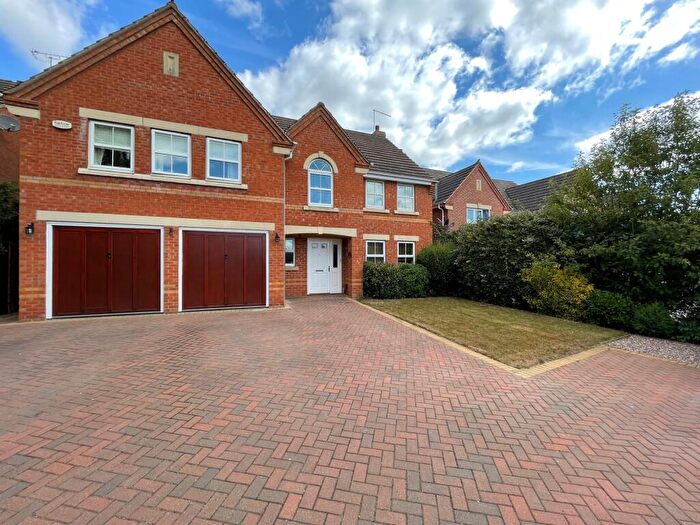
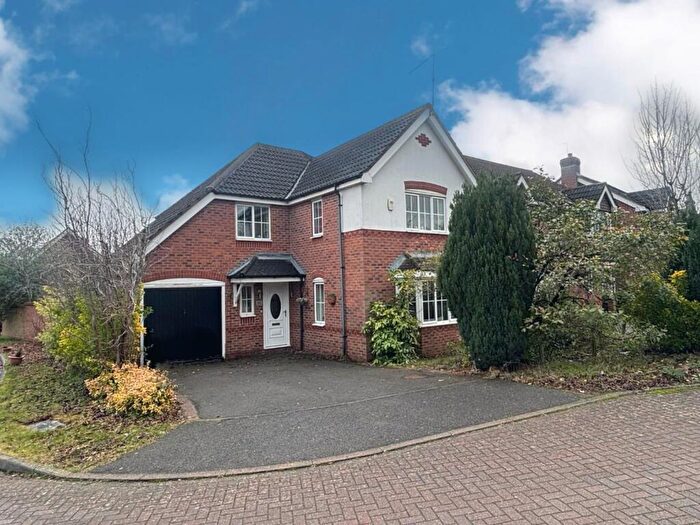
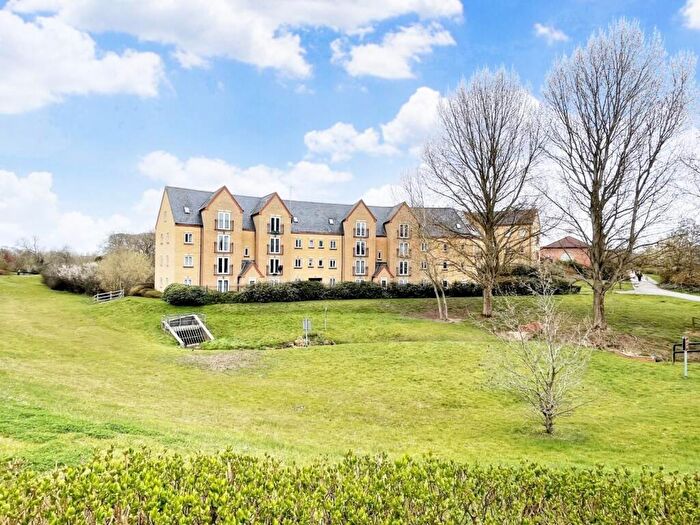
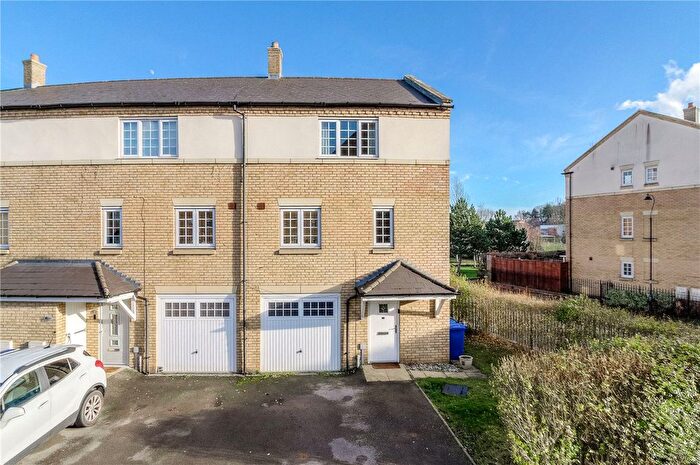
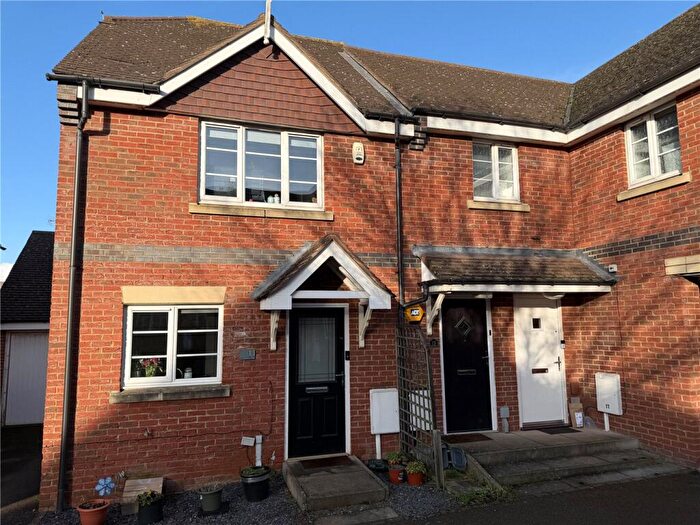
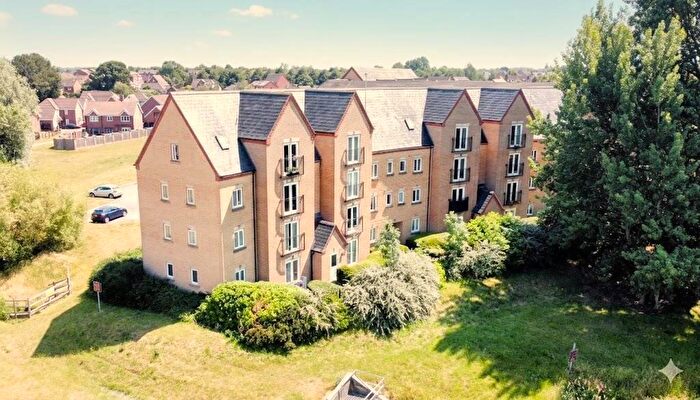
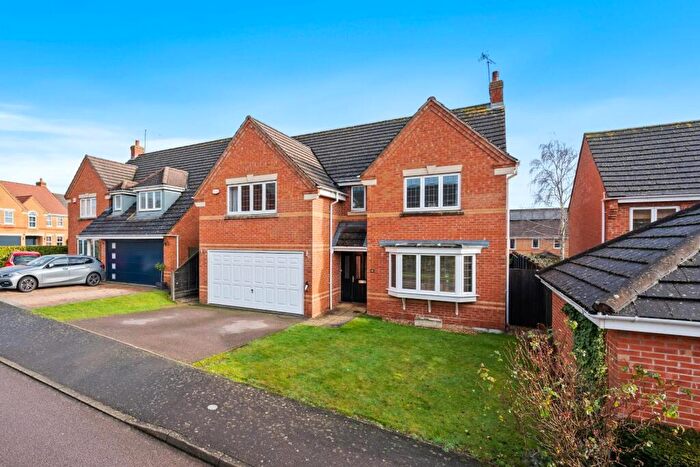
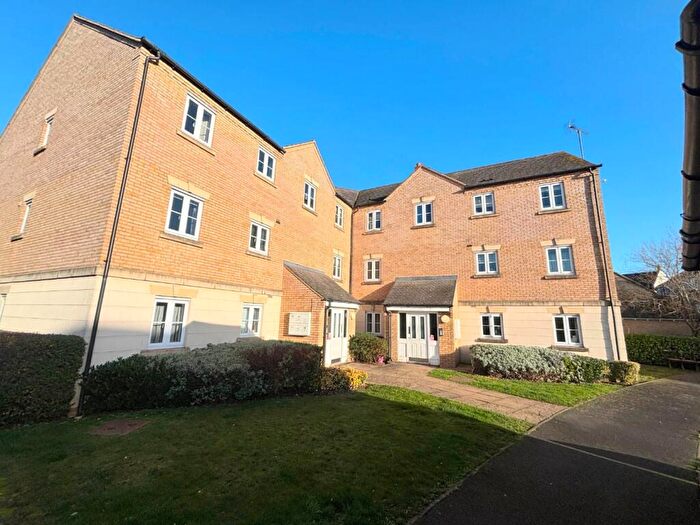
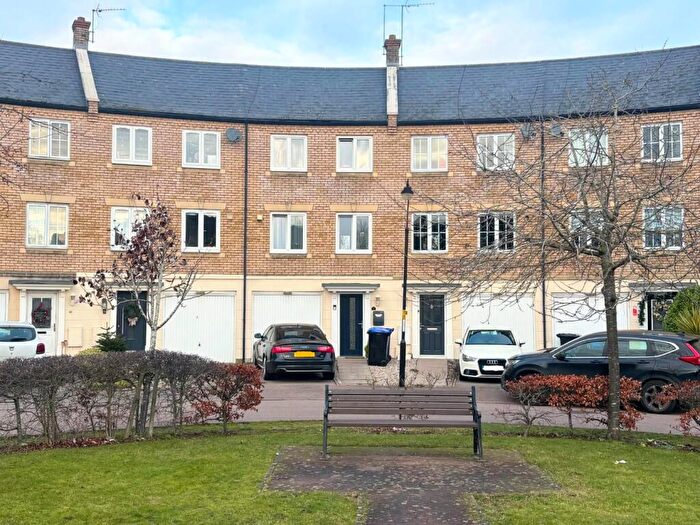
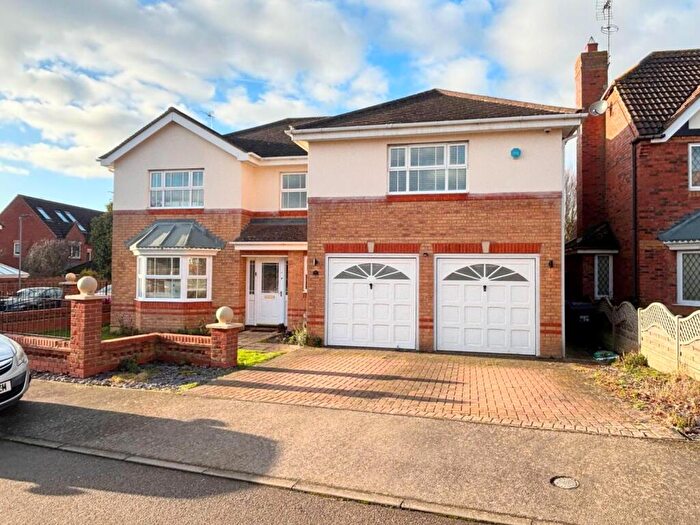
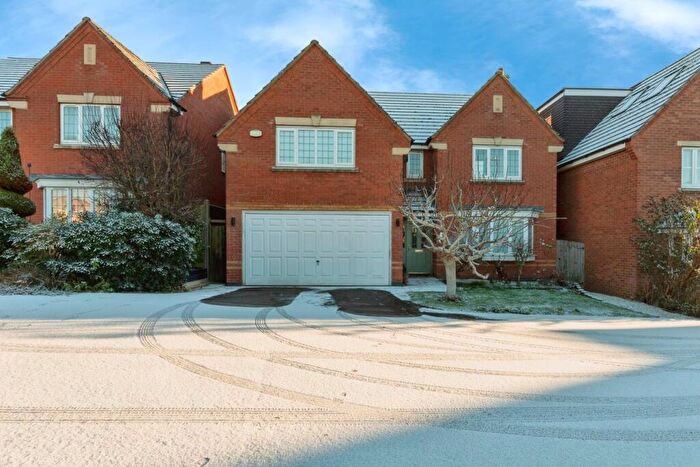
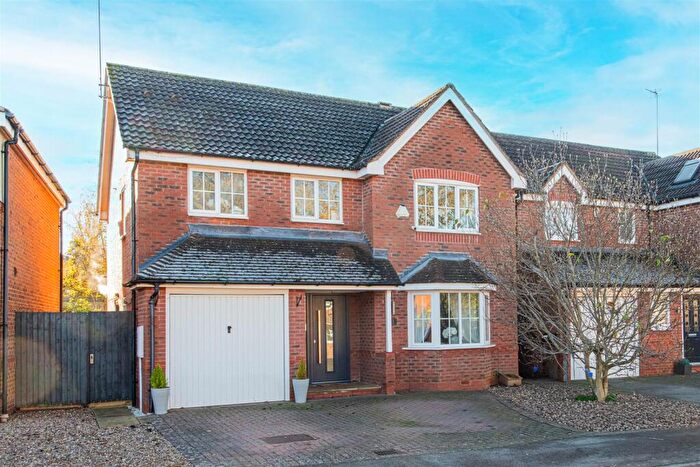
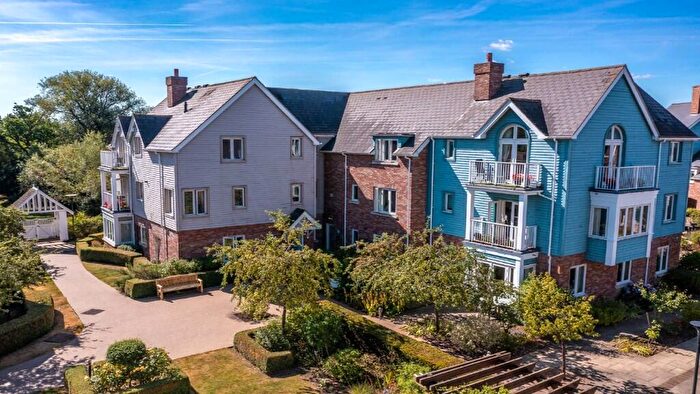
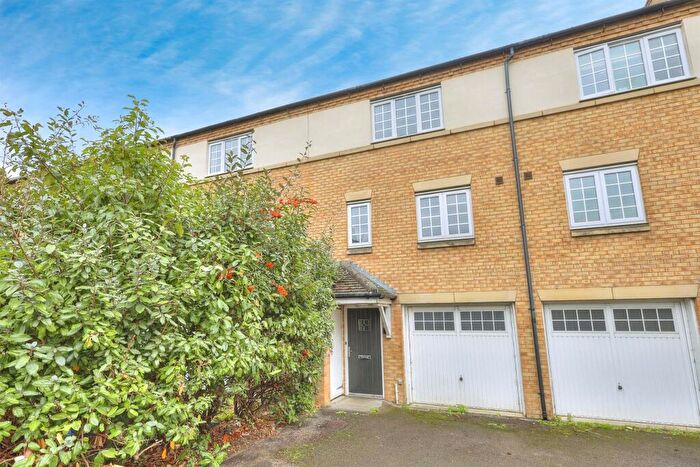
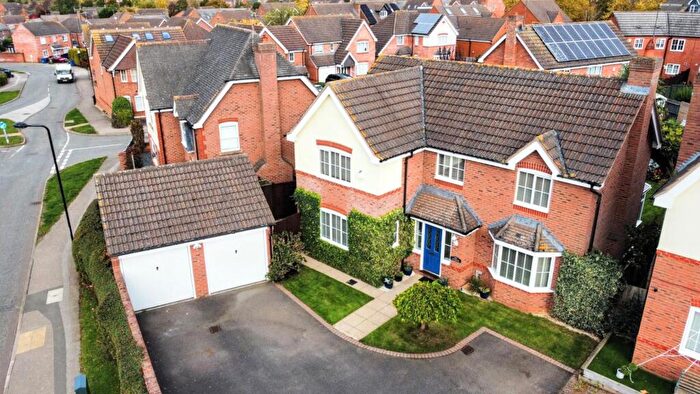
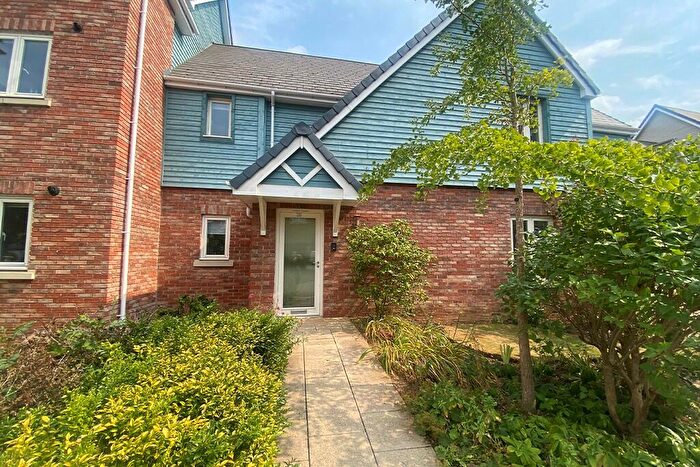
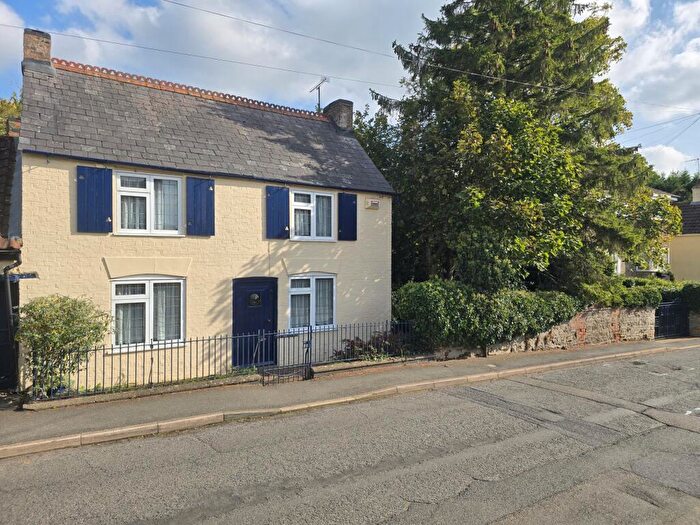
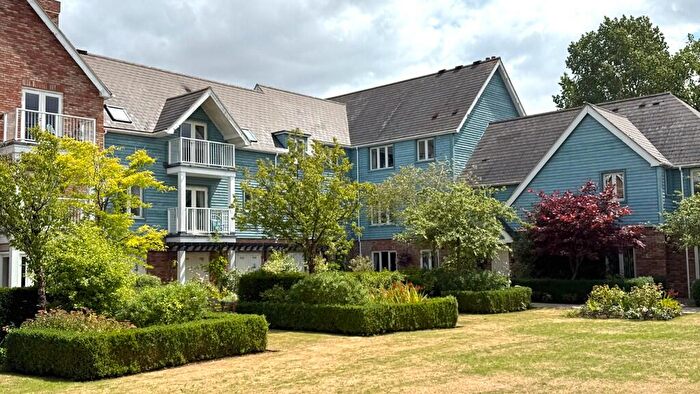
Houses for sale & to rent in Grange Park, Northampton
House Prices in Grange Park
Properties in Grange Park have an average house price of £310,526.00 and had 233 Property Transactions within the last 3 years¹.
Grange Park is an area in Northampton, Northamptonshire with 1,562 households², where the most expensive property was sold for £775,000.00.
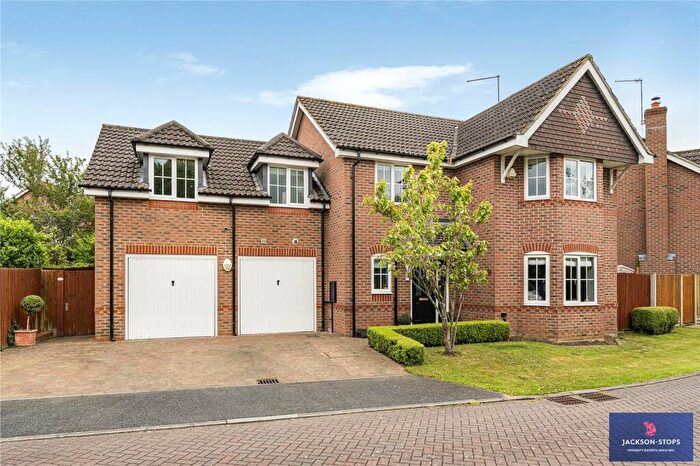
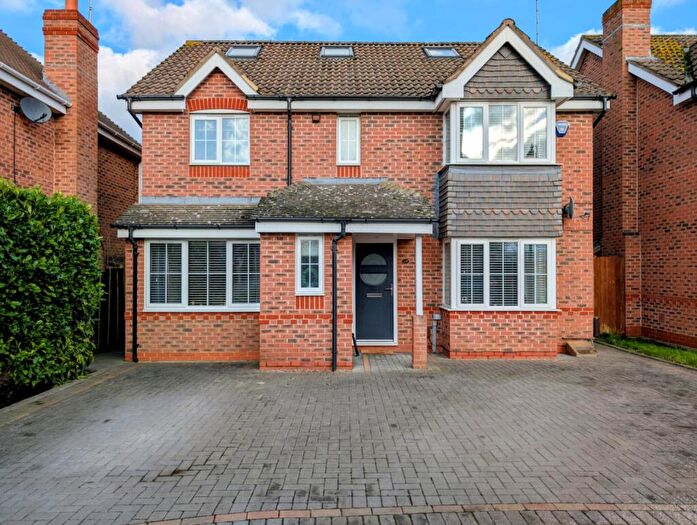
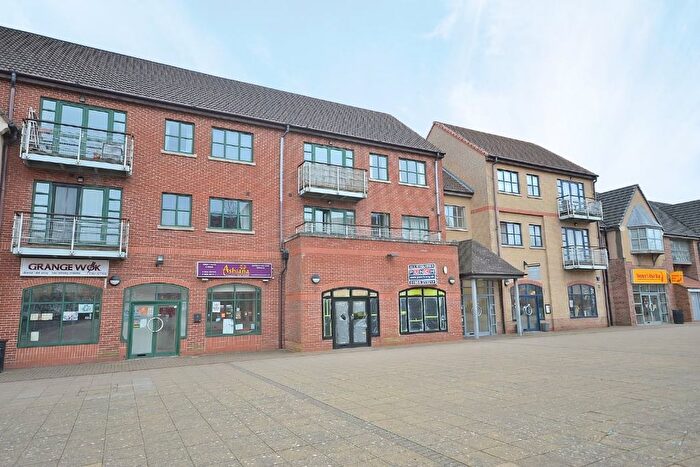
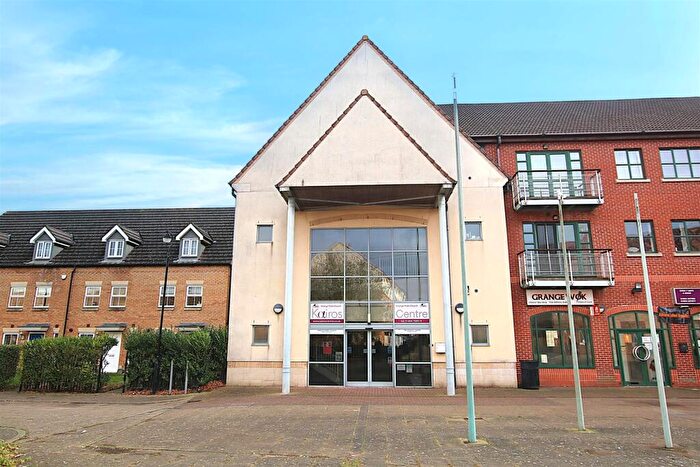
Properties for sale in Grange Park
Roads and Postcodes in Grange Park
Navigate through our locations to find the location of your next house in Grange Park, Northampton for sale or to rent.
| Streets | Postcodes |
|---|---|
| Badger Lane | NN4 5DH |
| Baines Way | NN4 5DP |
| Barn Close | NN4 5AG |
| Birch Close | NN4 5BQ |
| Bluebell Rise | NN4 5DF |
| Bridge Meadow Way | NN4 5AB NN4 5EB NN4 5ED NN4 5EE NN4 5EF NN4 5EG NN4 5EH |
| Brook View | NN4 5DR |
| Cheaney Drive | NN4 5EN NN4 5FB |
| Clover Field | NN4 5DB |
| Cony Walk | NN4 5DJ |
| Cornflower Close | NN4 5BX |
| Dainty Grove | NN4 5DX |
| Deer Close | NN4 5DN |
| Dunnock Lane | NN4 5DG |
| Finney Drive | NN4 5DT |
| Foxfield Way | NN4 5BE |
| Foxglove Close | NN4 5DD |
| Georges Drive | NN4 5DU |
| Great Ground Walk | NN4 5BB |
| Harefield | NN4 5DQ |
| Hazel Copse | NN4 5BY |
| High Barns Close | NN4 5BH |
| Home Close | NN4 5BL |
| Keepers Close | NN4 5AU |
| Kings Close | NN4 5AH |
| Lady Smock Close | NN4 5BW |
| Lark Lane | NN4 5AX |
| Little Field | NN4 5AF |
| Loake Close | NN4 5EZ |
| Lodge Close | NN4 5AJ |
| London Road | NN4 0LY |
| Meadowsweet Walk | NN4 5DA |
| Millers Way | NN4 5AL |
| Old Close | NN4 5BJ |
| Pine Close | NN4 5BA |
| Ploughmans Way | NN4 5AS |
| Poachers Close | NN4 5AT |
| Primrose Walk | NN4 5DE |
| Quintonside | NN4 5AD NN4 5AE |
| Rickyard Walk | NN4 5BD |
| Roman Way | NN4 5EA |
| Rowan Close | NN4 5BP |
| Sandy Way | NN4 5EJ |
| Saxon Avenue | NN4 5EL |
| School Lane | NN4 5FZ |
| Springwell Close | NN4 5AQ |
| Squirrel Close | NN4 5DL |
| Swift Close | NN4 5AZ |
| The Glades | NN4 5BS |
| The Green | NN4 5AP |
| The Meadows | NN4 5BU |
| The Oaks | NN4 5AW |
| The Ridings | NN4 5BN |
| The Rookery | NN4 5FY |
| The Saddlers | NN4 5AN |
| The Spinney | NN4 5BT |
| The Square | NN4 5AR |
| The Witheys | NN4 5BR |
| Wake Way | NN4 5BF NN4 5BG |
| Wilks Walk | NN4 5DW |
| Williams Way | NN4 5DS NN4 5DY |
| Woodlands | NN4 5BZ NN4 5FX |
| Wren Close | NN4 5AY |
Transport near Grange Park
-
Northampton Station
-
Wolverton Station
-
Long Buckby Station
-
Milton Keynes Central Station
-
Wellingborough Station
-
Bletchley Station
-
Fenny Stratford Station
- FAQ
- Price Paid By Year
- Property Type Price
Frequently asked questions about Grange Park
What is the average price for a property for sale in Grange Park?
The average price for a property for sale in Grange Park is £310,526. This amount is 8% higher than the average price in Northampton. There are 363 property listings for sale in Grange Park.
What streets have the most expensive properties for sale in Grange Park?
The streets with the most expensive properties for sale in Grange Park are Swift Close at an average of £610,625, Home Close at an average of £532,500 and The Glades at an average of £523,500.
What streets have the most affordable properties for sale in Grange Park?
The streets with the most affordable properties for sale in Grange Park are Wilks Walk at an average of £150,333, Dainty Grove at an average of £151,499 and Millers Way at an average of £174,333.
Which train stations are available in or near Grange Park?
Some of the train stations available in or near Grange Park are Northampton, Wolverton and Long Buckby.
Property Price Paid in Grange Park by Year
The average sold property price by year was:
| Year | Average Sold Price | Price Change |
Sold Properties
|
|---|---|---|---|
| 2025 | £319,550 | 10% |
87 Properties |
| 2024 | £287,572 | -12% |
72 Properties |
| 2023 | £322,250 | 1% |
74 Properties |
| 2022 | £317,567 | -0,2% |
92 Properties |
| 2021 | £318,053 | 9% |
130 Properties |
| 2020 | £290,660 | 3% |
56 Properties |
| 2019 | £282,864 | 6% |
74 Properties |
| 2018 | £265,326 | -8% |
113 Properties |
| 2017 | £285,287 | 12% |
117 Properties |
| 2016 | £252,113 | 5% |
128 Properties |
| 2015 | £240,153 | 9% |
123 Properties |
| 2014 | £217,447 | 6% |
124 Properties |
| 2013 | £203,377 | -3% |
78 Properties |
| 2012 | £210,419 | -3% |
68 Properties |
| 2011 | £215,752 | 1% |
101 Properties |
| 2010 | £213,684 | 1% |
78 Properties |
| 2009 | £211,746 | 2% |
99 Properties |
| 2008 | £207,339 | -6% |
119 Properties |
| 2007 | £219,340 | 13% |
196 Properties |
| 2006 | £190,555 | 2% |
201 Properties |
| 2005 | £187,234 | - |
199 Properties |
| 2004 | £187,230 | 1% |
415 Properties |
| 2003 | £185,856 | 14% |
429 Properties |
| 2002 | £159,689 | 10% |
469 Properties |
| 2001 | £143,681 | 5% |
244 Properties |
| 2000 | £135,856 | - |
82 Properties |
Property Price per Property Type in Grange Park
Here you can find historic sold price data in order to help with your property search.
The average Property Paid Price for specific property types in the last three years are:
| Property Type | Average Sold Price | Sold Properties |
|---|---|---|
| Semi Detached House | £315,060.00 | 35 Semi Detached Houses |
| Detached House | £435,548.00 | 81 Detached Houses |
| Terraced House | £287,591.00 | 36 Terraced Houses |
| Flat | £193,738.00 | 81 Flats |

