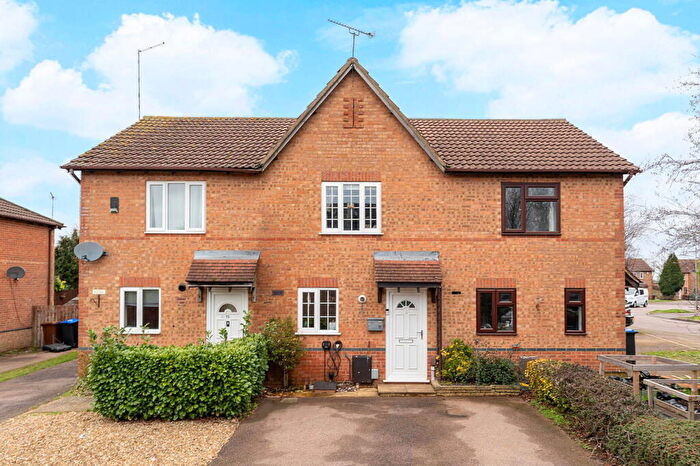
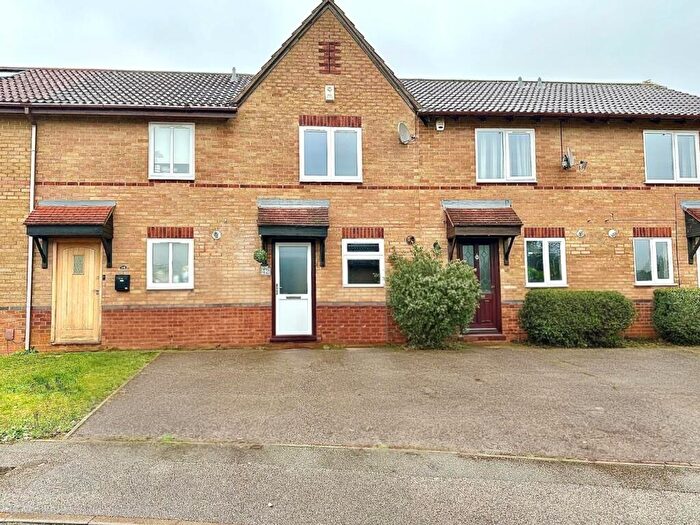
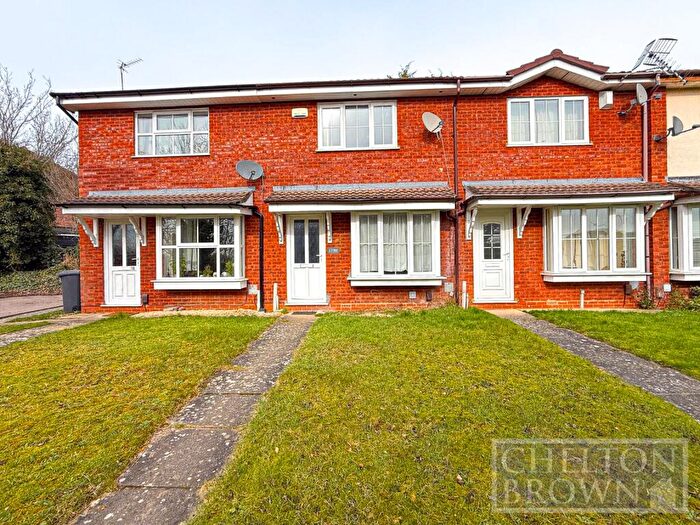
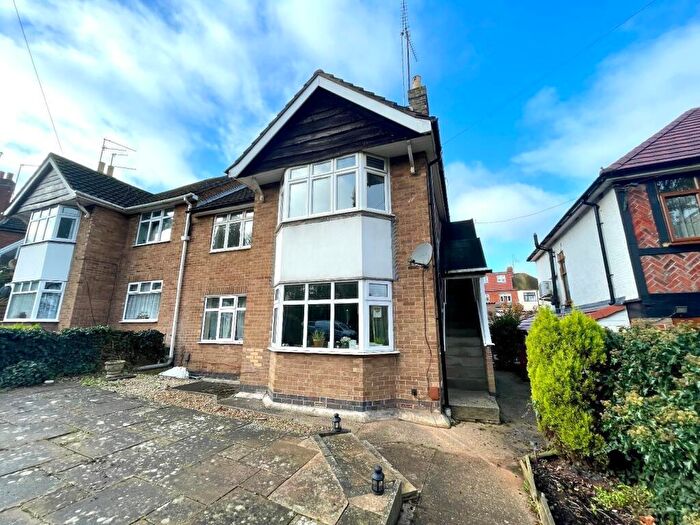
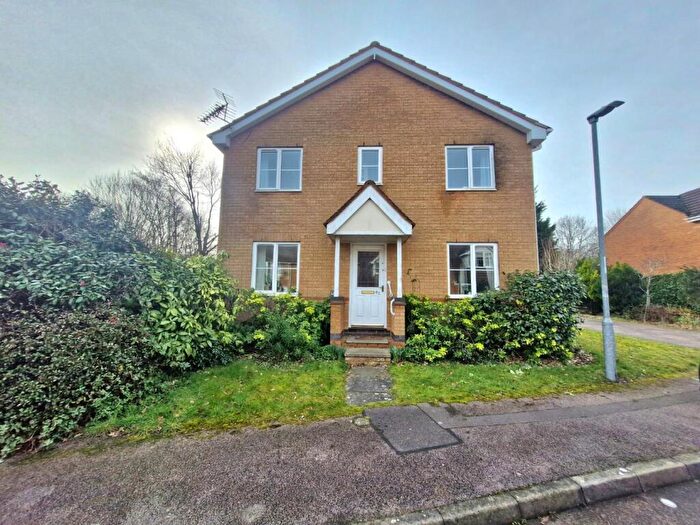
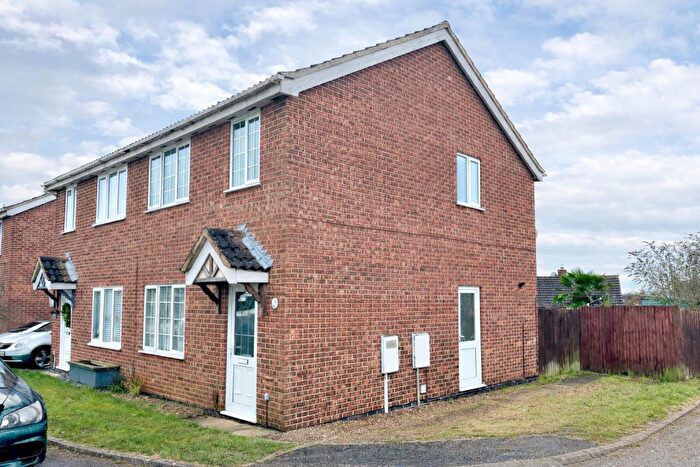
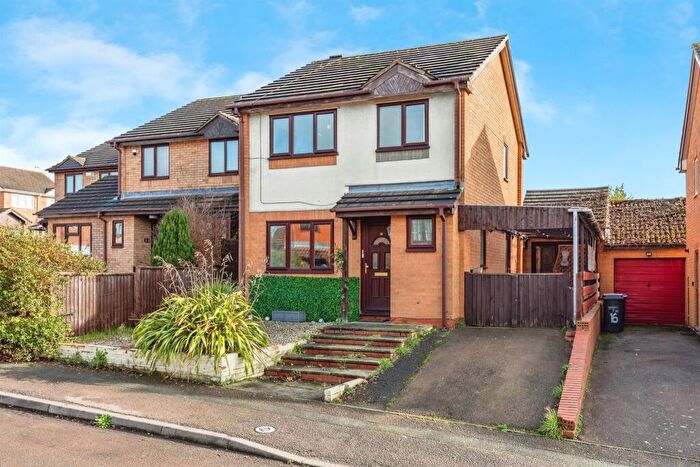
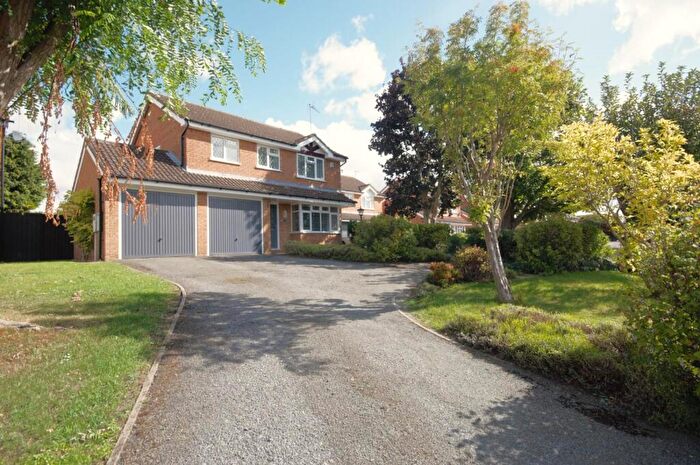
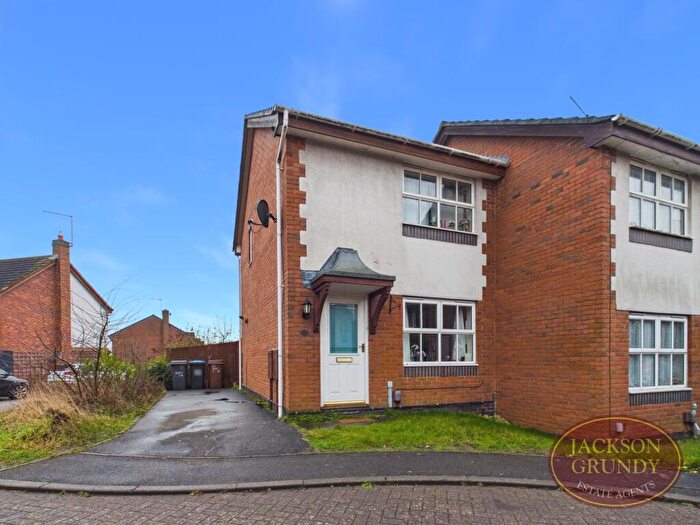
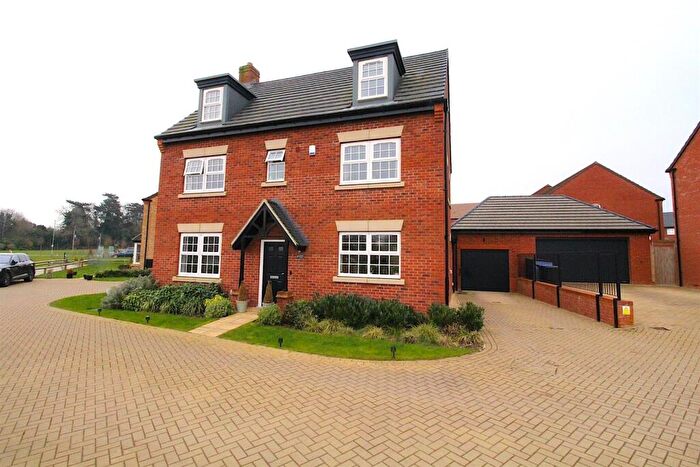
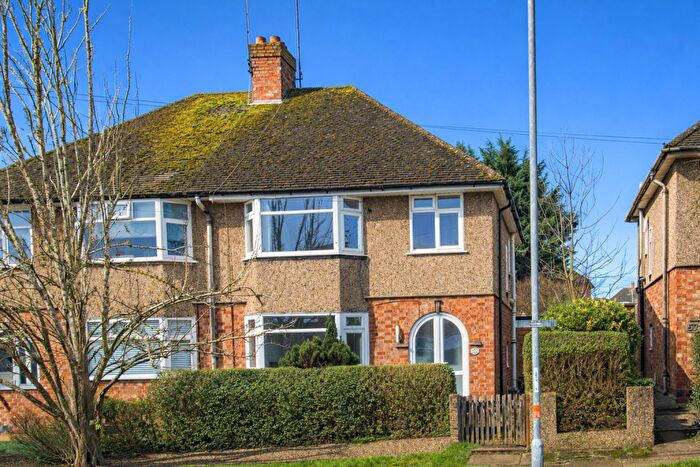
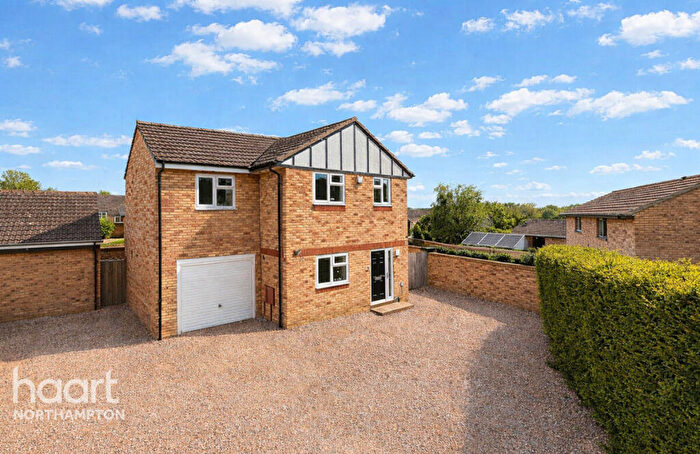
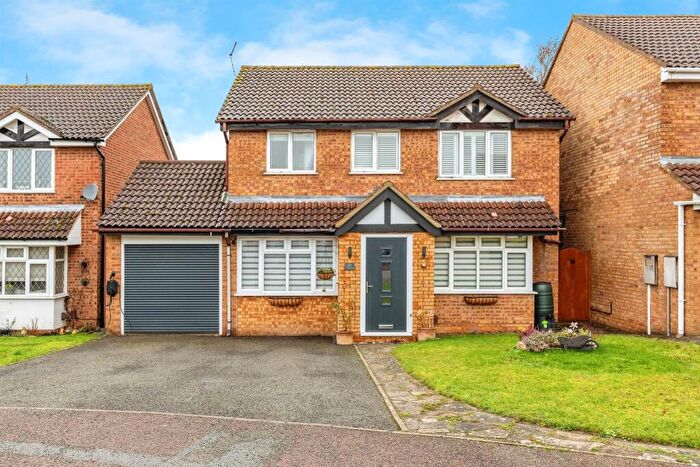
Houses for sale & to rent in East Hunsbury, Northampton
House Prices in East Hunsbury
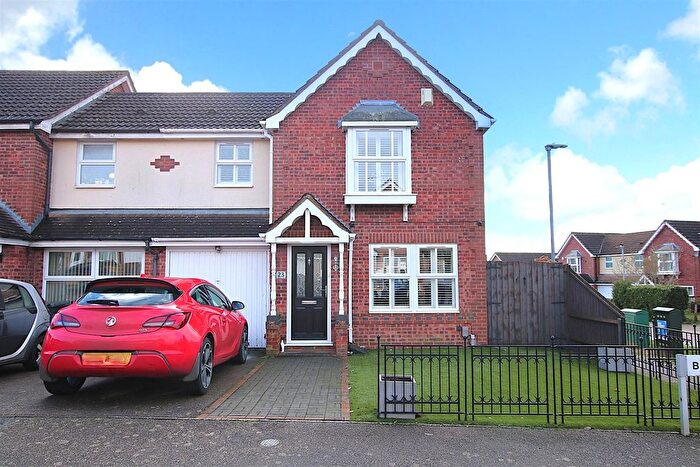
Properties in East Hunsbury have an average house price of £338,544.00 and had 467 Property Transactions within the last 3 years¹.
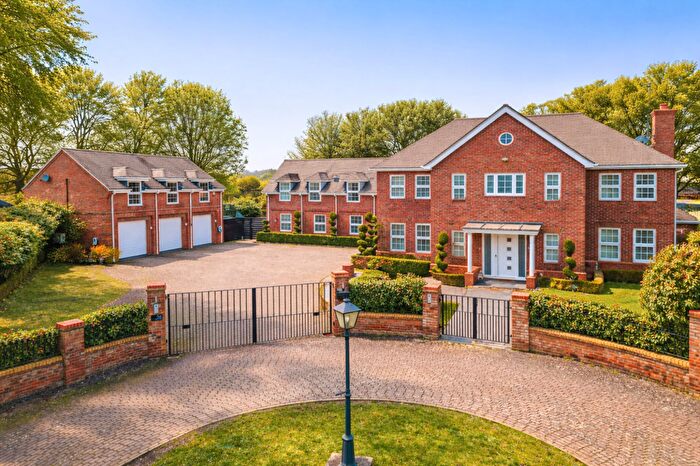
East Hunsbury is an area in Northampton, Northamptonshire with 4,174 households², where the most expensive property was sold for £1,875,000.00.
Properties for sale in East Hunsbury
Roads and Postcodes in East Hunsbury
Navigate through our locations to find the location of your next house in East Hunsbury, Northampton for sale or to rent.
| Streets | Postcodes |
|---|---|
| Ambridge Close | NN4 9RW |
| Augusta Avenue | NN4 0XP |
| Avebury Way | NN4 0QD |
| Bank View | NN4 0RS |
| Barn Owl Close | NN4 0RQ NN4 0UA |
| Basil Close | NN4 0TQ |
| Belfry Lane | NN4 0PB |
| Belton Close | NN4 0FP |
| Blackymore Lane | NN4 0JW |
| Braemar Crescent | NN4 0FG |
| Brashland Drive | NN4 0SS |
| Bressingham Gardens | NN4 0XS |
| Buckingham Close | NN4 0RR |
| Butts Croft Close | NN4 0WP |
| Butts Road | NN4 0UE |
| Cardinal Close | NN4 0RP |
| Chaffinch Close | NN4 0QS |
| Cinnamon Close | NN4 0TU |
| Clannell Road | NN4 0JF NN4 0RX |
| Claregate | NN4 0QZ |
| Collingcroft Close | NN4 0BN |
| Colonial Drive | NN4 0BL |
| Cottesbrooke Gardens | NN4 0DE |
| Crofters Close | NN4 0BJ |
| Denston Close | NN4 0DD |
| Downsway | NN4 0TD |
| East Rising | NN4 0TP |
| Falconers Rise | NN4 0RJ |
| Farmhouse Lane | NN4 9FG |
| Fennel Court | NN4 0SJ |
| Fleetwind Drive | NN4 0ST NN4 0SU |
| Frosty Hollow | NN4 0SY NN4 0UD |
| Granary Court | NN4 0XX |
| Granary Road | NN4 0XA NN4 0XB |
| Grangewood | NN4 0QN |
| Hardwick Road | NN4 0GP |
| Harrier Park | NN4 0QG |
| Hatfield Close | NN4 0FL |
| Hawksnest | NN4 0RH |
| Hedge End | NN4 0SW |
| Hedgeway | NN4 0SP |
| Hidcote Close | NN4 0XQ |
| Hilldrop Road | NN4 0PH |
| Hobby Close | NN4 0RN |
| Hodnet Close | NN4 0XY |
| Kedleston Close | NN4 0WF |
| Kelburn Close | NN4 0RA |
| Kentford Close | NN4 0DB |
| Kimble Close | NN4 0RF |
| Kingfisher Close | NN4 0QT |
| Kites Close | NN4 0QR |
| Lambrook Drive | NN4 0WA |
| Laneside Hollow | NN4 0SR |
| Lapwing Close | NN4 0RT |
| Laurel Valley | NN4 0YU |
| Lichfield Drive | NN4 0QU |
| Limefields Way | NN4 0SA |
| Lindisfarne Way | NN4 0WG NN4 0WH NN4 0WJ NN4 0WL NN4 0WN |
| London Road | NN4 0JN NN4 0TG |
| Longacres | NN4 0QF |
| Longleat Court | NN4 0FN |
| Mannington Gardens | NN4 0XG |
| Marjoram Close | NN4 0SH |
| Marlowe Close | NN4 0QQ |
| Medinah Close | NN4 0YS |
| Meldon Close | NN4 0FJ |
| Mere Close | NN4 0QB |
| Mereway | NN4 8BE NN4 8BH NN4 8BN NN4 8BQ NN4 8BW |
| Merlin Grove | NN4 0QH |
| Muncaster Gardens | NN4 0XH NN4 0XR |
| Oakgrove Place | NN4 0SB |
| Oakmont Close | NN4 0BP |
| Olympia Close | NN4 0RU |
| Osprey Rise | NN4 0TA |
| Overslade Close | NN4 0RZ |
| Oxburgh Court | NN4 0FH |
| Penn Gardens | NN4 0QX |
| Penvale Road | NN4 0QW |
| Peppercorn Way | NN4 0TT |
| Peregrine Place | NN4 0SL |
| Pyghtle Way | NN4 0QJ |
| Rakestone Close | NN4 0TX |
| Ravens Croft | NN4 0RL |
| Rea Close | NN4 0RE |
| Rockcroft | NN4 0UB |
| Rosemoor Drive | NN4 0XD |
| Rowtree Road | NN4 0NY |
| Rushy End | NN4 0TE |
| Saffron Close | NN4 0SG |
| Sandhurst Close | NN4 0DA |
| Sandover | NN4 0TS |
| Savill Close | NN4 0TZ |
| Scotney Close | NN4 0WD |
| Shard Close | NN4 0SE |
| Shatterstone | NN4 0TW |
| Shedfield Way | NN4 0SD |
| Shoal Creek | NN4 0YT |
| Skipton Close | NN4 0RB |
| South Copse | NN4 0RY |
| Springbanks Way | NN4 0QA |
| Spyglass Hill | NN4 0US |
| Stagshaw Close | NN4 0WE |
| Stanford Way | NN4 0FQ |
| Stourhead Drive | NN4 0UH |
| Summit Rise | NN4 0SX |
| Swallow Close | NN4 0QL |
| Tanglewood | NN4 0YW |
| Tapeley Gardens | NN4 0XE |
| Tarragon Way | NN4 0SF |
| Thames Road | NN4 0RD |
| The Hayride | NN4 0QY |
| The Weavers | NN4 0PQ NN4 0PU |
| Tiffany Gardens | NN4 0TJ |
| Trentham Close | NN4 0WB |
| Turnberry Lane | NN4 0PA |
| Verdant Vale | NN4 0SQ |
| Wakehurst Drive | NN4 0TN |
| Wayside Acres | NN4 0QE |
| West Rising | NN4 0TR |
| Wildern Lane | NN4 0SN |
| Windingbrook Lane | NN4 0XF NN4 0XL NN4 0XN NN4 0EB |
| Wisley Close | NN4 0XJ |
| Woodpecker Way | NN4 0QP NN4 0UP |
| Wootton Brook Close | NN4 0XU |
| Wootton Hall Park | NN4 0JA NN4 0JH NN4 0GB |
| Wootton Hill Farm | NN4 9JJ |
| Wootton Park | NN4 0JQ |
| Yeoman Meadow | NN4 9YU NN4 9YX |
| NN4 0HZ |
Transport near East Hunsbury
-
Northampton Station
-
Long Buckby Station
-
Wolverton Station
-
Wellingborough Station
-
Milton Keynes Central Station
-
Kettering Station
- FAQ
- Price Paid By Year
- Property Type Price
Frequently asked questions about East Hunsbury
What is the average price for a property for sale in East Hunsbury?
The average price for a property for sale in East Hunsbury is £338,544. This amount is 18% higher than the average price in Northampton. There are 1,277 property listings for sale in East Hunsbury.
What streets have the most expensive properties for sale in East Hunsbury?
The streets with the most expensive properties for sale in East Hunsbury are Laurel Valley at an average of £1,315,000, Farmhouse Lane at an average of £1,250,000 and Medinah Close at an average of £1,237,500.
What streets have the most affordable properties for sale in East Hunsbury?
The streets with the most affordable properties for sale in East Hunsbury are Woodpecker Way at an average of £183,892, Wootton Brook Close at an average of £196,205 and Belton Close at an average of £202,000.
Which train stations are available in or near East Hunsbury?
Some of the train stations available in or near East Hunsbury are Northampton, Long Buckby and Wolverton.
Property Price Paid in East Hunsbury by Year
The average sold property price by year was:
| Year | Average Sold Price | Price Change |
Sold Properties
|
|---|---|---|---|
| 2025 | £328,291 | -2% |
158 Properties |
| 2024 | £335,709 | -5% |
163 Properties |
| 2023 | £352,803 | 3% |
146 Properties |
| 2022 | £343,482 | 11% |
196 Properties |
| 2021 | £304,604 | 14% |
203 Properties |
| 2020 | £261,326 | -8% |
169 Properties |
| 2019 | £281,405 | -5% |
169 Properties |
| 2018 | £295,838 | 4% |
179 Properties |
| 2017 | £284,542 | 9% |
192 Properties |
| 2016 | £258,100 | 8% |
228 Properties |
| 2015 | £238,448 | 12% |
243 Properties |
| 2014 | £210,830 | 2% |
218 Properties |
| 2013 | £206,697 | 5% |
198 Properties |
| 2012 | £196,834 | 3% |
150 Properties |
| 2011 | £190,075 | -4% |
153 Properties |
| 2010 | £197,662 | 7% |
165 Properties |
| 2009 | £183,649 | -10% |
154 Properties |
| 2008 | £201,207 | -2% |
186 Properties |
| 2007 | £205,413 | 8% |
328 Properties |
| 2006 | £189,663 | 7% |
392 Properties |
| 2005 | £176,337 | 3% |
330 Properties |
| 2004 | £171,003 | 11% |
381 Properties |
| 2003 | £152,455 | 13% |
391 Properties |
| 2002 | £131,985 | 15% |
502 Properties |
| 2001 | £111,715 | 4% |
506 Properties |
| 2000 | £107,479 | 19% |
476 Properties |
| 1999 | £86,847 | 8% |
579 Properties |
| 1998 | £79,940 | 7% |
562 Properties |
| 1997 | £74,736 | 5% |
518 Properties |
| 1996 | £71,213 | 12% |
465 Properties |
| 1995 | £62,603 | - |
423 Properties |
Property Price per Property Type in East Hunsbury
Here you can find historic sold price data in order to help with your property search.
The average Property Paid Price for specific property types in the last three years are:
| Property Type | Average Sold Price | Sold Properties |
|---|---|---|
| Semi Detached House | £266,259.00 | 127 Semi Detached Houses |
| Detached House | £428,109.00 | 245 Detached Houses |
| Terraced House | £215,659.00 | 77 Terraced Houses |
| Flat | £155,138.00 | 18 Flats |

