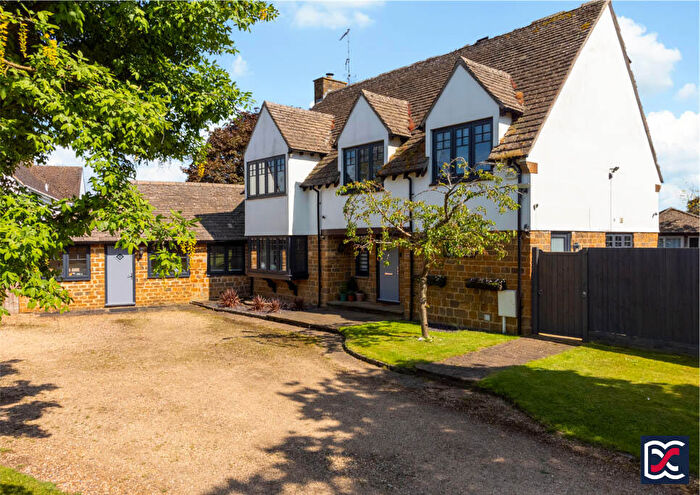
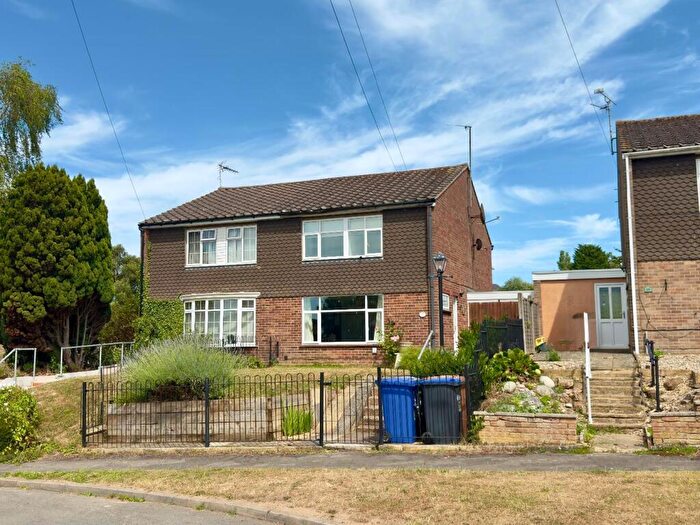
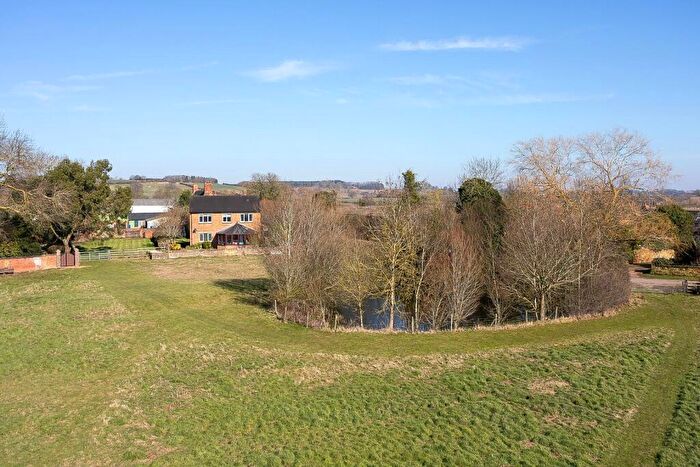
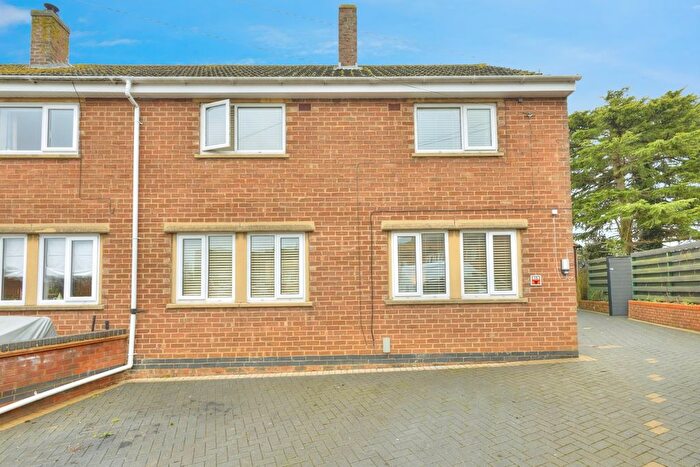
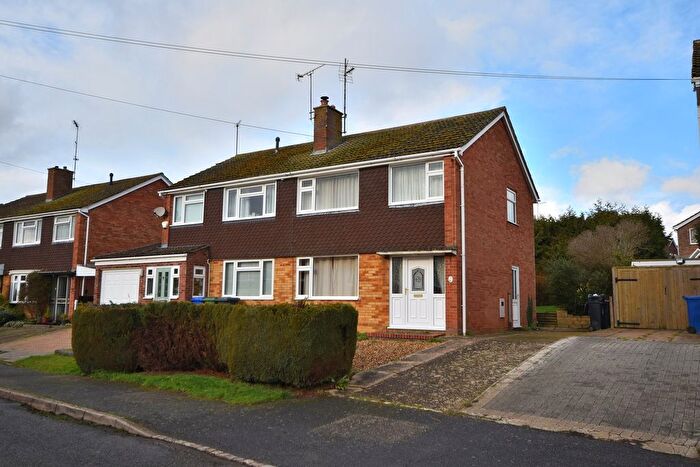
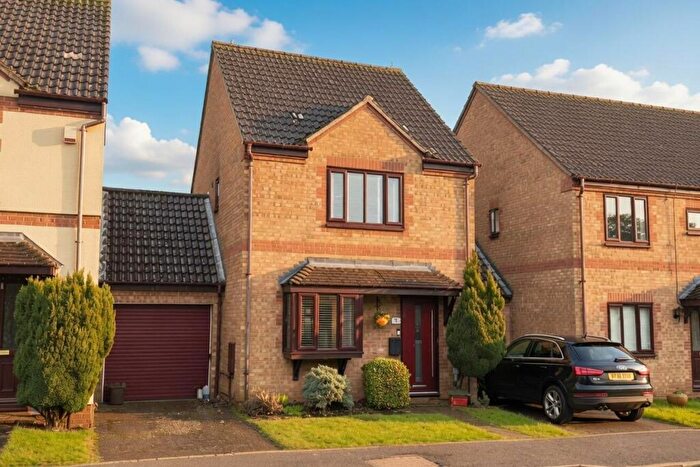
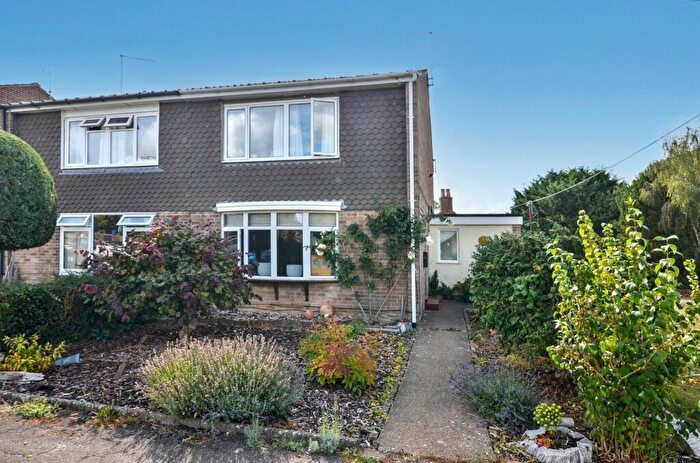
Houses for sale & to rent in Heyfords And Bugbrooke, Northampton
House Prices in Heyfords And Bugbrooke
Properties in Heyfords And Bugbrooke have an average house price of £381,857.00 and had 144 Property Transactions within the last 3 years¹.
Heyfords And Bugbrooke is an area in Northampton, Northamptonshire with 1,737 households², where the most expensive property was sold for £1,500,000.00.
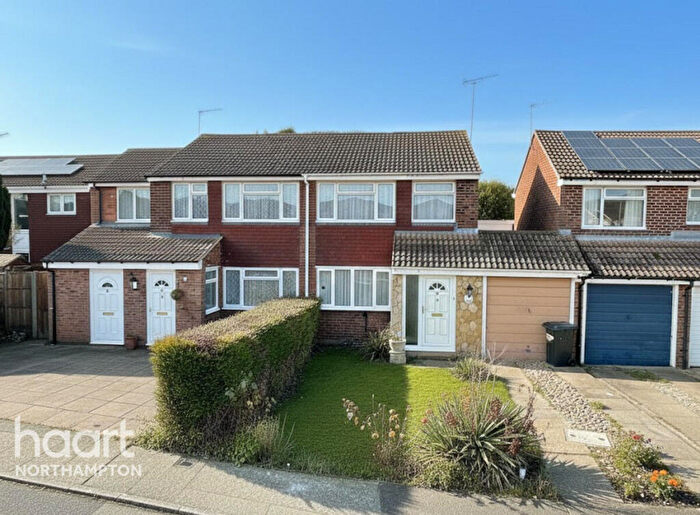
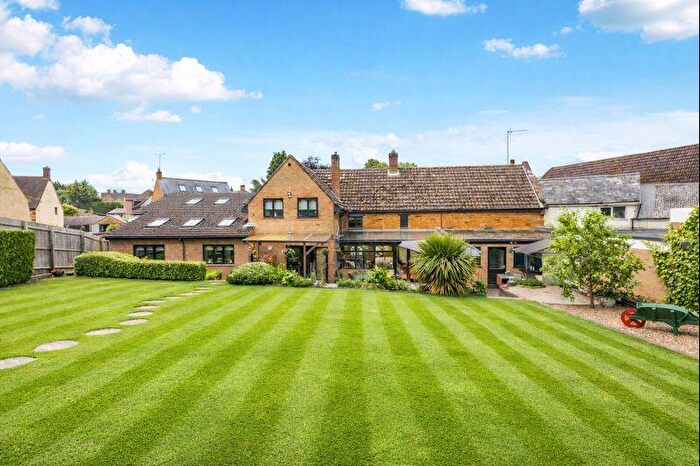
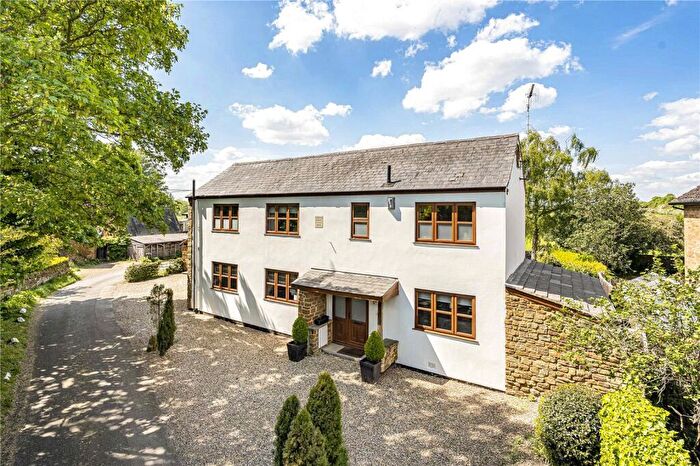
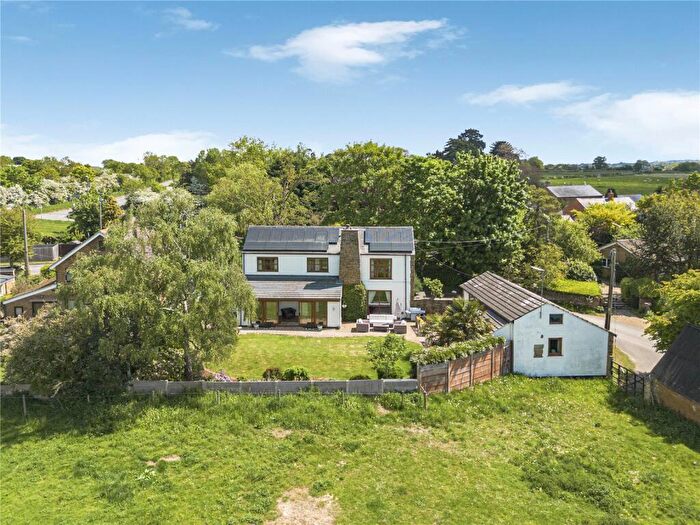
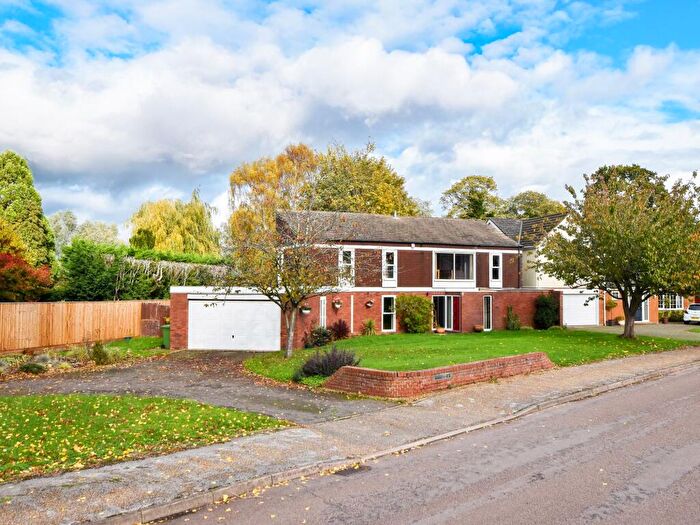
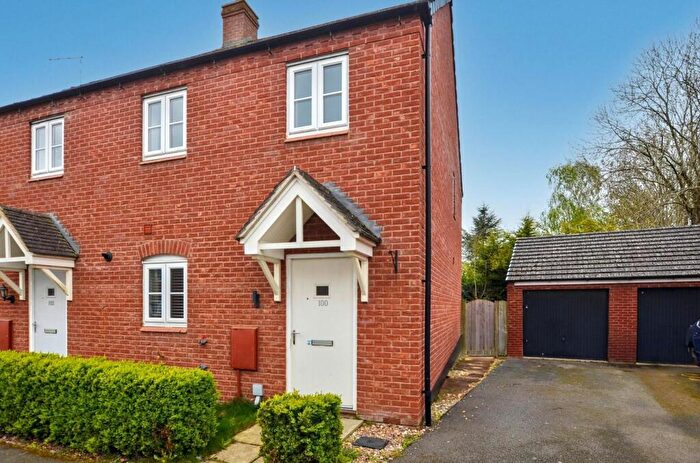
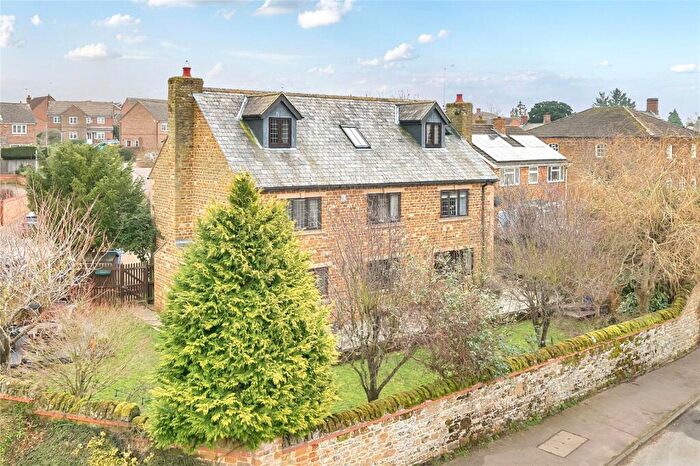
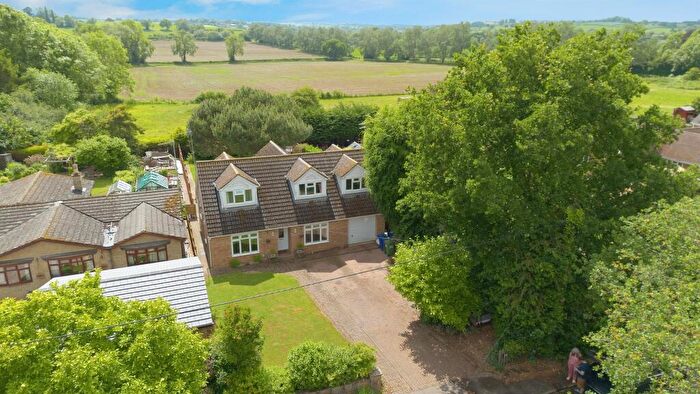
Properties for sale in Heyfords And Bugbrooke
Previously listed properties in Heyfords And Bugbrooke
Roads and Postcodes in Heyfords And Bugbrooke
Navigate through our locations to find the location of your next house in Heyfords And Bugbrooke, Northampton for sale or to rent.
| Streets | Postcodes |
|---|---|
| Ace Lane | NN7 3PQ |
| Almond Close | NN7 3QX |
| Ash Grove | NN7 3RA |
| Badgers Close | NN7 3BA |
| Baptists Close | NN7 3RJ |
| Beech Close | NN7 3RB |
| Bliss Close | NN7 3ND |
| Brookside Place | NN7 3NL |
| Bugbrooke Road | NN7 3LT NN7 3NP |
| Butts Hill Crescent | NN7 3QP |
| Camp Close | NN7 3RW |
| Camp Hill | NN7 3PH |
| Chipsey Avenue | NN7 3QW |
| Church Lane | NN7 3LQ NN7 3PB NN7 3PD |
| Church Street | NN7 3LH |
| Close Road | NN7 3LW |
| Cub Close | NN7 3GA |
| Daventry Link Road | NN7 3NT |
| Furnace Lane | NN7 3JS NN7 3JT NN7 3JZ NN7 3JY NN7 3LA NN7 3LB |
| Georges Avenue | NN7 3PP NN7 3PW |
| Georges Close | NN7 3PR |
| Grants Orchard | NN7 3RL |
| Great Lane | NN7 3PE |
| Hall Mead Court | NN7 3RX |
| Harrison Court | NN7 3ET |
| Hazel Close | NN7 3GB |
| Heyford Lane | NN7 4SF |
| Heyford Road | NN7 3RF |
| High Street | NN7 3PA NN7 3PG NN7 3QF NN7 4LP |
| Hillside Crescent | NN7 3LS |
| Hillside Road | NN7 3JU NN7 3LR |
| Homestead Drive | NN7 3QY |
| Horsa Close | NN7 3NS |
| Johns Road | NN7 3PY NN7 3PZ NN7 3QL NN7 3GD |
| Kislingbury Road | NN7 3QG |
| Laddermakers Yard | NN7 3RG |
| Langfurlong | NN7 3FA |
| Levitts Road | NN7 3QN |
| Lime Grove | NN7 3QZ |
| Link Way | NN7 3PS |
| Litchborough Road | NN7 3QD |
| Main Road | NN7 3LZ NN7 3NA NN7 3LY |
| Manor Park | NN7 3NN |
| Manor Walk | NN7 3LJ |
| Maple Close | NN7 3RE |
| Meadway | NN7 3PL NN7 3RN |
| Middle Street | NN7 3LL |
| Mill Lane | NN7 3QQ |
| Moores Close | NN7 3PN |
| Oaklands | NN7 3QS NN7 3QU |
| Parsons Close | NN7 3NJ |
| Peace Hill | NN7 3RD |
| Pilgrims Lane | NN7 3PJ |
| Pound Lane | NN7 3RH |
| Quakers Close | NN7 3NZ |
| Railway Cottages | NN7 3LD |
| Ridgeway Furlong | NN7 3GH |
| Roberts Field | NN7 3BE |
| Rolfe Crescent | NN7 3NG |
| Shepherds Walk | NN7 3PU |
| Smither Way | NN7 3PT |
| South View | NN7 3NH |
| Spencer Close | NN7 3RQ |
| The Anvil | NN7 3PX |
| The Ashes | NN7 3JP |
| The Glebe | NN7 3NR |
| The Green | NN7 3LE |
| The Leys | NN7 3HX |
| The Paddocks | NN7 3QR |
| The Peak | NN7 3LP |
| The Pound | NN7 3NW |
| The Wharf | NN7 3QB |
| Tibbs Way | NN7 3RU |
| Waggoners Way | NN7 3QT |
| Wakefield Way | NN7 3LU |
| Watery Lane | NN7 3LN |
| Watling Street | NN7 4RZ NN7 4SB NN7 4RY NN7 4SA NN7 4SD |
| Weedon Road | NN7 3LF NN7 3LG |
| West End | NN7 3PF |
| Western Avenue | NN7 3NQ |
| Winston Close | NN7 3JX |
| NN7 3HW NN7 3LX NN7 3NB NN7 3NE NN7 3NF NN7 3QH |
Transport near Heyfords And Bugbrooke
- FAQ
- Price Paid By Year
- Property Type Price
Frequently asked questions about Heyfords And Bugbrooke
What is the average price for a property for sale in Heyfords And Bugbrooke?
The average price for a property for sale in Heyfords And Bugbrooke is £381,857. This amount is 33% higher than the average price in Northampton. There are 211 property listings for sale in Heyfords And Bugbrooke.
What streets have the most expensive properties for sale in Heyfords And Bugbrooke?
The streets with the most expensive properties for sale in Heyfords And Bugbrooke are The Paddocks at an average of £670,000, Middle Street at an average of £664,285 and Pilgrims Lane at an average of £560,000.
What streets have the most affordable properties for sale in Heyfords And Bugbrooke?
The streets with the most affordable properties for sale in Heyfords And Bugbrooke are Bliss Close at an average of £104,000, Johns Road at an average of £222,400 and Tibbs Way at an average of £240,000.
Which train stations are available in or near Heyfords And Bugbrooke?
Some of the train stations available in or near Heyfords And Bugbrooke are Northampton, Long Buckby and Wolverton.
Property Price Paid in Heyfords And Bugbrooke by Year
The average sold property price by year was:
| Year | Average Sold Price | Price Change |
Sold Properties
|
|---|---|---|---|
| 2025 | £365,629 | -10% |
54 Properties |
| 2024 | £402,186 | 5% |
43 Properties |
| 2023 | £381,903 | -6% |
47 Properties |
| 2022 | £405,555 | 16% |
49 Properties |
| 2021 | £340,026 | 3% |
65 Properties |
| 2020 | £330,319 | -7% |
47 Properties |
| 2019 | £352,903 | 9% |
74 Properties |
| 2018 | £319,925 | 1% |
62 Properties |
| 2017 | £317,238 | 7% |
61 Properties |
| 2016 | £295,540 | -7% |
75 Properties |
| 2015 | £315,569 | 3% |
121 Properties |
| 2014 | £306,451 | 26% |
73 Properties |
| 2013 | £225,886 | -24% |
50 Properties |
| 2012 | £280,269 | 24% |
48 Properties |
| 2011 | £211,678 | -22% |
42 Properties |
| 2010 | £257,802 | 20% |
33 Properties |
| 2009 | £207,264 | -9% |
34 Properties |
| 2008 | £226,913 | -11% |
29 Properties |
| 2007 | £252,831 | 5% |
76 Properties |
| 2006 | £239,444 | 7% |
73 Properties |
| 2005 | £223,313 | 12% |
74 Properties |
| 2004 | £197,481 | 8% |
65 Properties |
| 2003 | £181,741 | 20% |
48 Properties |
| 2002 | £144,643 | 2% |
79 Properties |
| 2001 | £142,166 | 18% |
80 Properties |
| 2000 | £116,742 | 6% |
66 Properties |
| 1999 | £109,884 | 16% |
83 Properties |
| 1998 | £92,018 | 13% |
93 Properties |
| 1997 | £80,200 | 8% |
79 Properties |
| 1996 | £74,035 | -6% |
62 Properties |
| 1995 | £78,456 | - |
63 Properties |
Property Price per Property Type in Heyfords And Bugbrooke
Here you can find historic sold price data in order to help with your property search.
The average Property Paid Price for specific property types in the last three years are:
| Property Type | Average Sold Price | Sold Properties |
|---|---|---|
| Semi Detached House | £297,594.00 | 53 Semi Detached Houses |
| Detached House | £476,235.00 | 72 Detached Houses |
| Terraced House | £264,970.00 | 17 Terraced Houses |
| Flat | £210,750.00 | 2 Flats |

