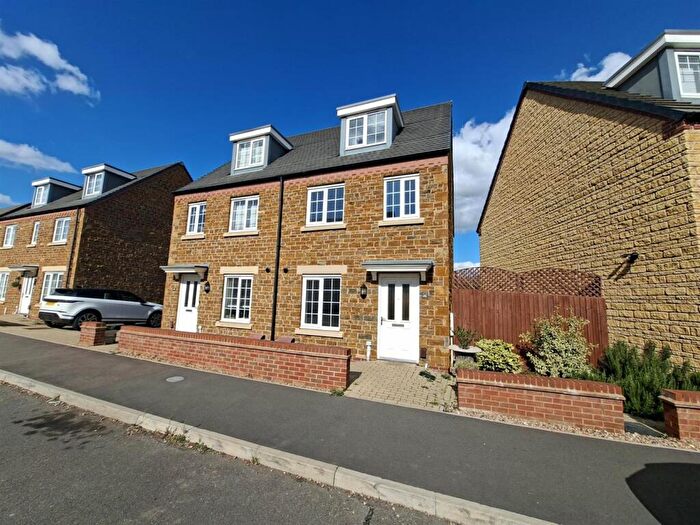
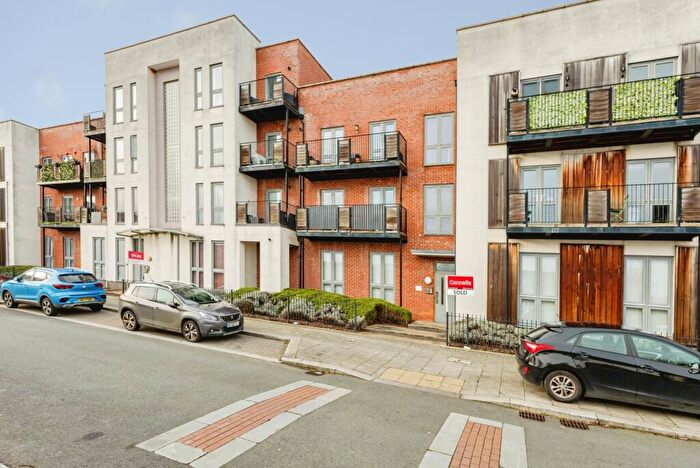
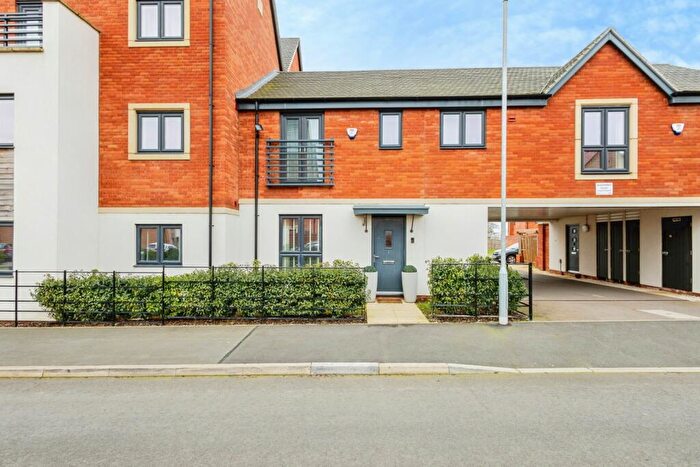
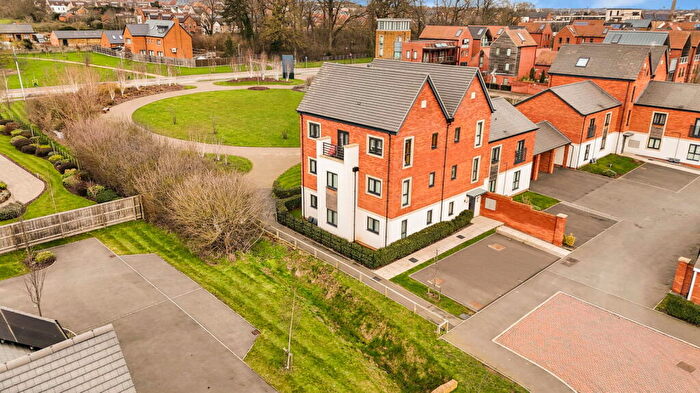
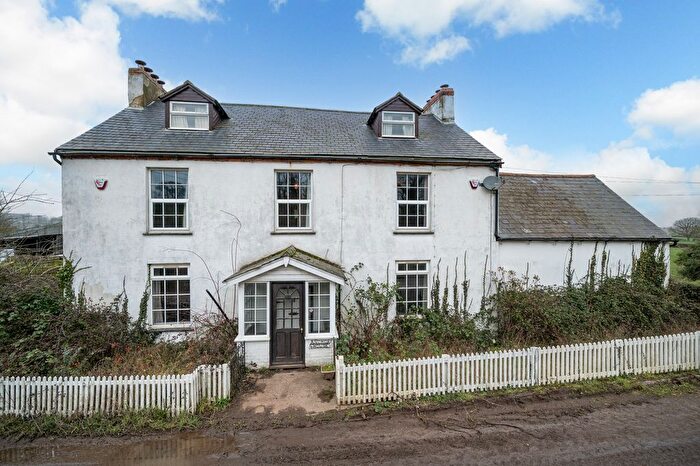
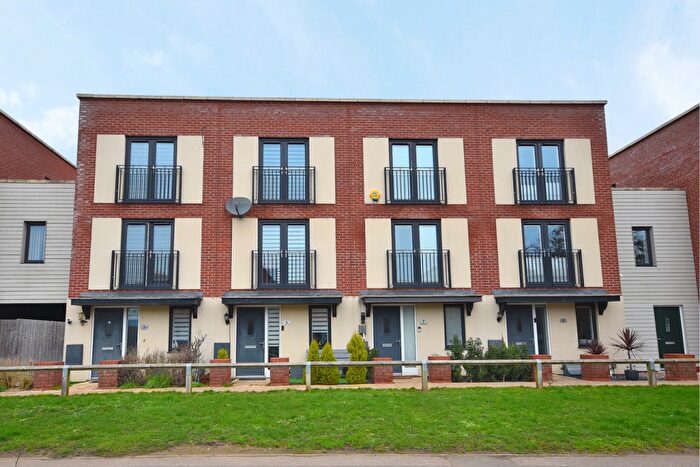
Houses for sale & to rent in Harpole And Grange, Northampton
House Prices in Harpole And Grange
Properties in Harpole And Grange have an average house price of £424,175.00 and had 168 Property Transactions within the last 3 years¹.
Harpole And Grange is an area in Northampton, Northamptonshire with 1,863 households², where the most expensive property was sold for £1,900,000.00.
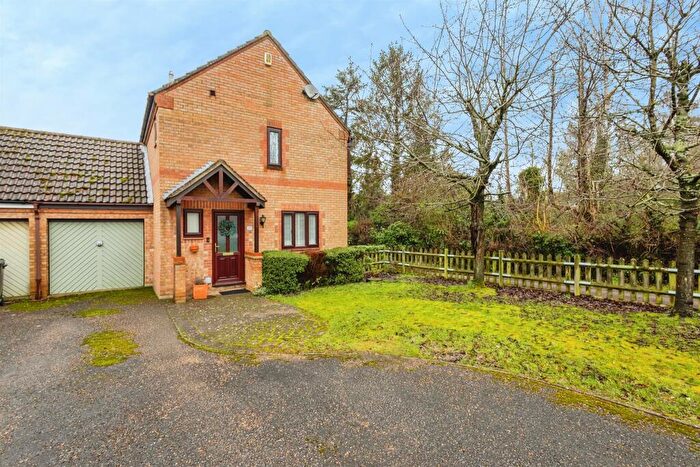
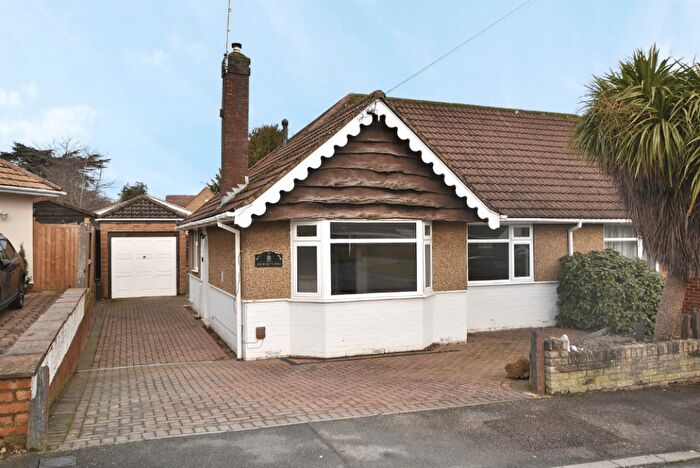
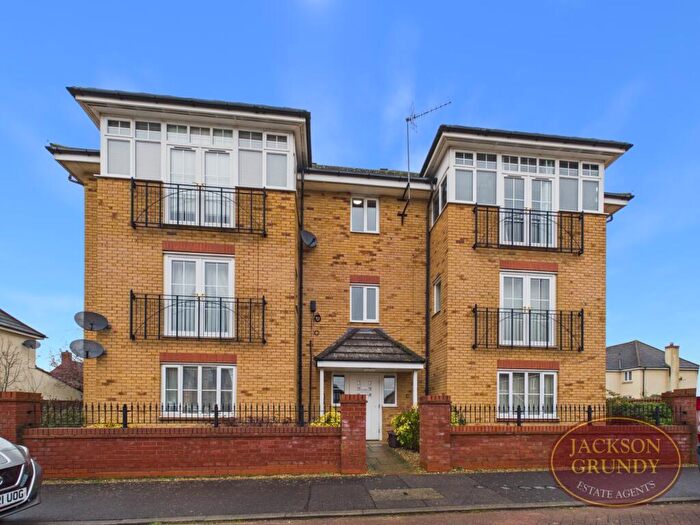
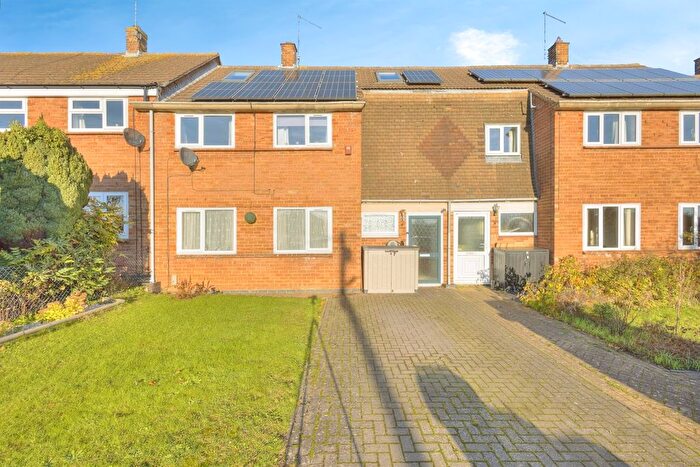
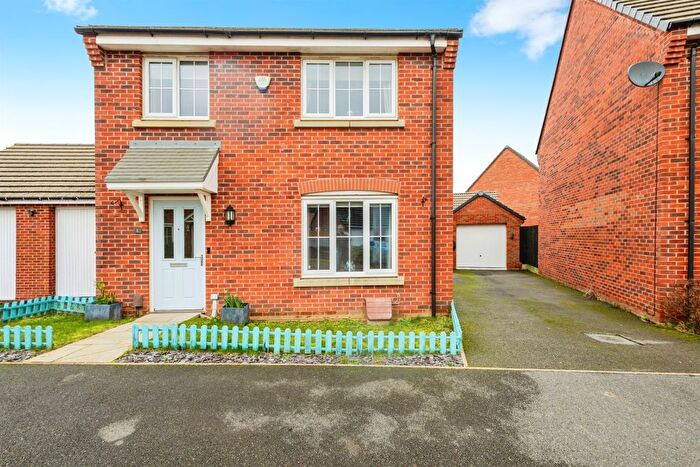
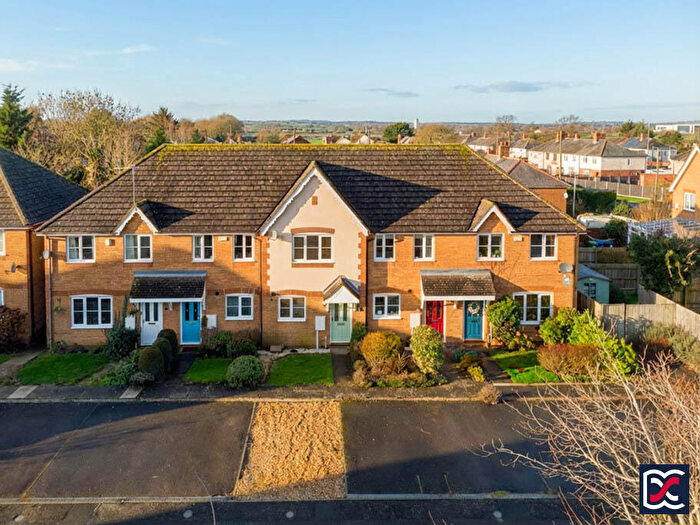
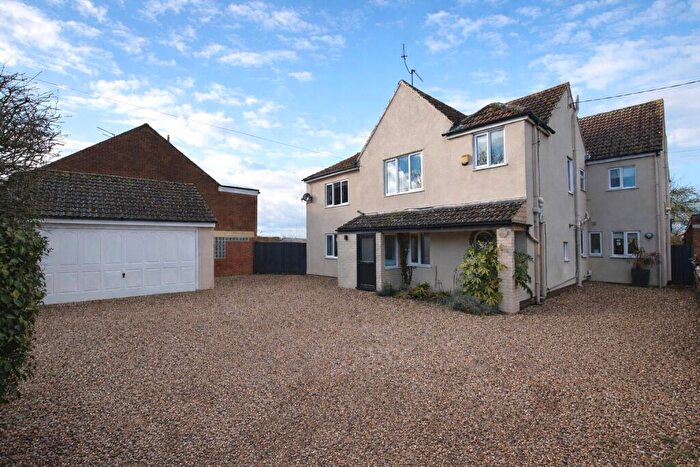
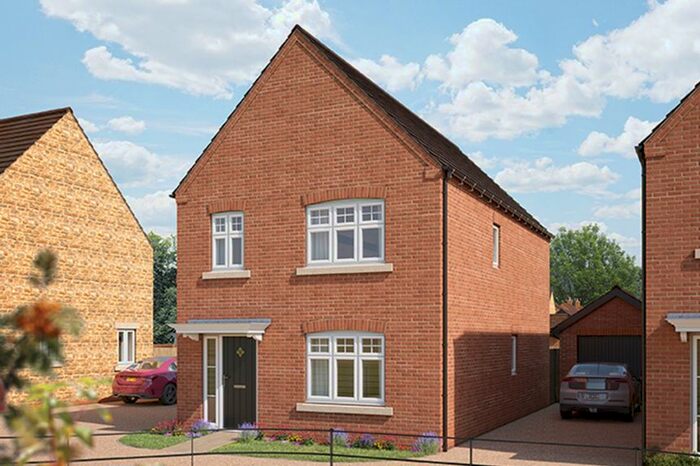
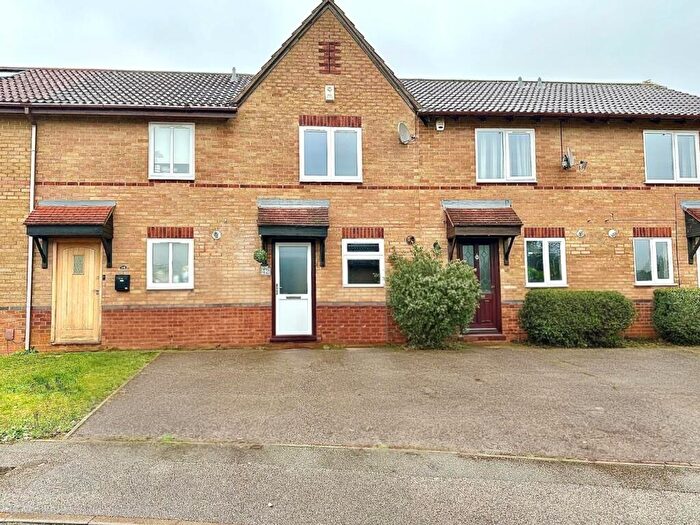
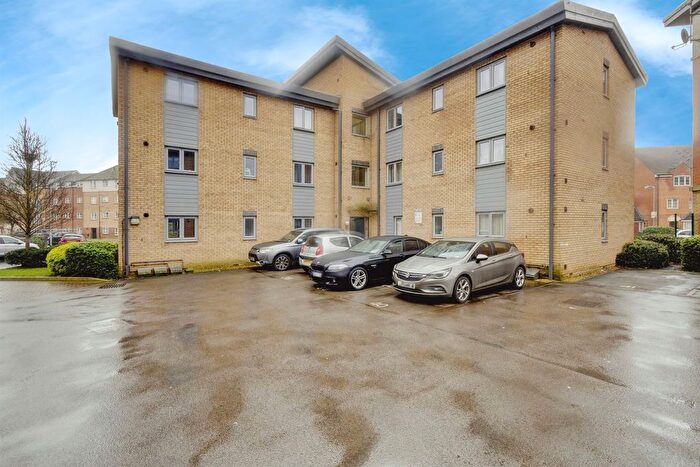
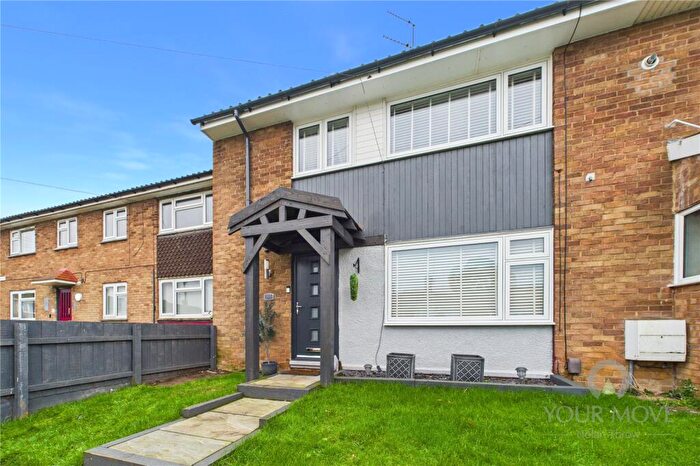
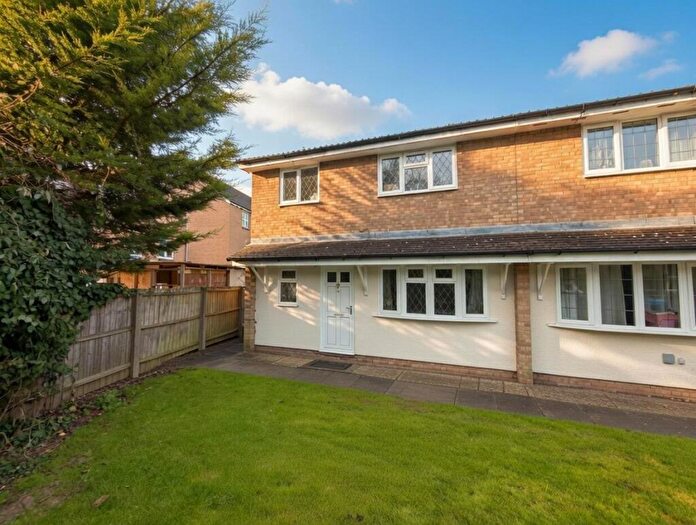
Properties for sale in Harpole And Grange
Roads and Postcodes in Harpole And Grange
Navigate through our locations to find the location of your next house in Harpole And Grange, Northampton for sale or to rent.
| Streets | Postcodes |
|---|---|
| Ardens Grove | NN7 3JJ |
| Ash Lane | NN4 0NB |
| Ashby Court | NN7 4JE |
| Back Lane | NN7 3EX |
| Baker Street | NN7 3EZ |
| Ballaster Gardens | NN7 4GH |
| Banbury Lane | NN7 3HY NN7 3JF NN7 3JN |
| Banbury Road | NN7 4AW NN7 4BE |
| Barn Lane | NN7 3AG NN7 3AH |
| Beech Lane | NN7 4AL |
| Berry Close | NN7 3JQ |
| Blackberry Close | NN7 4BF |
| Blisworth Road | NN7 3EY NN7 3HL |
| Bugbrooke Road | NN7 3EU NN7 4AY |
| Camp Lane | NN7 4BJ |
| Carrs Way | NN7 4BZ NN7 4DA |
| Chester Avenue | NN7 4DT |
| Chestnut Close | NN7 3HJ |
| Church Close | NN7 3AJ |
| Church Lane | NN7 4AD |
| Church Street | NN7 3JD NN7 3HS |
| Collingtree Road | NN7 3AU NN7 3AF |
| Cory Gardens | NN7 4ES |
| Deans Row | NN7 3HA |
| Duck Lane | NN7 4BU |
| Dukes Green Road | NN7 4AX |
| Eastcote Road | NN7 3HF NN7 3HQ |
| Garners Way | NN7 4DN |
| Gayton Road | NN7 3AA NN7 3AB NN7 4GJ |
| Glassthorpe Lane | NN7 4DU NN7 4DX NN7 4DZ |
| Grafton Way | NN7 3JL |
| Green Street | NN7 3AT |
| Hall Close | NN7 4BQ NN7 4DY |
| High Street | NN7 3AS NN7 3HD NN7 4AG NN7 4AQ NN7 4BS NN7 4DH |
| Hillcrest Road | NN7 3HG |
| Hodges Lane | NN7 4AJ |
| Kislingbury Road | NN7 3HZ NN7 3JA NN7 3SB |
| Larkhall Lane | NN7 4DF NN7 4DP |
| Larkhall Way | NN7 4DW |
| Lichfield Close | NN7 4EQ |
| Lower Road | NN7 3AW |
| Malzor Lane | NN7 3AR |
| Manor Close | NN7 4BX NN7 4BY |
| Mill Lane | NN7 4BD NN7 3QJ |
| Mill Road | NN7 4BB |
| Millers Close | NN7 4BA |
| Milton Court | NN7 3AX |
| Milton Road | NN7 3HE |
| Mount Pleasant | NN7 4DL |
| Mumford Drive | NN7 3JH |
| Nene Way | NN7 4AS |
| Nobottle Road | NN7 4UR |
| North Street | NN7 3JB NN7 3JG |
| Northampton Road | NN7 4DD |
| Orchard Close | NN7 3AY |
| Orchard Way | NN7 4BW |
| Park Lane | NN7 4BT NN7 3HB |
| Rectory Lane | NN7 3AQ |
| Riverside Court | NN7 4AF |
| Rothersthorpe Motorway Services Area | NN4 9QS |
| Rothersthorpe Road | NN7 4AA |
| Sandy Lane | NN7 4AP NN7 4DG |
| School Lane | NN7 4AN NN7 4DR |
| Shepherds Walk | NN7 4DB |
| South View | NN7 4AR |
| St Johns Close | NN7 3BH |
| St Marys Court | NN7 3HP |
| Starmers Lane | NN7 4AE |
| Stockwell Road | NN7 3AN |
| Stockwell Way | NN7 3AL |
| The Green | NN7 4AH |
| The Lane | NN7 3JE |
| The Motts | NN7 4DS |
| The Orchard | NN7 4BG |
| Tiffield Road | NN7 3HH |
| Towcester Road | NN7 3AE NN7 3AP NN7 3AZ |
| Twigden Road | NN7 4AZ |
| Upper High Street | NN7 4DJ |
| Watts Close | NN7 4JH |
| Weedon Road | NN7 4DE |
| Willow View | NN7 4AT NN7 4AU |
| Wrights Lane | NN7 3ES |
| NN7 4AB NN7 3HN NN7 4HD |
Transport near Harpole And Grange
- FAQ
- Price Paid By Year
- Property Type Price
Frequently asked questions about Harpole And Grange
What is the average price for a property for sale in Harpole And Grange?
The average price for a property for sale in Harpole And Grange is £424,175. This amount is 48% higher than the average price in Northampton. There are 7,514 property listings for sale in Harpole And Grange.
What streets have the most expensive properties for sale in Harpole And Grange?
The streets with the most expensive properties for sale in Harpole And Grange are Malzor Lane at an average of £1,245,000, Rectory Lane at an average of £940,000 and Deans Row at an average of £920,000.
What streets have the most affordable properties for sale in Harpole And Grange?
The streets with the most affordable properties for sale in Harpole And Grange are Willow View at an average of £240,000, Cory Gardens at an average of £240,000 and Berry Close at an average of £257,500.
Which train stations are available in or near Harpole And Grange?
Some of the train stations available in or near Harpole And Grange are Northampton, Long Buckby and Wolverton.
Property Price Paid in Harpole And Grange by Year
The average sold property price by year was:
| Year | Average Sold Price | Price Change |
Sold Properties
|
|---|---|---|---|
| 2025 | £437,472 | 3% |
53 Properties |
| 2024 | £423,572 | 4% |
76 Properties |
| 2023 | £407,279 | -18% |
39 Properties |
| 2022 | £481,126 | 11% |
61 Properties |
| 2021 | £426,553 | 11% |
79 Properties |
| 2020 | £381,703 | 11% |
55 Properties |
| 2019 | £338,558 | -16% |
43 Properties |
| 2018 | £391,236 | 5% |
56 Properties |
| 2017 | £373,529 | 11% |
69 Properties |
| 2016 | £334,136 | -9% |
62 Properties |
| 2015 | £364,116 | 17% |
83 Properties |
| 2014 | £301,907 | 1% |
62 Properties |
| 2013 | £300,240 | 1% |
69 Properties |
| 2012 | £297,510 | -5% |
47 Properties |
| 2011 | £311,090 | 20% |
54 Properties |
| 2010 | £249,730 | 3% |
54 Properties |
| 2009 | £241,711 | -9% |
47 Properties |
| 2008 | £262,774 | -7% |
59 Properties |
| 2007 | £281,704 | 8% |
73 Properties |
| 2006 | £259,321 | 15% |
77 Properties |
| 2005 | £220,266 | 3% |
67 Properties |
| 2004 | £213,536 | -9% |
86 Properties |
| 2003 | £233,565 | 20% |
76 Properties |
| 2002 | £186,990 | 21% |
73 Properties |
| 2001 | £148,359 | 4% |
72 Properties |
| 2000 | £142,854 | 17% |
86 Properties |
| 1999 | £119,071 | 4% |
92 Properties |
| 1998 | £114,857 | 11% |
88 Properties |
| 1997 | £102,193 | 12% |
92 Properties |
| 1996 | £89,716 | 2% |
80 Properties |
| 1995 | £87,872 | - |
71 Properties |
Property Price per Property Type in Harpole And Grange
Here you can find historic sold price data in order to help with your property search.
The average Property Paid Price for specific property types in the last three years are:
| Property Type | Average Sold Price | Sold Properties |
|---|---|---|
| Semi Detached House | £340,092.00 | 69 Semi Detached Houses |
| Detached House | £553,514.00 | 73 Detached Houses |
| Terraced House | £294,434.00 | 23 Terraced Houses |
| Flat | £205,498.00 | 3 Flats |

