Houses for sale & to rent in West, Northampton
House Prices in West
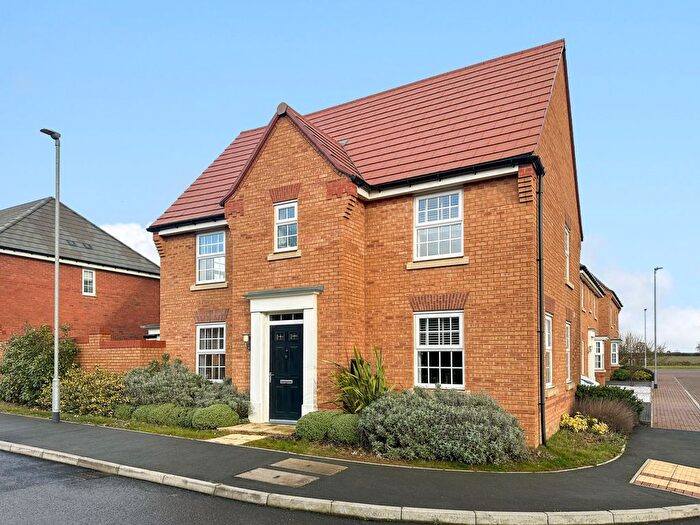
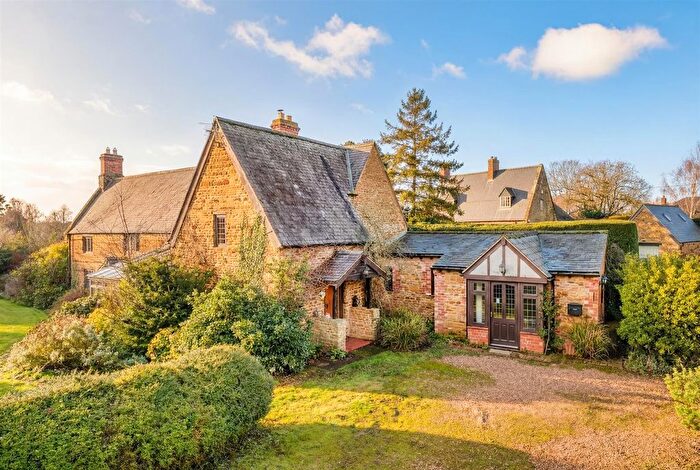
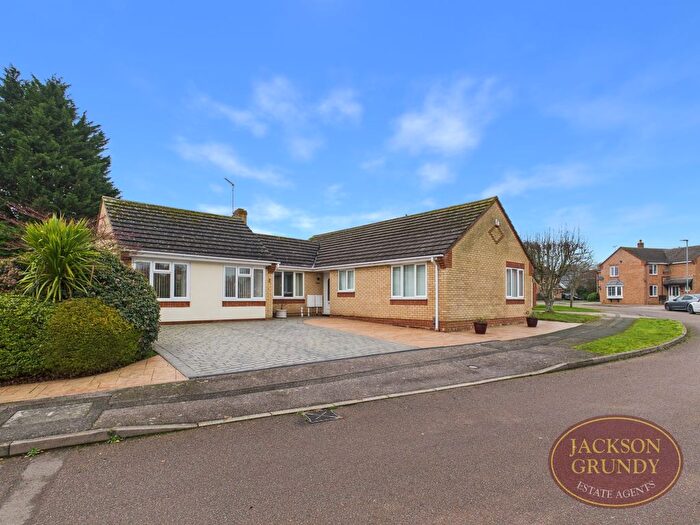
Properties in West have an average house price of £429,417.00 and had 56 Property Transactions within the last 3 years¹.
West is an area in Northampton, Northamptonshire with 672 households², where the most expensive property was sold for £1,250,000.00.
Properties for sale in West
Roads and Postcodes in West
Navigate through our locations to find the location of your next house in West, Northampton for sale or to rent.
| Streets | Postcodes |
|---|---|
| Bakehouse Lane | NN6 0ED |
| Barton Fields | NN6 0BF |
| Blacksmiths Yard | NN6 0QD |
| Brembridge Close | NN6 0AU |
| Church Street | NN6 0DN |
| Church View | NN6 0QL |
| Church Way | NN6 0QE |
| Dale Close | NN6 0EH |
| Duchess End | NN6 0EB |
| Earls Barton Road | NN6 0DR |
| Ecton Lane | NN6 0BA NN6 0BB |
| Franklins Close | NN6 0QG |
| Glebe Road | NN6 0DL NN6 0DP |
| High Street | NN6 0QA NN6 0QB |
| Highfield Road | NN6 0EA |
| Holcot Lane | NN6 0BE NN6 0BG |
| Ladys Lane | NN6 0EF |
| Manor Road | NN6 0DU |
| North Street | NN6 0DW |
| Northampton Road | NN6 0QQ |
| Nursery Court | NN6 0EG |
| Overstone Road | NN6 0AW |
| Paddock Lane | NN6 0EQ |
| Park Close | NN6 0AX |
| Parsons Close | NN6 0QJ |
| Pie Corner | NN6 0AY |
| Stonelea Road | NN6 0AZ |
| Sywell Airport Business Park | NN6 0BN |
| Sywell Lane | NN6 0QT |
| Tinkers Crescent | NN6 0DS |
| Vicarage Lane | NN6 0EE |
| Washbrook Lane | NN6 0QX |
| Wellingborough Road | NN6 0DZ NN6 0QH |
| West Street | NN6 0QF |
| Westlea Road | NN6 0BY |
| Wilby Road | NN6 0DX |
| Woodford Chase | NN6 0AR |
| NN6 0BQ |
Transport near West
- FAQ
- Price Paid By Year
- Property Type Price
Frequently asked questions about West
What is the average price for a property for sale in West?
The average price for a property for sale in West is £429,417. This amount is 50% higher than the average price in Northampton. There are 1,684 property listings for sale in West.
What streets have the most expensive properties for sale in West?
The streets with the most expensive properties for sale in West are North Street at an average of £875,000, Church Street at an average of £765,000 and Nursery Court at an average of £682,500.
What streets have the most affordable properties for sale in West?
The streets with the most affordable properties for sale in West are Stonelea Road at an average of £278,750, Northampton Road at an average of £297,500 and Church View at an average of £314,333.
Which train stations are available in or near West?
Some of the train stations available in or near West are Wellingborough, Northampton and Kettering.
Property Price Paid in West by Year
The average sold property price by year was:
| Year | Average Sold Price | Price Change |
Sold Properties
|
|---|---|---|---|
| 2025 | £447,857 | 3% |
14 Properties |
| 2024 | £433,320 | 4% |
20 Properties |
| 2023 | £414,136 | -52% |
22 Properties |
| 2022 | £628,231 | 29% |
27 Properties |
| 2021 | £446,428 | 6% |
39 Properties |
| 2020 | £420,287 | -9% |
26 Properties |
| 2019 | £457,017 | -5% |
29 Properties |
| 2018 | £477,669 | 22% |
36 Properties |
| 2017 | £371,298 | -4% |
25 Properties |
| 2016 | £386,844 | -8% |
29 Properties |
| 2015 | £418,571 | 13% |
41 Properties |
| 2014 | £362,513 | 3% |
32 Properties |
| 2013 | £350,496 | -2% |
35 Properties |
| 2012 | £358,106 | 21% |
25 Properties |
| 2011 | £284,048 | -17% |
31 Properties |
| 2010 | £332,236 | 0,3% |
20 Properties |
| 2009 | £331,240 | -1% |
25 Properties |
| 2008 | £335,499 | 8% |
18 Properties |
| 2007 | £308,108 | -3% |
31 Properties |
| 2006 | £318,327 | -3% |
29 Properties |
| 2005 | £328,200 | 20% |
30 Properties |
| 2004 | £264,069 | 10% |
43 Properties |
| 2003 | £237,729 | 7% |
35 Properties |
| 2002 | £220,023 | 14% |
30 Properties |
| 2001 | £188,515 | 6% |
35 Properties |
| 2000 | £176,383 | 23% |
31 Properties |
| 1999 | £136,284 | 6% |
45 Properties |
| 1998 | £127,638 | 15% |
23 Properties |
| 1997 | £108,224 | 11% |
40 Properties |
| 1996 | £96,698 | 23% |
24 Properties |
| 1995 | £74,397 | - |
22 Properties |
Property Price per Property Type in West
Here you can find historic sold price data in order to help with your property search.
The average Property Paid Price for specific property types in the last three years are:
| Property Type | Average Sold Price | Sold Properties |
|---|---|---|
| Semi Detached House | £342,857.00 | 21 Semi Detached Houses |
| Detached House | £522,051.00 | 27 Detached Houses |
| Terraced House | £344,000.00 | 8 Terraced Houses |

